Abstract
Objective:
To determine the incidence of and risk factors for driving outcomes in drivers with Parkinson disease (PD).
Methods:
In a prospective cohort study, we ascertained the time until driving cessation, a crash, or a traffic citation using self-report and state Department of Transportation records in 106 licensed, active drivers with PD and 130 controls.
Results:
Drivers with PD stopped driving earlier than controls, hazard ratio (95% confidence interval) = 7.09 (3.66–13.75), p < 0.001. Cumulative incidence of driving cessation at 2 years after baseline was 17.6% (11.5%–26.5%) for PD and 3.1% (1.2%–8.1%) for controls. No significant differences between groups on times to first crash or citation were detected. However, the number of observed crashes was low. Cox proportional hazards models showed that significant baseline risk factors for driving cessation in PD were older age, preference to be driven by somebody else, positive crash history, use of compensatory strategies, low driving exposure, impairments in visual perception (especially visual processing speed and attention) and cognitive abilities, parkinsonism (especially activities of daily living score and total daily dose of antiparkinsonian medications), and higher error counts on a road test. Within PD, crashes were associated with poorer postural stability and history of driving citations, and citations were associated with younger age and road errors at baseline.
Conclusions:
Drivers with PD are at a higher risk of driving cessation than elderly control drivers. A battery evaluating motor and nonmotor aspects of PD, driving record, and performance can be useful in assessing future driving outcomes in PD. Neurology® 2011;76:1894–1902
Cognitive, visual, and motor impairments in Parkinson disease (PD) can affect driving performance on standardized road tests1–11 and driving simulator experiments.12–16 Cross-sectional or retrospective surveys show higher rates of driving cessation in PD,17–21 which may lead to greater inactivity, social isolation, depression, and caregiver burden.22,23 Driving simulation studies have shown increased crash rates in PD13,16 and retrospective surveys have suggested increased crashes in drivers with PD.17,19 However, real-life driving outcomes in PD have not been determined in prospective, controlled PD cohort studies.21
This study examines the real-life outcomes in a PD driver cohort, whose baseline features, experimental road test, and driving simulator performance were reported previously.1,5,6,8,16 The main outcome measures in this study were time to driving cessation, time to first crash, and time to first citation. We hypothesized that the incidence of unfavorable real-life driving outcomes in drivers with PD would be higher than in neurologically normal control drivers, and that these outcomes in PD could be associated with demographic features, driving habits and history, cognition, vision, parkinsonism, and road test performance at baseline.
METHODS
Subjects.
All subjects (106 with PD, 130 controls) were independently living, licensed, experienced (greater than 10 years), active drivers. Drivers with PD were recruited from the Movement Disorders Clinics at the Department of Neurology, University of Iowa, and Veterans Affairs Medical Center, both in Iowa City. Exclusion criteria included presence of acute illness, confounding active medical or psychiatric or visual conditions, secondary parkinsonism, and Parkinson-plus syndromes.1,5,6,8,16
Standard protocol approvals, registrations, and patient consents.
The study was approved by the Institutional Review Boards and Human Subjects Office of the University of Iowa. A written informed consent was obtained from all participants in the study.
Driving outcomes.
Driving cessation.
We determined the driving status and date of driving cessation by reviewing data collected from multiple sources including follow-up telephone calls conducted 3 to 7 years after baseline assessment, clinic records, Driving Habits Questionnaire (DHQ)24 during annual study visits, state driving records, and death dates from the Social Security Death Index if no other information was available. We reviewed Iowa Department of Transportation (DOT) driving records, which were requested once per year for a minimum of 4 years following baseline for indication of license suspension, revocation, or rescission. Based on the above, the earliest evidence of driving cessation was used to calculate elapsed time since baseline. For cases where no evidence of driving cessation was noted, we used the last date of known driving as the censoring time for this outcome.
Moving violations.
Moving violations were tracked from annually requested Iowa DOT driving records.
Motor vehicle crashes.
Motor vehicle crashes were tracked from the DHQ24 and from Iowa DOT driving records. Detailed police reports for each crash listed on a participant's driving record were used to determine if the driver was at fault. The first evidence of a crash from any of these sources was used to calculate the time elapsed since baseline.
Potential risk factors of real-life outcomes.
We used demographic factors, driving history, performance on an experimental road test, and measures of cognition, vision, mood, and parkinsonism at baseline as independent variables. We used a detailed battery to capture the multifaceted motor and nonmotor (e.g., cognitive, visual) manifestations of PD as described in our previous work (see appendix e-1 on the Neurology® Web site at www.neurology.org).1–16 For all tests, raw scores were used for analysis.25
We assessed driving habits and history using the DHQ.24 The DHQ is interviewer-administered and includes information on current driving status and self-assessed quality of driving, driving exposure (e.g., miles/week, days/week), dependence on other drivers, driving difficulty under specific situations (e.g., night, rush hour), driving space, and self-reported crashes and citations. A risk-lowering score was calculated by adding up number of driving situations which the driver avoided over the last 2 months before baseline (e.g., not driving at night, maximum = 8).
The experimental drive was conducted aboard an instrumented vehicle across different road types, and lasted approximately 45 minutes.1,5,6,8 The drivers with PD were tested during periods of optimal motor symptom control. The subjects were told to drive as they would in their usual life. A professional driving instructor reviewed the drive tapes and assessed the number and type of safety errors based on the Iowa DOT Drive Test Scoring Standards (2005 version).1
Statistical analysis.
We calculated descriptive statistics for baseline variables (e.g., demographic features, vision, cognition, driving history, and habits) in the control and PD (also indices of parkinsonism) groups. The groups were compared using the Wilcoxon rank sum test and Fisher exact test, depending on the scale of the variable. Relationships between driving habits and cognition, vision, and parkinsonism were explored using Spearman rank correlations within PD.
We first compared the occurrence of our 3 outcomes between groups using Fisher exact test. To accommodate the varying amounts of follow-up from driver to driver, we used survival analysis methods. Our defined real-life driving outcome variables were the time from the baseline evaluation to driving cessation, to the occurrence of first crash, and to the first citation. Follow-up times were censored at the last available evaluation for subjects who did not experience any of these 3 outcomes. These time-to-event outcomes were analyzed using Kaplan-Meier curves to estimate the probability of avoiding these outcomes over time, with the complements of these probabilities termed as cumulative incidences. These estimates and their standard errors were used to obtain 95% confidence intervals for cumulative incidences at selected times. Log rank tests were used to make unadjusted between-group comparisons based on the Kaplan-Meier curves. Cox proportional hazards regression models were used to compare the risk of these events between groups with adjustment for key covariates, namely, age, gender, education, and miles driven per week at baseline. Additional adjustments were done as indicated.
Cox proportional hazards regression models examined associations between potential risk factors and the time to real-life driving outcomes within drivers with PD. For each outcome, hazard ratios (HR) for individual risk factor variables (e.g., cognitive, visual, parkinsonism, self-report on driving characteristics) were adjusted for demographic factors (age, education, gender) and driving exposure (miles/week). To facilitate comparisons across risk factors, the HRs were expressed in terms of 1 SD change in the risk factor unless otherwise specified. All p values throughout this report are for 2-sided alternative hypotheses.
RESULTS
Baseline characteristics.
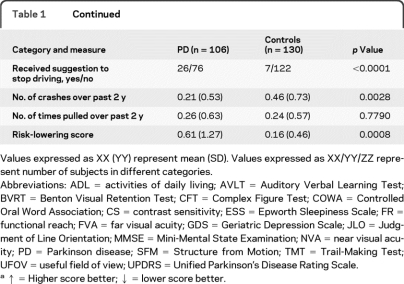
Baseline characteristics are detailed in table 1. The drivers with PD had mild to moderate disease severity. The PD group was significantly younger, less educated, had a greater proportion of men, performed worse on neuropsychological and visual tests (with deficits in the mild to moderate range), and committed more road driving safety errors than controls. Drivers with PD rated their own driving quality significantly less favorably then the controls. A significantly higher proportion of drivers with PD had received a suggestion to stop driving before enrolling in the study. Drivers with PD reported no difference in citation numbers, but fewer total crashes (major or minor, at fault, or not at fault) within the last 2 years before enrollment. They had a similar driving exposure compared to controls in terms of miles driven per week, but drove fewer days per week than controls, and reported significantly higher number of risk-lowering practices (compensation strategies).
Table 1.
Baseline descriptive statistics of subject groups, with between-group comparisonsa
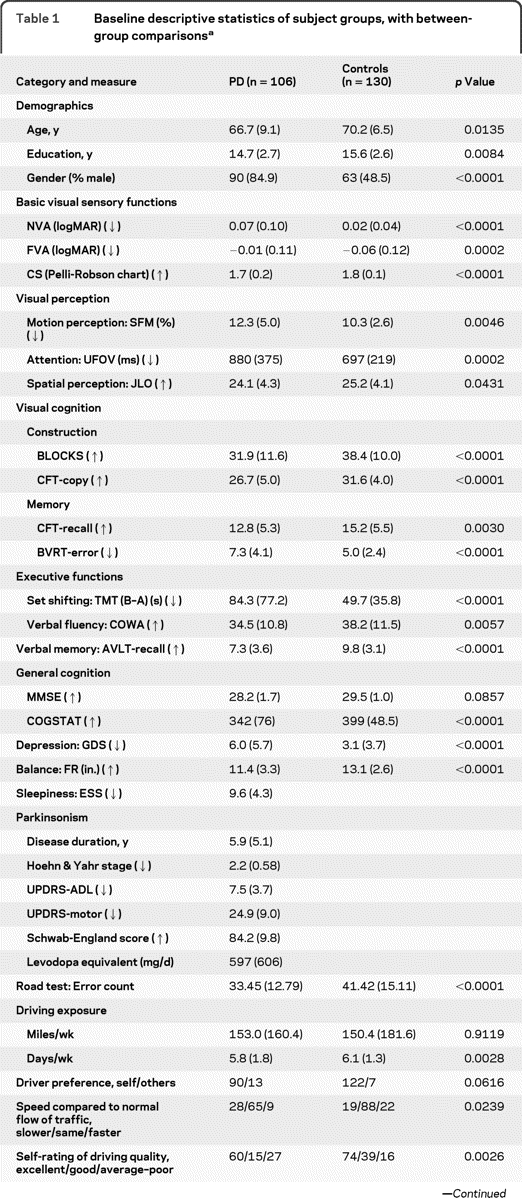
Values expressed as XX (YY) represent mean (SD). Values expressed as XX/YY/ZZ represent number of subjects in different categories.
Abbreviations: ADL = activities of daily living; AVLT = Auditory Verbal Learning Test; BVRT = Benton Visual Retention Test; CFT = Complex Figure Test; COWA = Controlled Oral Word Association; CS = contrast sensitivity; ESS = Epworth Sleepiness Scale; FR = functional reach; FVA = far visual acuity; GDS = Geriatric Depression Scale; JLO = Judgment of Line Orientation; MMSE = Mini-Mental State Examination; NVA = near visual acuity; PD = Parkinson disease; SFM = Structure from Motion; TMT = Trail-Making Test; UFOV = useful field of view; UPDRS = Unified Parkinson's Disease Rating Scale.
↑ = Higher score better; ↓ = lower score better.
Driving cessation.
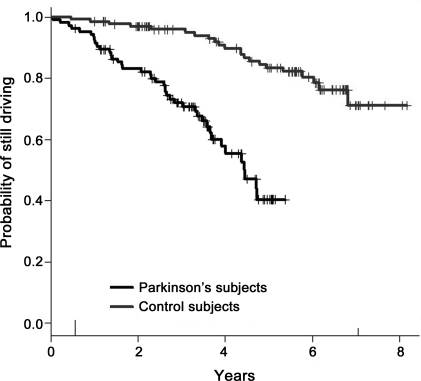
Throughout the follow-up period, 43 (40.6%) drivers with PD ceased driving compared to 22 (16.9%) control drivers (p < 0.0001). Accommodating the varying follow-up times, survival analysis confirmed that the drivers with PD were at a higher risk for driving cessation in comparison to controls over the whole follow-up period (figure), with a log rank χ2 of 37.5 (p < 0.0001) and an estimated HR (95% confidence interval [CI]) of 7.09 (3.66–13.75), adjusted for age, gender, education, and miles/week at baseline. The Kaplan-Meier plot (figure) shows the probability of still driving (or inversely, the risk of driving cessation) at any particular timepoint during the follow-up and allows visual comparison between groups for between-group comparisons over time. For example, the cumulative incidence (95% CI) of driving cessation at 2 years after baseline was 17.6% (11.5%–26.5%) for PD and 3.1% (1.2%–8.1%) for controls.
Figure.
Kaplan-Meier survival curves for driving cessation (log rank test χ2 = 37.53, p < 0.0001) between subjects with Parkinson disease and elderly control subjects
We used the date of death from the Social Security Death Index as date of driving cessation in 4 PD and 12 control drivers above when no other information on driving status was available. However, due to uncertainty of driving status of these subjects soon before their deaths, we also analyzed time to driving cessation using the death times in these 16 subjects as a censoring time. The HR for PD in this analysis (adjusted for age, education, gender, miles driven per week at baseline) was 15.06 (6.17–36.81). Though this estimate was higher than the estimate above (7.09 [3.66–13.75]), the HR CIs for the 2 approaches overlapped substantially, and we used our initial approach for analyses of risk factors for driving cessation within PD.
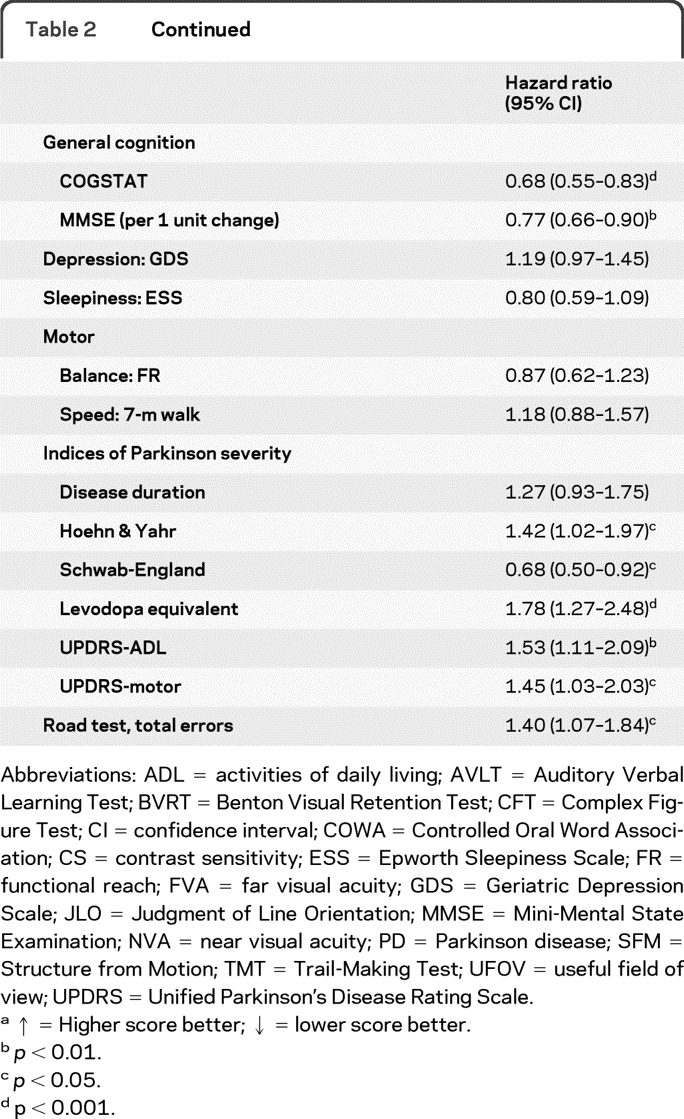
Significant individual risk factors (adjusted for age, driving exposure, education, gender as appropriate) for driving cessation within PD (table 2) included older age, decreased driving exposure, poorer ratings of driving ability by self and others, higher number of past crashes, and a higher risk-lowering score on DHQ; poorer performances in most measures of vision; and higher severity of parkinsonism. Additionally, higher number of road errors at baseline was associated with increased risk for driving cessation.
Table 2.
Hazard ratios for individual risk factors for driving cessation within PD (n = 101) per 1 SD change in baseline measures and driving errors on the road test within PD, adjusted for age, gender, education, and miles driven at baseline (starting with variable driver preference)a
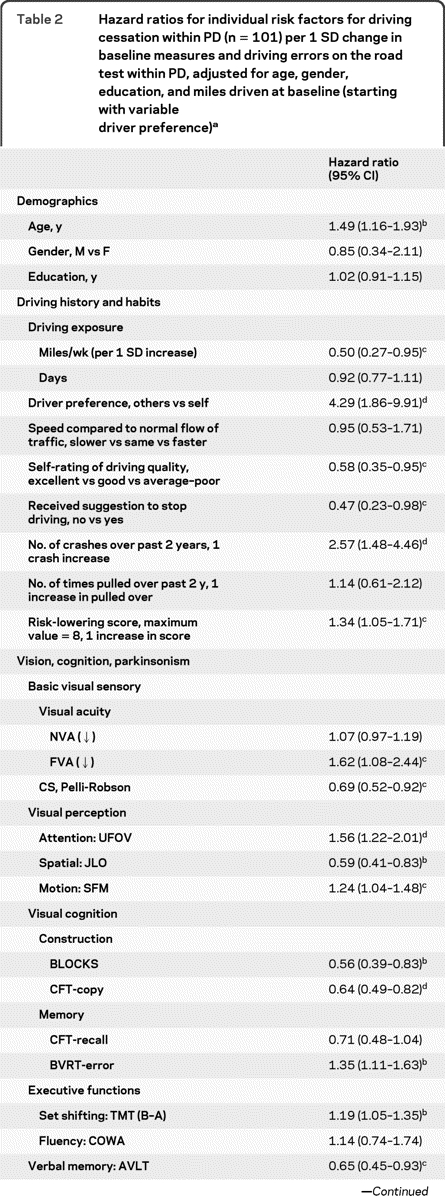
Abbreviations: ADL = activities of daily living; AVLT = Auditory Verbal Learning Test; BVRT = Benton Visual Retention Test; CFT = Complex Figure Test; CI = confidence interval; COWA = Controlled Oral Word Association; CS = contrast sensitivity; ESS = Epworth Sleepiness Scale; FR = functional reach; FVA = far visual acuity; GDS = Geriatric Depression Scale; JLO = Judgment of Line Orientation; MMSE = Mini-Mental State Examination; NVA = near visual acuity; PD = Parkinson disease; SFM = Structure from Motion; TMT = Trail-Making Test; UFOV = useful field of view; UPDRS = Unified Parkinson's Disease Rating Scale.
↑ = Higher score better; ↓ = lower score better.
p < 0.01.
p < 0.05.
p < 0.001.
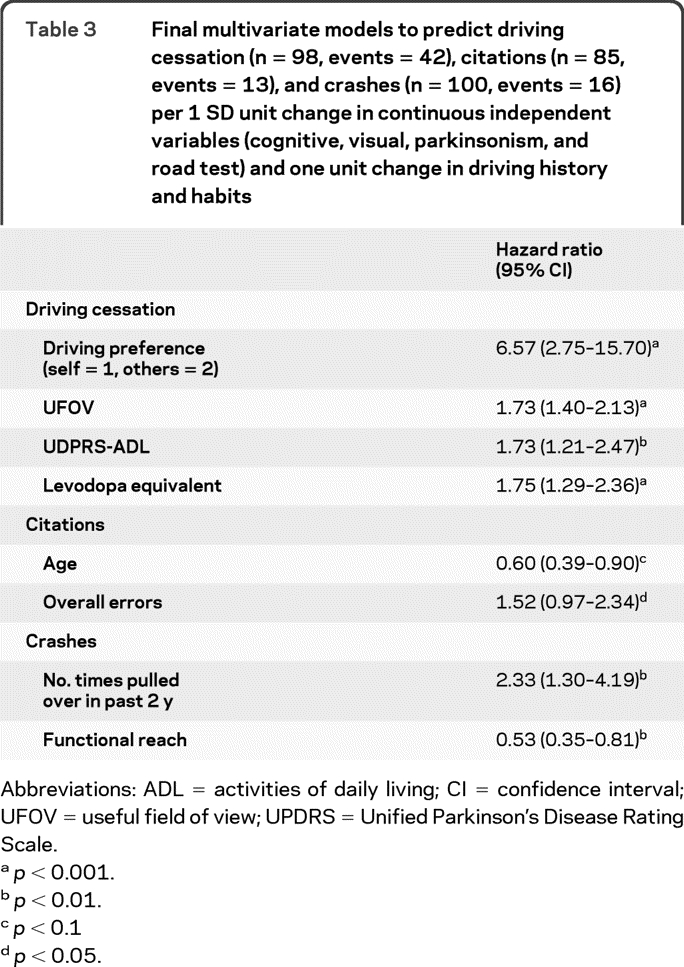
A multivariate analysis of risk factors in PD showed a preference to be driven by others, higher useful field of view (UFOV) total score, higher Unified Parkinson's Disease Rating Scale–activities of daily living (UPDRS-ADL) score, and higher daily levodopa equivalent as simultaneous risk factors for driving cessation (table 3).
Table 3.
Final multivariate models to predict driving cessation (n = 98, events = 42), citations (n = 85, events = 13), and crashes (n = 100, events = 16) per 1 SD unit change in continuous independent variables (cognitive, visual, parkinsonism, and road test) and one unit change in driving history and habits
Abbreviations: ADL = activities of daily living; CI = confidence interval; UFOV = useful field of view; UPDRS = Unified Parkinson's Disease Rating Scale.
p < 0.001.
p < 0.01.
p < 0.1
p < 0.05.
Crashes.
Throughout the follow-up period, 16 (15.5%) drivers with PD experienced at least one crash compared to 45 (34.9%) control drivers (p = 0.0009 by Fisher exact test). However, this analysis does not take the different follow-up periods and much higher attrition in the drivers with PD into account. A survival analysis of time to first crash revealed no difference between groups in crash risk (log rank χ2 = 0.90, p value = 0.3432), with an estimated HR for PD of 0.92 (0.47–1.80), adjusted for age, education, gender, and miles driven per week at baseline. As an example, the cumulative incidence of crashes at 2 years was 13.4% (7.8%–22.5%) for PD and 17.2% (11.7–24.9%) for controls. As there were differences at baseline in days driven per week (less in PD) and number of crashes within the 2 years before enrollment (higher in controls), we adjusted HR analysis additionally for these 2 baseline features and again found no significant difference between groups: the HR for PD was 1.02 (0.51–2.04), p = 0.438. Furthermore, the analysis of only at-fault crashes (5 PD, 14 controls) showed no significant difference between the groups, either by analysis of proportions throughout the follow-up period (Fisher exact test, p = 0.154) or by analysis of time to first at-fault crash (χ2 = 0.064, p = 0.7999). As 3.4% of our drivers had multiple crashes, we employed a separate Cox regression model including repeated events and still found no significant difference (p = 0.3356). Although we found no significant association between having PD and crashes, it should be noted that the 95% CI for the hazard ratio (0.47–1.80) is very wide. To explore this issue more fully, we performed sample size and power calculations26 and found that, in order to have 80% power to detect a hazard ratio of 1.50, a study would need to observe 190 crashes. Our study with 61 crashes only had 35% power to detect a hazard ratio of 1.50.
Higher number of instances of being pulled over in the 2 years preceding baseline (HR = 1.86 [1.02–3.39]), and lower functional reach scores (HR = 0.59 [0.39–0.88]) were the only univariate and multivariate simultaneous risk factors of time to first crash within PD (table 3).
Citations.
Throughout the follow-up period, 16 drivers with PD (15.1%) received at least 1 citation compared to 36 (28.1%) control drivers (p = 0.027, Fisher exact test). When taking different follow-up times into account, there was no difference between groups in time to first citation (χ2 = 0.004, p = 0.9484); the estimated HR for PD was 0.89 (0.43–1.85), adjusting for age, gender, education, and mile/week driven at baseline. The cumulative incidence of citations at 2 years was 13.0% (7.4%–22.2%) for PD and 11.8% (7.3–18.9%) for controls. As 7.6% of our drivers had multiple citations, we employed a separate Cox regression model and still found no significant difference (p = 0.7182). As with the crash outcome, we would need to have 190 citations to have 80% power to detect a hazard ratio of 1.50. With only 51, we only had 30% power to detect this magnitude of effect size.
Younger age (HR = 0.62 [0.43–0.90]) and higher education (HR = 1.27 [1.03–1.57]), higher number of times pulled over the 2 years preceding baseline (HR = 2.00 [1.07–3.76]), and longer duration of PD (HR = 1.77 [1.10–2.85]) were the only significant individual risk factors of time to first citation. Multivariate analysis revealed higher age and higher counts of road driving test errors as simultaneous risk factors of time to first citation (table 3).
There was a strong association between occurrence of crashes and receiving citations in the drivers with PD during the follow-up period: 44% of crashers received a citation, whereas only 12% of noncrashers received one (Fisher exact test, p = 0.0053). There were 7 subjects with PD who had both a crash and a ticket event: 2 subjects had a crash and a ticket on the same date, 3 subjects had a ticket prior to a crash, and 2 subjects had a crash prior to a ticket. There was no association between driving cessation and occurrence of crashes (p = 0.2686) or receiving citations (p = 0.4095).
Associations between risk-lowering practices and measures of cognition, vision, and parkinsonism.
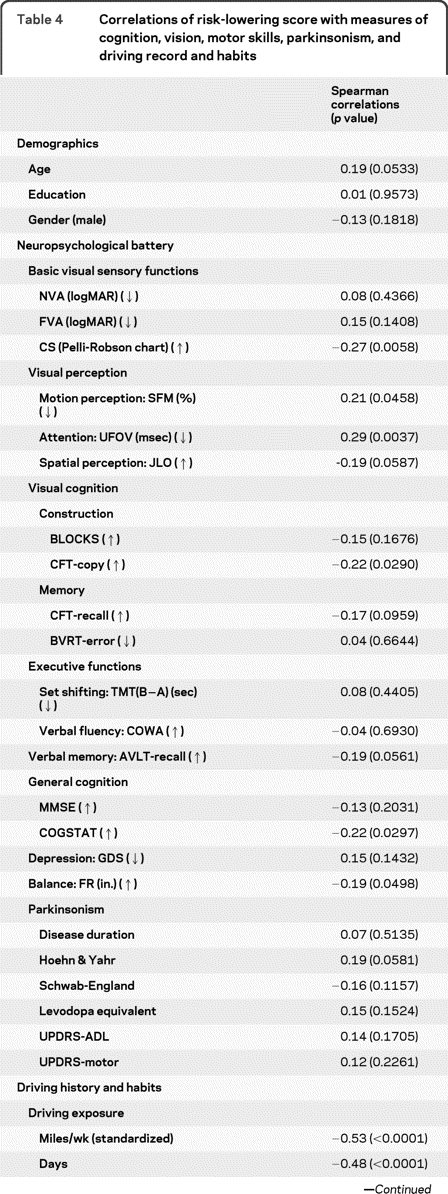
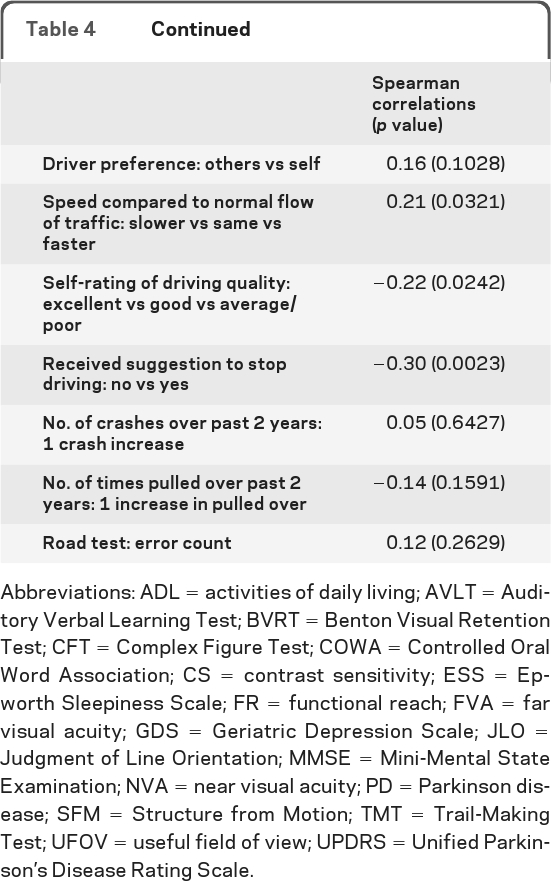
Table 4 shows that higher number of driving risk-lowering practices in PD was associated with higher age and stage of parkinsonism, poorer performances on tests of vision and cognition, lower driving exposure, and poorer ratings on driving in DHQ.
Table 4.
Correlations of risk-lowering score with measures of cognition, vision, motor skills, parkinsonism, and driving record and habits
Abbreviations: ADL = activities of daily living; AVLT = Auditory Verbal Learning Test; BVRT = Benton Visual Retention Test; CFT = Complex Figure Test; COWA = Controlled Oral Word Association; CS = contrast sensitivity; ESS = Epworth Sleepiness Scale; FR = functional reach; FVA = far visual acuity; GDS = Geriatric Depression Scale; JLO = Judgment of Line Orientation; MMSE = Mini-Mental State Examination; NVA = near visual acuity; PD = Parkinson disease; SFM = Structure from Motion; TMT = Trail-Making Test; UFOV = useful field of view; UPDRS = Unified Parkinson's Disease Rating Scale.
DISCUSSION
The findings in this prospective study supported the hypothesis that the incidence of driving cessation in drivers with PD was higher than in neurologically healthy control drivers. There were no differences between the groups in the incidence of crashes or citations during the follow-up period, but this was associated with low power for detection of a meaningful difference in these outcomes. Driving outcomes, especially cessation, in the PD group were associated with demographic factors, severity of parkinsonism, performance on cognitive, visual, motor, and road tests, as well as driving record, exposure, and habits, suggesting need for a multidimensional approach to evaluate drivers with PD.
Our results are consistent with prior reports that PD is associated with increased driving cessation20 and no clear link could be established with PD and occurrence of real-life crashes.27,28 However, these prior studies concentrated on general elderly population and had few drivers with PD in their cohorts. Our prospective, controlled study of 106 drivers with PD confirms the increased incidence of driving cessation and identifies risk factors for this important milestone.
The DHQ results show that many drivers with PD (and their caregivers) had insight into their driving impairment as evidenced by poorer self-ratings and suggestions by others to stop driving. They restricted their driving initially using self-regulation and compensation strategies, followed by complete driving cessation.
Cognitive and visual impairments and the severity of parkinsonism were associated with driving cessation in the PD group. Reduced speed of visual processing/attention (measured with UFOV score) was an independent risk factor in line with studies of driving cessation in aging.29,30 The UPDRS-ADL score (risk factor for “ex-driver” status in a cross-sectional study31) and the daily total levodopa equivalent amount were independent risk factors of future driving cessation in the multivariate model suggesting that these measures better predict future functional impairment compared to the motor UPDRS score in the medicated (“on”) phase.
Although we did not find a difference in crashes between the PD and control groups using time-to-event survival analyses and in the proportion of at-fault crashes prospectively, the proportion of overall crashers was significantly higher in the controls compared to the PD group. This seemingly counterintuitive result is consistent with findings in AD,32 where a significantly higher percentage of normal controls experienced crashes during the 3-year study period, which was attributed to the attrition of potentially unsafe drivers with AD.32 Similarly, drivers with PD with worse impairments were more likely to cease driving before a potential crash occurred. Additional explanations for not finding increased incidence of crashes and citations within the PD group may include restricted driving and strategic compensation, relatively small sample size, or recruitment bias.
The risk factors for crashes and citations identified in this study should be considered as preliminary due to low number of events. The association of younger age with higher citation rates suggests lesser risk-taking behavior of older drivers with PD. The association of poorer postural stability with crashes fits with observations that the severity of axial parkinsonism is an important risk factor for poor functional outcomes.33
The association of driving cessation and citations with higher road error counts at baseline is consistent with the observations that performance on standard road tests may predict real-life outcomes.34 However, our standardized road test might have represented only a snapshot of performance under relatively optimal dopaminergic treatment conditions and affected by the presence of an examiner. We expect that “naturalistic” studies of driver behavior (a person driving his or her own instrumented vehicle for a long period of time under usual driving circumstances) would enable richer sampling of driver performance (errors, near-crashes, crashes)35–37 and help in developing cutoffs for predictive tests and definitive models for driving outcomes in PD.38
There are no evidence-based practice parameters for driving in PD to date. However, recent National Highway Traffic Safety Administration39 and Federal Motor Carrier Safety Administration40 guidelines suggest a case-by-case, multidisciplinary evaluation of the patient due to the highly individualized nature of the disease and variable progression. Assessment of visual and cognitive abilities and severity of parkinsonism can inform about potential risk for undesirable driving outcomes. Additional information can be obtained from recent driving record and insights provided by the patient and family into driving safety concerns or changes in driver habits (e.g., compensation strategies to lower risk).
Supplementary Material
Supplemental data at www.neurology.org
- ADL
- activities of daily living
- CI
- confidence interval
- DHQ
- Driver Habits Questionnaire
- DOT
- Department of Transportation
- HR
- hazard ratio
- PD
- Parkinson disease
- UFOV
- useful field of view
- UPDRS
- Unified Parkinson's Disease Rating Scale.
AUTHOR CONTRIBUTIONS
Statistical analysis was conducted by Dr. J.D. Dawson, A.M. Johnson, E.D. Mills, and Dr. D. Liu.
DISCLOSURE
Dr. Uc has served as a grant reviewer for the NIH and the Parkinson Study Group and has received research support from the NIH/NINDS, the US Department of Veterans Affairs, and the Parkinson's Disease Foundation. Dr. Rizzo has received research support from the NIH. A.M. Johnson has received scholarship support from Nissan and research support from the NIH. J.L. Emerson receives research support from the NIH/NIA. Dr. Liu receives research support from the NIH/NINDS. E.D. Mills has received research support from the NIH. Dr. Anderson receives research support from NIH/NINDS and the US Department of Veterans Affairs. Dr. Dawson serves on data safety monitoring boards for the NIH; has received funding for travel and honoraria from the Manila Consulting Group; has served as a grant reviewer for the NIH and the Canada Foundation for Innovation; and receives research support from the NIH and the US Department of Veterans Affairs.
REFERENCES
- 1. Uc EY, Rizzo M, Johnson AM, et al. Road safety in drivers with Parkinson disease. Neurology 2009;73:2112–2119 [DOI] [PMC free article] [PubMed] [Google Scholar]
- 2. Heikkila VM, Turkka J, Korpelainen J, et al. Decreased driving ability in people with Parkinson's disease. J Neurol Neurosurg Psychiatry 1998;64:325–330 [DOI] [PMC free article] [PubMed] [Google Scholar]
- 3. Wood JM, Worringham C, Kerr G, et al. Quantitative assessment of driving performance in Parkinson's disease. J Neurol Neurosurg Psychiatry 2005;76:176–180 [DOI] [PMC free article] [PubMed] [Google Scholar]
- 4. Grace J, Amick MM, D'Abreu A, et al. Neuropsychological deficits associated with driving performance in Parkinson's and Alzheimer's disease. J Int Neuropsychol Soc 2005;11:766–775 [DOI] [PMC free article] [PubMed] [Google Scholar]
- 5. Uc EY, Rizzo M, Anderson SW, et al. Driving with distraction in Parkinson disease. Neurology 2006;67:1774–1780 [DOI] [PubMed] [Google Scholar]
- 6. Uc EY, Rizzo M, Anderson SW, et al. Impaired visual search in drivers with Parkinson's disease. Ann Neurol 2006;60:407–413 [DOI] [PubMed] [Google Scholar]
- 7. Worringham CJ, Wood JM, Kerr GK, et al. Predictors of driving assessment outcome in Parkinson's disease. Mov Disord 2006;21:230–235 [DOI] [PubMed] [Google Scholar]
- 8. Uc EY, Rizzo M, Anderson SW, et al. Impaired navigation in drivers with Parkinson's disease. Brain 2007;130:2433–2440 [DOI] [PubMed] [Google Scholar]
- 9. Devos H, Vandenberghe W, Nieuwboer A, et al. Predictors of fitness to drive in people with Parkinson disease. Neurology 2007;69:1434–1441 [DOI] [PubMed] [Google Scholar]
- 10. Cordell R, Lee HC, Granger A, et al. Driving assessment in Parkinson's disease: a novel predictor of performance? Mov Disord 2008;23:1217–1222 [DOI] [PubMed] [Google Scholar]
- 11. Classen S, McCarthy DP, Shechtman O, et al. Useful field of view as a reliable screening measure of driving performance in people with Parkinson's disease: results of a pilot study. Traffic Inj Prev 2009;10:593–598 [DOI] [PubMed] [Google Scholar]
- 12. Stolwyk RJ, Triggs TJ, Charlton JL, et al. Impact of internal versus external cueing on driving performance in people with Parkinson's disease. Mov Disord 2005;20:846–857 [DOI] [PubMed] [Google Scholar]
- 13. Zesiewicz TA, Cimino CR, Malek AR, et al. Driving safety in Parkinson's disease. Neurology 2002;59:1787–1788 [DOI] [PubMed] [Google Scholar]
- 14. Stolwyk RJ, Charlton JL, Triggs TJ, et al. Neuropsychological function and driving ability in people with Parkinson's disease. J Clin Exp Neuropsychol 2006;28:898–913 [DOI] [PubMed] [Google Scholar]
- 15. Stolwyk RJ, Triggs TJ, Charlton JL, et al. Effect of a concurrent task on driving performance in people with Parkinson's disease. Mov Disord 2006;21:2096–2100 [DOI] [PubMed] [Google Scholar]
- 16. Uc EY, Rizzo M, Anderson SW, et al. Driving under low-contrast visibility conditions in Parkinson disease. Neurology 2009;73:1103–1110 [DOI] [PMC free article] [PubMed] [Google Scholar]
- 17. Dubinsky RM, Gray C, Husted D, et al. Driving in Parkinson's disease. Neurology 1991;41:517–520 [DOI] [PubMed] [Google Scholar]
- 18. Hobson DE, Lang AE, Martin WR, et al. Excessive daytime sleepiness and sudden-onset sleep in Parkinson disease: a survey by the Canadian Mov Disord Group. JAMA 2002;287:455–463 [DOI] [PubMed] [Google Scholar]
- 19. Meindorfner C, Korner Y, Moller JC, et al. Driving in Parkinson's disease: Mobility, accidents, and sudden onset of sleep at the wheel. Mov Disord 2005;20:832–842 [DOI] [PubMed] [Google Scholar]
- 20. Lafont S, Laumon B, Helmer C, et al. Driving cessation and self-reported car crashes in older drivers: the impact of cognitive impairment and dementia in a population-based study. J Geriatr Psychiatry Neurol 2008;21:171–182 [DOI] [PubMed] [Google Scholar]
- 21. Klimkeit EI, Bradshaw JL, Charlton J, et al. Driving ability in Parkinson's disease: current status of research. Neurosci Biobehav Rev 2009;33:223–231 [DOI] [PubMed] [Google Scholar]
- 22. Windsor TD, Anstey KJ. Interventions to reduce the adverse psychosocial impact of driving cessation on older adults. Clin Interv Aging 2006;1:205–211 [DOI] [PMC free article] [PubMed] [Google Scholar]
- 23. Marottoli RA, de Leon CFM, Glass TA, et al. Consequences of driving cessation: decreased out-of-home activity levels. J Gerontol B Psychol Sci Soc Sci 2000;55:S334–S340 [DOI] [PubMed] [Google Scholar]
- 24. Owsley C, Stalvey B, Wells J, et al. Older drivers and cataract: driving habits and crash risk. J Gerontol A Biol Sci Med Sci 1999;54:M203–M211 [DOI] [PubMed] [Google Scholar]
- 25. Barrash J, Stillman A, Anderson SW, et al. Prediction of driving ability with neuropsychological tests: demographic adjustments diminish accuracy. J Int Neuropsychol Soc 2010;16:679–686 [DOI] [PMC free article] [PubMed] [Google Scholar]
- 26. Piantadosi S. Clinical Trials: A Methodologic Perspective. New York: John Wiley & Sons; 1997:169 [Google Scholar]
- 27. Sims RV, McGwin G, Jr, Allman RM, et al. Exploratory study of incident vehicle crashes among older drivers. J Gerontol A Biol Sci Med Sci 2000;55:M22–M27 [DOI] [PubMed] [Google Scholar]
- 28. Hu PS, Trumble DA, Foley DJ, et al. Crash risks of older drivers: a panel data analysis. Accid Anal Prev 1998;30:569–581 [DOI] [PubMed] [Google Scholar]
- 29. Edwards JD, Ross LA, Ackerman ML, et al. Longitudinal predictors of driving cessation among older adults from the ACTIVE clinical trial. J Gerontol B Psychol Sci Soc Sci 2008;63:6–12 [DOI] [PubMed] [Google Scholar]
- 30. Edwards JD, Bart E, O'Connor ML, et al. Ten years down the road: predictors of driving cessation. Gerontologist 2010;50:393–399 [DOI] [PMC free article] [PubMed] [Google Scholar]
- 31. Cubo E, Martinez MP, Gonzalez M, et al. What contributes to driving ability in Parkinson's disease. Disabil Rehabil 2010;32:374–378 [DOI] [PubMed] [Google Scholar]
- 32. Ott BR, Heindel WC, Papandonatos GD, et al. A longitudinal study of drivers with Alzheimer disease. Neurology 2008;70:1171–1178 [DOI] [PMC free article] [PubMed] [Google Scholar]
- 33. Uc EY, McDermott MP, Marder KS, et al. Incidence of and risk factors for cognitive impairment in an early Parkinson disease clinical trial cohort. Neurology 2009;73:1469–1477 [DOI] [PMC free article] [PubMed] [Google Scholar]
- 34. De Raedt R, Ponjaert-Kristoffersen I. Predicting at-fault car accidents of older drivers. Accid Anal Prev 2001;33:809–819 [DOI] [PubMed] [Google Scholar]
- 35. Rizzo M, Uc EY, Dawson J, et al. Driving difficulties in Parkinson's disease. Mov Disord 2010;25(suppl 1):S136–S140 [DOI] [PMC free article] [PubMed] [Google Scholar]
- 36. Rizzo M. A 71-year-old man trying to decide if he should continue driving: clinical crossroads. JAMA 2011;305:1018–1026 [DOI] [PMC free article] [PubMed] [Google Scholar]
- 37. Rizzo M, Robinson S, Neale V. The brain in the wild. In: Parasuraman R, Rizzo M. eds. Neuroergonomics: Brain and Behavior at Work. Oxford: Oxford University Press; 2007:113–128 [Google Scholar]
- 38. Lees MN, Cosman JD, Fricke N, et al. Translating cognitive neuroscience to the driver's operational environment: a neuroergonomics approach. Am J Psychol 2010;123:391–411 [DOI] [PMC free article] [PubMed] [Google Scholar]
- 39. Driver Fitness Working Group of the American Association of Motor Vehicle Administrators (AAMVA) Driver Fitness Medical Guidelines. National Highway Traffic Safety Administration (NHTSA); 2009:24–28 [Google Scholar]
- 40. Caruso G, Dawson J, Deluca J, et al. Opinions of expert panel: Parkinson's disease, multiple sclerosis, and commercial motor vehicle driver safety. Presented to the Federal Motor Carrier Safety Administration, 2009. Available at: http://www.fmcsa.dot.gov/rules-regulations/TOPICS/mep/report/PD_MS_MEP_Opinions_09212009.pdf Accessed December 27, 2010
Associated Data
This section collects any data citations, data availability statements, or supplementary materials included in this article.


