

Non-technical summary
Glycine receptors (GlyRs) play an important role in inhibiting neurone activity in the spinal cord. Until recently adult GlyRs were thought to comprise α1 and β subunits. A new form of the receptor containing α3 subunits has been discovered in the superficial dorsal horn (SDH), a region of the spinal cord important for pain. This raises questions about the precise subunit composition of GlyRs and glycinergic synapses in the SDH. We used the spasmodic mouse, where α1 subunit containing GlyRs have altered agonist sensitivity and electrophysiological properties, to ask how α1 and α3 subunits are assembled to form GlyRs on SDH neurones. We found most (∼75%) GlyRs and glycinergic synapses in the SDH contain α1 subunits and few are composed exclusively of α3 subunits. Therefore, future efforts to design pain drugs that target the α3 subunit must consider the potential interaction between α1 and α3 subunits in the GlyR.
Abstract
Abstract
Inhibitory glycine receptors (GlyRs) are pentameric ligand gated ion channels composed of α and β subunits assembled in a 2:3 stoichiometry. The α1/β heteromer is considered the dominant GlyR isoform at ‘native’ adult synapses in the spinal cord and brainstem. However, the α3 GlyR subunit is concentrated in the superficial dorsal horn (SDH: laminae I–II), a spinal cord region important for processing nociceptive signals from skin, muscle and viscera. Here we use the spasmodic mouse, which has a naturally occurring mutation (A52S) in the α1 subunit of the GlyR, to examine the effect of the mutation on inhibitory synaptic transmission and homeostatic plasticity, and to probe for the presence of various GlyR subunits in the SDH. We used whole cell recording (at 22–24°C) in lumbar spinal cord slices obtained from ketamine-anaesthetized (100 mg kg−1, i.p.) spasmodic and wild-type mice (mean age P27 and P29, respectively, both sexes). The amplitude and decay time constants of GlyR mediated mIPSCs in spasmodic mice were reduced by 25% and 50%, respectively (42.0 ± 3.6 pA vs. 31.0 ± 1.8 pA, P < 0.05 and 7.4 ± 0.5 ms vs. 5.0 ± 0.4 ms, P < 0.05; means ± SEM, n = 34 and 31, respectively). Examination of mIPSC amplitude versus rise time and decay time relationships showed these differences were not due to electrotonic effects. Analysis of GABAAergic mIPSCs and A-type potassium currents revealed altered GlyR mediated neurotransmission was not accompanied by the synaptic or intrinsic homeostatic plasticity previously demonstrated in another GlyR mutant, spastic. Application of glycine to excised outside-out patches from SDH neurones showed glycine sensitivity was reduced more than twofold in spasmodic GlyRs (EC50= 130 ± 20 μmvs. 64 ± 11 μm, respectively; n = 8 and 15, respectively). Differential agonist sensitivity and mIPSC decay times were subsequently used to probe for the presence of α1-containing GlyRs in SDH neurones. Glycine sensitivity, based on the response to 1–3 μm glycine, was reduced in >75% of neurones tested and decay times were faster in the spasmodic sample. Together, our data suggest most GlyRs and glycinergic synapses in the SDH contain α1 subunits and few are composed exclusively of α3 subunits. Therefore, future efforts to design therapies that target the α3 subunit must consider the potential interaction between α1 and α3 subunits in the GlyR.
Introduction
Glycine receptors (GlyRs) are pentameric ligand-gated ion channels that mediate fast inhibitory synaptic transmission in the spinal cord and brainstem (Legendre, 2001; Lynch, 2004; Callister & Graham, 2010). In vivo or ‘native’ GlyRs are heteromers and consist of five known subunits (α1–4 and β), assembled in a 2α:3β stoichiometry (Grudzinska et al. 2005). The α subunit contains the ligand-binding domain whereas the β subunit, via its attachment to the tubulin binding protein gephyrin, anchors the receptor to the cytoskeleton (Langosch et al. 1992). Developmental studies have shown that the adult form of the receptor (α1/β heteromer) is not fully expressed until 2 weeks after birth and is the dominant GlyR isoform at adult synapses in the spinal cord and brainstem (Singer et al. 1998).
A number of naturally occurring mutations exist in the various GlyR subunits and study of mutant receptors obtained from humans, cattle, horses, dogs and mice have advanced our understanding of GlyR function (Rajendra & Schofield, 1995; Callister & Graham, 2010). These mutations compromise GlyR function and result in an overt motor or ‘startle’ phenotype which is characterised by exaggerated responses to unexpected sensory stimuli, resting tremor, and impaired righting reflexes (Simon, 1995). Accordingly, much of the work describing GlyR mutations, particularly in the murine mutants spastic, oscillator and spasmodic, has focused on dysfunction in CNS regions that serve motor functions (Heller & Hallett, 1982; Biscoe & Duchen, 1986; Hartenstein et al. 1996; Becker et al. 2000; von Wegerer et al. 2003; Molon et al. 2006; Graham et al. 2006).
Because the murine mutants exhibit an exaggerated response to sensory stimuli and the established role for GlyRs in sensory processing, we have previously analysed the impact of the spastic and oscillator mutations on sensory processing in the superficial dorsal horn (SDH; lamina I–II) of the spinal cord. These experiments showed that the spastic mutation, which reduces β subunit expression and synaptically located GlyRs, substantially reduces glycinergic inhibition in SDH circuits. In addition, two examples of ‘compensation’ or homeostatic plasticity were identified that could stabilize dorsal horn circuits and thus maintain relatively normal sensory processing in the SDH of the spastic mouse (Graham et al. 2003, 2007). These compensatory mechanisms in the spastic mouse include enhanced GABAAergic inhibition and increased A-type potassium current function. The oscillator mutation, which has a microdeletion in the α1 subunit, is lethal by the third postnatal week. Interestingly, the dramatically reduced glycinergic inhibition in oscillator does not engage the above compensatory mechanisms (Graham et al. 2003). These data indicate that the effects of GlyR mutations on SDH circuits may be mutation dependent.
The impact of the spasmodic mutation on spinal sensory processing has not yet been investigated. Spasmodic mice possess a single point mutation (A52S) in the GlyR α1 subunit. Binding studies have shown that GlyR levels are relatively normal in this mutant (Lane et al. 1987; Ryan et al. 1994; Saul et al. 1994); however, functional studies in recombinant receptors indicate agonist sensitivity is diminished and mean channel open time is reduced (Rajendra & Schofield, 1995; Legendre, 2001; Lynch, 2004; Plested et al. 2007). We have assessed the effects of this mutation at in vivo or ‘native’ synaptic connections in brainstem motoneurones and shown the main effect of the mutation is to reduce the decay time of glycinergic mIPSCs (Graham et al. 2006).
As noted previously, the α1/β isoform of the GlyR dominates at most ‘native’ adult synapses in the spinal cord and brainstem. This, however, is not the case for the SDH where sensory signals, including those associated with nociception, are processed. Unlike other CNS regions, the α3 GlyR isoform is highly expressed in the SDH (Harvey et al. 2004). This is important in the context of examining the effects of the spasmodic mutation, which resides in the α1 subunit, as the presence of α3 subunits in the SDH may lessen the impact of the mutation. Here we use the spasmodic mouse to examine the effect of this mutation on inhibitory synaptic transmission and homeostatic plasticity, and to probe for the presence of various GlyR isoforms in the SDH.
Methods
All procedures were approved by The University of Newcastle Animal Care and Ethics Committee and comply with the policies and regulations of The Journal of Physiology as outlined by Drummond (2009). Spasmodic mice (both sexes) backcrossed onto the C57Bl/6 genetic background were obtained from The Jackson Laboratory (Bar Harbor, ME, USA) and bred by mating heterozygous (spd/+) males and females. Using this breeding regime, 25% of the progeny are homozygous and exhibit the characteristic ‘startle’ motor phenotype. Homozygous affected spd/spd animals are easily identified approximately 2 weeks after birth according to four criteria: (1) constant resting tremor; (2) clenching of hind limbs when picked up by the tail; (3) an impaired righting reflex; and (4) a tendency to walk on tip-toes with an arched back (Simon, 1995; Graham et al. 2006). The overt phenotype of homozygous spasmodic mice meant the experimenter was not blinded to genotype. Wild-type C57Bl/6 mice (both sexes) bred and maintained under identical conditions were used as controls.
Tissue preparation
Spinal cord slices were prepared using standard techniques (Yoshimura & Jessell, 1989; Graham et al. 2003). Briefly, animals (wild-type and spasmodic mice; aged P25–35 and P23–42, respectively) were anaesthetised with ketamine (100 mg kg−1, i.p.) and decapitated. Using a ventral approach, the lumbosacral enlargement of the spinal cord was rapidly removed and placed in ice-cold sucrose-substituted artificial cerebrospinal fluid (ACSF) containing (in mm): 250 sucrose, 25 NaHCO2, 10 glucose, 2.5 KCl, 1 NaH2PO4, 1 MgCl2 and 2.5 CaCl2. Transverse slices (from L3–L5 segments; 300 μm thick) were cut using a vibrating-blade microtome (Leica VT-1000S, Heidelberg, Germany) and then transferred to an incubation chamber containing oxygenated ACSF (118 mm NaCl substituted for sucrose). Slices were allowed to equilibrate for 1 h at room temperature (22–24°C) prior to recording.
Electrophysiology
Slices were transferred to a recording chamber and continually superfused (bath volume 0.4 ml; exchange rate 4–6 bath volumes per minute) with ACSF bubbled with 95% O2–5% CO2 to achieve a final pH of 7.3–7.4. All recordings were made at room temperature (22–24°C) from visualized SDH neurones, using near-infrared differential interference contrast optics. Recordings were limited to the SDH (laminae I and II) by targeting neurones located within or dorsal to the substantia gelatinosa. This region is easily identified by its translucent appearance in transverse spinal cord slices. Patch pipettes (2–4 MΩ) were filled with a CsCl-based internal solution containing (in mm): 130 CsCl, 10 Hepes, 10 EGTA, 1 MgCl2, 2 ATP and 0.3 GTP (pH adjusted to 7.35 with 1 m CsOH). In some experiments A-type potassium currents were recorded using a KCH3SO4-based internal solution containing (in mm): 135 KCH3SO4, 6 NaCl, 2 MgCl2, 10 Hepes, 0.1 EGTA, 2 MgATP, 0.3 NaGTP, pH 7.3 (with KOH). The whole-cell recording configuration was established in voltage-clamp (holding potential −70 mV). Data were acquired using an Axopatch 200B amplifier (Molecular Devices, Sunnyvale, CA, USA) and digitized online (sampled at 10–20 kHz, filtered at 5–10 kHz, respectively) via an ITC-16 computer interface (Instrutech, Long Island, NY, USA) and stored on a Macintosh G4 computer using Axograph v4.6 software (Molecular Devices).
After obtaining the whole-cell recording configuration, series resistance, neurone input resistance and membrane capacitance were calculated based on the response to a 5–10 mV hyperpolarising voltage step from a holding potential of −70 mV. These values were monitored at the beginning and end of each recording session and data were rejected if values changed by more than 20%. Miniature glycinergic IPSCs (mIPSCs), which represent the postsynaptic response to spontaneous release of single vesicles of neurotransmitter (Katz, 1969; Bekkers & Stevens, 1989), were pharmacologically isolated by including the sodium channel blocker, tetrodotoxin (TTX; 1 μm), the AMPA-kainate receptor antagonist, 6-cyano-7-nitroquinoxaline-2,3-dione (CNQX; 10 μm) and the GABAA receptor antagonist bicuculline (10 μm) in the bath perfusate. GABAAergic mIPCSs were recorded in an identical fashion except that bicuculline (10 μm) was replaced with strychnine (1 μm). At least 3 min of data were acquired under these conditions for analysis.
In some experiments outside-out membrane patches (Hamill et al. 1981) were excised from SDH neurones at the completion of mIPSC recordings, to compare glycine sensitivity of wild-type and spasmodic GlyRs to exogenously applied glycine. For these experiments glycine (3–1000 μm) was dissolved in ACSF and applied to membrane patches via a U-tube device: 2 s applications with a 30 s interval between successive applications to avoid GlyR desensitisation. In addition, some membrane patches were exposed to bath application of 1–3 μm and 10–30 μm glycine concentrations. These experiments assessed the relative sensitivity of individual receptors in patches as determined by the presence or absence of single channel events.
The presence and properties of A-type potassium currents were examined using a ‘partial activation’ protocol (holding potential −60 mV) that delivered a hyperpolarizing step to −90 mV (1 s duration) followed by a depolarizing step to −40 mV (200 ms duration). This protocol could be run in the absence of TTX as long as the maximum amplitude of the depolarising steps remained below AP discharge threshold (Safronov, 1999; Graham et al. 2007). Bath addition of 4-aminopyridine (5 mm) abolished transient outward currents in these recordings confirming their identity as A-type potassium currents (n = 3 and 4 for wild-type and spasmodic, respectively). When A-type currents were detected, TTX (1 μm) was applied to the bath to block AP discharge. We then ran a series of ‘full activation’ protocols to assess voltage-dependent activation, steady-state inactivation, and recovery from inactivation. Maximal activation was achieved by delivering a hyperpolarizing step (−90 mV, 1 s duration) followed by a depolarizing step (+40 mV, 200 ms duration). An inactivation protocol was used to isolate A-type currents using a subtraction method. This protocol delivered an inactivation step (−20 mV, 1 s duration) followed by a second depolarizing step (+40 mV, 200 ms duration). Voltage-dependent activation was assessed by applying a hyperpolarizing pre-pulse to −90 mV (1 s duration) followed by depolarizing voltage steps of increasing amplitude (−85 mV to +40 mV, 5 mV increments, 200 ms duration). Steady-state inactivation was assessed by applying hyperpolarizing pre-pulses, of decreasing amplitude (−90 mV to +40 mV, 5 mV increments, 1 s duration), and then a depolarizing voltage step to +40 mV (200 ms duration). Recovery from inactivation was assessed by delivering a hyperpolarizing step (−90 mV, 1 s duration), then fully activating the A-current with a depolarizing step (+40 mV, 200 ms duration), and delivering hyperpolarizing prepulses of varying duration (−90 mV, 5–100 ms in 5 ms increments) before stepping back to +40 mV. All protocols used automated P/N leak subtraction, contained within the Axograph software, to remove both capacitive and leakage currents.
Analysis
mIPSCs were detected and captured using a sliding template method (a semi-automated procedure within Axograph software package) (Clements & Bekkers, 1997). Captured mIPSCs were inspected individually and excluded from the analysis if they included overlapping mIPSCs or had an unstable baseline before the rise or after the decay phase of the mIPSC. Data were rejected if a significant trend was evident in either mIPSC amplitude or instantaneous frequency over the course of the experiment. Analyses were performed on averaged mIPSCs, generated by aligning the rising phase of all accepted mIPSCs. Peak amplitude, rise-time (calculated over 10–90% of peak amplitude) and decay time constant (calculated over 20–80% of the decay phase) were obtained using automated procedures within the Axograph analysis programs. Average mIPSC frequency was obtained by dividing the number of captured events by the analysis duration in seconds.
Peak current responses recorded from membrane patches, evoked by U-tube or bath application of glycine, were measured for each glycine concentration. Data were normalised to the peak response for the final glycine concentration (1000 μm) and concentration–response curves were plotted to determine the IC50 for GlyRs in each patch. Responses recorded from membrane patches during bath application of 1–3 μm and 10–30 μm glycine concentrations were inspected and classed as responsive if single channel events (>20) were observed during the agonist application period.
The amplitude of A-type potassium currents during the partial activation protocol was calculated by subtracting the amplitude of any steady-state potassium current component (in the last 50 ms of the step to −40 mV) from the initial (transient) current peak (Ruscheweyh & Sandkuhler, 2002). The inactivation phase of the transient response was fit with a single exponential (over 20–80% of the falling phase). A-type potassium currents activated during the maximal protocol were first isolated using a subtraction method. This involved subtracting the current response recorded during the inactivation protocol from the current response recorded during the maximal activation protocol. Peak current and decay were then determined as for the partial activation analysis. A-type potassium current activation and steady-state inactivation were analysed by normalizing all peak amplitudes to the response during the −90 mV to +40 mV step (maximal activation in our protocol). Data were fit with the Boltzmann equation: g/gmax= 1/[1 + exp(V−VH)/κ], where g/gmax= normalized conductance, V = membrane potential, VH= voltage at half-maximal activation (or inactivation), and κ is the slope factor. Finally, recovery from inactivation was determined by normalizing all peak currents, evoked by the recovery step, to the final peak (i.e. the last recovery step).
Chemicals
Most drugs were purchased from Sigma-Aldrich (St Louis, MO, USA). TTX was obtained from Alomone Laboratories (Jerusalem, Israel).
Statistics
All statistical analysis was completed using SPSS v19 (SPSS Inc., Chicago, IL, USA). Student's t test was used to determine if the properties of GlyRs, GlyR-mediated mIPSCs, GABAAR-medicated mIPSCs, and A-type potassium current properties differed between wild-type and spasmodic mice. The Student–Neuman–Keuls post hoc test was used to determine where differences existed among mouse genotypes. Data that failed Levene's test for homogeneity of variance were compared using the non-parametric Kruskal–Wallace test. Statistical significance was set at P < 0.05. All data are presented as means ± SEM.
Results
Whole cell patch clamp recordings were obtained from 172 SDH neurones (90 and 82 from wild-type (n = 22) and spasmodic (n = 24) mice, respectively). These recordings characterised the properties of fast synaptic inhibition from glycinergic and GABAergic sources as well as the properties of the rapidly activating and inactivating A-type potassium currents. The recording access (9.8 ± 0.3 MΩvs. 9.7 ± 0.3 MΩ, P = 0.86), input resistance (656 ± 37 MΩvs. 617 ± 38 MΩ,P = 0.46) and membrane capacitance (16.5 ± 0.7 pF vs. 15.1 ± 0.6 pF, P = 0.14) were similar for neurones in both genotypes. These measurements suggest any differences we observed were not due to recording conditions. Recordings were also obtained from 49 membrane patches (24 and 25 from wild-type and spasmodic mice, respectively). These recordings assessed glycine sensitivity and incidence of single channel events in wild-type and spasmodic GlyRs.
Glycine receptor activation in membrane patches
Glycine was directly applied to membrane patches, via a U-tube, to compare the sensitivity of wild-type and spasmodic GlyRs to their endogenous agonist (Fig. 1). Wild-type patches responded to all glycine concentrations tested (3–1000 μm) with single channel openings first evident during 3 μm applications. Robust inward currents, constituting simultaneous activation of multiple channels (up to ∼20) were observed as glycine concentration was increased to 1000 μm (Fig. 1A, upper). In contrast, glycine responses in spasmodic patches were first noted at higher glycine concentrations. Single channel events were typically absent at 3 μm, becoming apparent at 10–30 μm, and increased to multiple channel openings during 100–1000 μm glycine applications (Fig. 1A, lower). Concentration–response curves constructed from these experiments (Fig. 1B) indicate a significant reduction in glycine sensitivity in spasmodic versus wild-type receptors (EC50= 130 ± 20 μmvs. 64 ± 11 μm, respectively). This reduction in agonist sensitivity in spasmodic patches is consistent with values obtained previously for these mutant GlyRs in cell expression systems (Rajendra & Schofield, 1995; Plested et al. 2007).
Figure 1. Agonist sensitivity is diminished in spasmodic GlyRs.
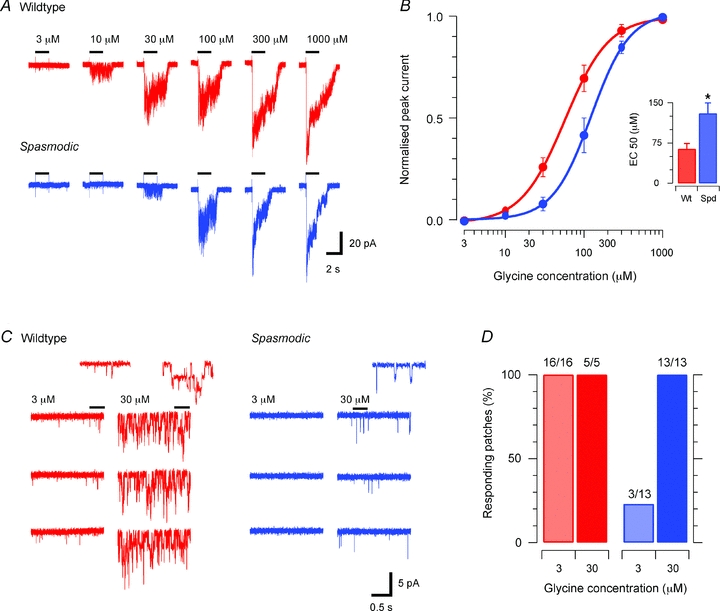
A, example glycine evoked currents recorded in excised membrane patches from a wild-type (upper) and spasmodic (lower) SDH neurone. Bars above each trace denote the duration (2 s) of glycine applications. B, concentration–response plots for wild-type and spasmodic patches (n = 8 and 15, respectively). The concentration–response curve is shifted to the right for spasmodic patches, indicating reduced agonist sensitivity. Inset summarises EC50 values for spasmodic and wild-type receptors. C, example responses for wild-type (left) and spasmodic (right) patches to bath application of ‘low’ (3 μm) and ‘high’ (30 μm) glycine concentrations. In wild-type patches brief single channel openings are evoked by low glycine concentrations and high concentrations evoke multiple channel openings (inset shows channel openings on expanded time scale). In spasmodic patches single channel events are not observed in low glycine concentrations and only a few openings are observed in high glycine concentration. D, plots summarising results from experiments in C. All wild-type patches responded to low glycine concentration, whereas only 3/13 spasmodic patches responded.
We next undertook a series of experiments to determine whether all receptors in a spasmodic patch contained mutant α1 subunits, i.e. such receptors should be less sensitive to glycine. In these experiments we selected two glycine concentrations (1–3 μm and 10–30 μm), where the difference in agonist sensitivity between wild-type and spasmodic patches was maximal (see Fig. 1A and C). Each concentration was then applied to membrane patches to examine responses (usually single channel events). Application of 1–3 μm glycine evoked brief intermittent single channel activity, whereas 10–30 μm glycine evoked sustained single channel activity in all patches from wild-type neurones (Fig. 1C, right). In contrast, patches from spasmodic mice rarely responded to 1–3 μm glycine and exhibited only brief intermittent single channel activity during application of 10–30 μm glycine (Fig. 1C, right). Group data from these experiments indicate that all wild-type patches were responsive to both 1–3 μm (16/16) and 10–30 μm (5/5) glycine concentrations. In contrast, less than 25% of spasmodic patches (3/13) responded to 1–3 μm glycine; however, all patches (13/13) responded to 10–30 μm glycine (Fig. 1D). This suggests less than 25% of GlyRs in SDH neurones from spasmodic mice lack mutant α1 subunits.
Glycinergic synaptic transmission
Glycinergic mIPSCs were recorded from SDH neurones with a symmetrical chloride concentration across the neurone membrane (holding potential −70 mV). Under these conditions, and in the presence of TTX (1 μm), CNQX (10 μm) and bicuculline (10 μm), transient inward current deflections were observed. Figure 2 compares the properties of mIPSCs from wild-type and spasmodic mice recorded under identical conditions. mIPSC frequency was similarly low in wild-type and spasmodic recordings (0.16 ± 0.02 Hz vs. 0.13 ± 0.03 Hz, respectively). In both genotypes these mIPSCs were completely abolished by the addition of 1 μm strychnine (not shown; n = 5 and 4, respectively) confirming that the recorded mIPSCs were GlyR mediated (Graham et al. 2003). Comparison of mean glycinergic mIPSC properties showed that amplitude (31.0 ± 1.8 pA vs. 42.0 ± 3.6 pA, P = 0.008) and decay time constant (5.0 ± 0.4 ms vs. 7.4 ± 0.5 ms, P = 0.0001) were decreased in spasmodic neurones, whereas rise times were similar in both genotypes (0.9 ± 0.1 ms vs. 0.8 ± 0.1 ms, P = 0.084). The combined effect of reduced amplitude and decay times decreased charge transfer per mIPSC in spasmodic versus wild-type mice (168 ± 11 pA ms vs. 354 ± 41 pA ms, P = 0.001).
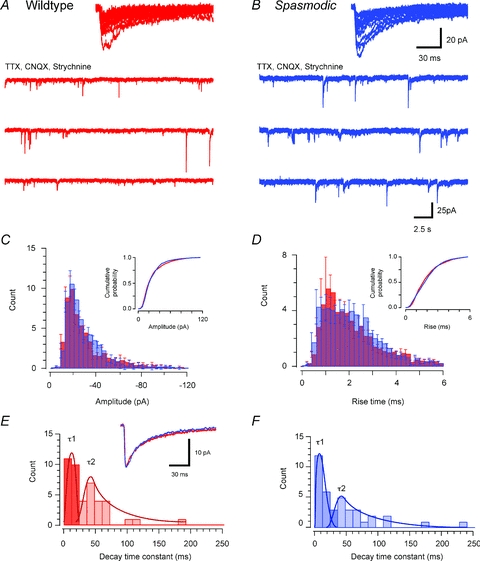
Figure 2. Comparison of glycinergic mIPSC properties in wild-type and spasmodic mice.
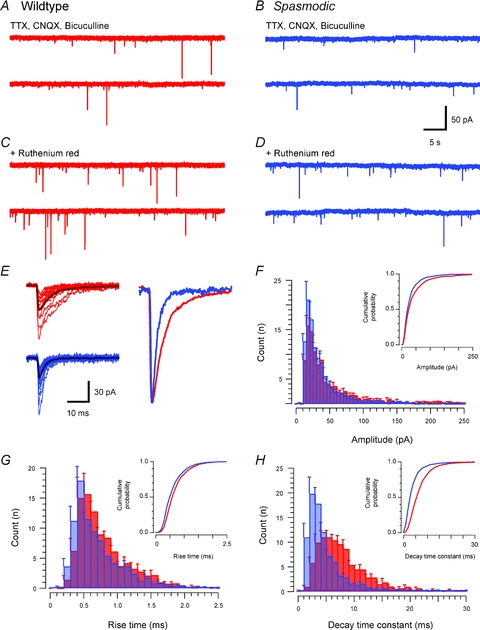
A and B, traces showing glycinergic mIPSCs recorded from wild-type and spasmodic SDH neurones in the presence of TTX (1 μm), CNQX (10 μm) and bicuculline (10 μm). Note the low mIPSC frequency in both wild-type and spasmodic recordings. C and D, bath application of ruthenium red (100 μm) increased mIPSC frequency in both wild-type and spasmodic neurones. E, overlain traces (captured from recordings in A and B) compare mIPSC properties in wild-type (upper left) and spasmodic (lower left) neurones (average appears as darker trace). A range of mIPSC amplitudes was observed in both genotypes, but mIPSC decay time was considerably faster in spasmodic mice. The overlain ‘averaged mIPSCs’, normalised to the same peak amplitude, further highlight the faster decay times in spasmodic mIPSCs. F–H, group data comparing mIPSC amplitude, rise time and decay time constant distributions. Cumulative probability plots are shown as insets. mIPSC amplitude was slightly reduced in spasmodic mice, rise times were similar for both genotypes, but decay time constants were significantly reduced in spasmodic neurones.
Because mIPSC frequency is low in SDH neurones we undertook additional experiments to increase our mIPSC sample and confirm the above observations. Ruthenium red (100 μm), which has been shown to increase mIPSC frequency in a number of CNS preparations (Trudeau et al. 1996; Lim et al. 2003), was added to the bath solution in these experiments. mIPSC frequency was increased over threefold in the presence of ruthenium red (0.11 ± 0.03 Hz to 0.37 ± 0.08 Hz, P = 0.001); however, it did not alter mIPSC amplitude (40.8 ± 6.3 pA vs. 40.1 ± 4.1 pA, P = 0.85), rise time (0.8 ± 0.1 ms vs. 0.8 ± 0.1 ms, P = 0.55), or decay time constant (6.6 ± 0.7 ms vs. 6.5 ± 0.7 ms, P = 0.96). This was true for wild-type (n = 7) and spasmodic (n = 8) mIPSCs. Comparison of mIPSC amplitude, rise time, and decay time constant of glycinergic mIPSCs recorded in ruthenium red confirmed that the decay time constant was dramatically decreased in spasmodic to approximately half wild-type values (4.8 ± 0.8 ms vs. 8.5 ± 0.7 ms P = 0.003). mIPSC amplitude was reduced in this smaller sample, but this difference did not reach statistical significance (32.75 ± 4.04 pA vs. 48.5 ± 6.6 pA, P = 0.058). Finally, rise times were similar in wild-type and spasmodic mIPSCs (0.8 ± 0.1 ms vs. 0.7 ± 0.1 ms, P = 0.323). These experiments using ruthenium red confirm that wild-type and spasmodic mIPSCs differ in their decay times.
The alterations in mIPSC time course, evident in the above data, could result from a change in receptor kinetics or a change in the somatodendritic location of inhibitory synapses (Rall, 1977). To clarify this issue we assessed the relationship between mIPSC amplitude and time course. Plots of mIPSC amplitude versus rise time and decay time constant were constructed for recordings that contained >50 mIPSCs in either control or ruthenium red recordings (n = 11 and 9 in control, n = 6 and 7 in ruthenium red, wild-type and spasmodic, respectively). These plots were then used to determine the correlation coefficient and r2 values for the amplitude and time course relationship (Fig. 3). Group comparisons for mIPSC amplitude versus rise time (0.07 ± 0.02 vs. 0.05 ± 0.01, P = 0.39) and mIPSC amplitude versus decay time constant (0.02 ± 0.01 vs. 0.01 ± 0.003, P = 0.428) were similar in wild-type and spasmodic recordings. Thus, the reduced decay time constant of spasmodic mIPSCs cannot be explained by differences in the location of GlyRs on the dendritic trees of SDH neurones.
Figure 3. Effect of electrotonic filtering on glycinergic mIPSCs in wild-type and spasmodic SDH neurones.
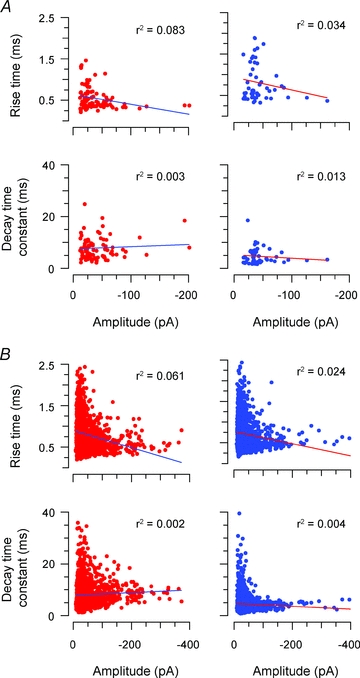
A, plots comparing the relationship between mIPSC amplitude versus rise time and decay time constant in wild-type (left) and spasmodic (right) neurones (data from neurones in Fig. 2). The similar r2 values suggest mIPSCs from wild type and spasmodic neurones are subject to similar levels of electrotonic filtering. B, comparisons from pooled mIPSC data for recordings containing >50 mIPSCs. The similar r2 values for the relationships further confirms that equivalent electrotonic filtering occurred in wild-type and spasmodic neurones
To further assess the effect of the spasmodic mutation on GlyR properties and synapses in the SDH, we compared mIPSC decay time constants in individual neurones (Fig. 4). We did this in two ways. First, we compared mIPSC decay time constant probability distributions. Only two of 16 spasmodic cumulative probability distributions fell within the 95% confidence intervals for wild-type distributions. This indicates that the decay times of most glycinergic mIPSCs were substantially altered in most spasmodic neurones (Fig. 4A). The second analysis compared mean mIPSC decay time constants for wild-type and spasmodic neurones (Fig. 4B). The distribution of wild-type decay time constants exhibited multiple peaks at approximately 4, 8 and 12 ms. The multiple peaks in the wild-type distribution suggest our sample of SDH neurons express GlyR channels with different kinetics (mean open times) or somatodendritic distributions. In contrast, the decay time constant distribution for spasmodic neurones exhibited a single major peak at approximately 4 ms. This shift to fast decay time constants in the spasmodic sample again suggests that mutant α1 subunit containing GlyRs play a substantial role in synaptic inhibition in most SDH neurones.
Figure 4. Role of the spasmodic mutation in determining mIPSC decay times.
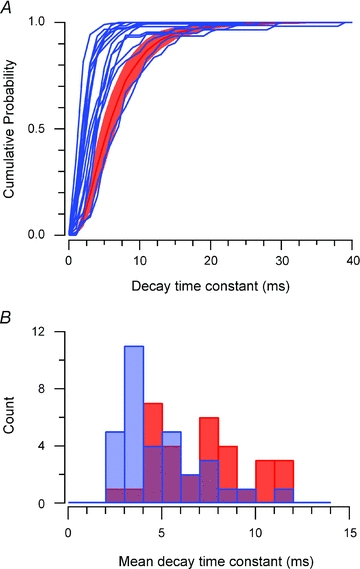
A, cumulative probability plots of glycinergic mIPSC decay time constant distributions for our sample of spasmodic neurones (blue lines; n = 16), overlain on the mean cumulative probability plot (with ±95% confidence intervals) for wild-type neurones (red; n = 17). Note, all but two spasmodic distributions fall outside the confidence intervals for wild-type mIPSCs. This indicates most glycinergic synapses are affected by the spasmodic mutation. B, histogram comparing ‘averaged’ glycinergic mIPSCs decay time constants in wild-type and spasmodic neurones. The distribution from wild-type neurones exhibits multiple peaks, whereas the spasmodic data are skewed to the left. This indicates most glycinergic mIPSCs in spasmodic neurones have fast decay times.
GABAergic synaptic transmission
We have previously shown that reduced glycinergic inhibition in the spastic mutant mouse can cause compensatory changes in GABAergic inhibition. We proposed this compensation preserves inhibitory tone in the SDH (Graham et al. 2003). To assess whether similar compensatory mechanisms occur in response to the spasmodic mutation we recorded GABAAergic mIPSCs under identical conditions to those for glycinergic mIPSCs, but with bath applied strychnine (1 μm) substituted for bicuculline. Like GlyR-mediated mIPSCs (Fig. 2) frequency was again relatively low in both wild-type and spasmodic recordings (0.13 ± 0.02 Hz vs. 0.27 ± 0.07 Hz, P = 0.107). In both genotypes mIPSCs recorded under these conditions were completely abolished by the addition of 10 μm bicuculline (not shown; n = 5 and 6, respectively). This confirms that the recorded mIPSCs were GABAAR-mediated (Graham et al. 2003). Comparison of mean GABAAergic mIPSC properties showed that amplitude (23.1 ± 1.8 pA vs. 24.4 ± 2.1 pA, P = 0.68) and rise time (2.6 ± 0.2 ms vs. 2.3 ± 0.2 ms, P = 0.60) were also similar between genotypes (Fig. 5C and D). Unlike glycinergic mIPSCs, the decay phase of GABAAergic mIPSCs were best fit with a double exponential in most recordings (26/32 in wild-type and 22/27 in spasmodic). Both decay time constants were similar in each genotype (fast 11.6 ± 1.4 ms vs. 11.8 ± 1.1 ms, P = 0.93; slow 64.4 ± 6.7 ms vs. 74.5 ± 15.2 ms, P = 0.53) and the combined effect of these properties produced a similar charge transfer per mIPSC for both genotypes (1003 ± 92 pA ms vs. 1087 ± 125 pA ms, P = 0.59). These data suggest no compensatory change in GABAergic inhibition occurs in SDH neurones of spasmodic mice.
Figure 5. Comparison of GABAAergic mIPSC properties in wild-type and spasmodic mice.
A and B, traces showing GABAAergic mIPSCs from wild-type and spasmodic SDH neurones in the presence of TTX (1 μm), CNQX (10 μm) and strychnine (1 μm). mIPSC frequency is similarly low in each genotype. Insets show overlain traces of captured mIPSCs in wild-type and spasmodic neurones. The amplitude and time course of these traces are similar for both genotypes. C and D, group data comparing mIPSC amplitude and rise time distributions (cumulative probability plots shown as insets). The amplitude and rise time of mIPSCs were similar for both genotypes. E and F, histograms comparing distributions for fast (dark bars) and slow (light bars) decay time constants fit to averaged mIPSCs from wild-type and spasmodic recordings. Inset shows averaged mIPSCs normalised to the same peak amplitude: note similar decay time courses. The fast and slow components of the decay phase were similar in both genotypes.
A-type potassium currents
In addition to synaptic inhibition from glycinergic and GABAergic origins, excitability in SDH neurones can be regulated through the expression of intrinsic membrane currents. For example the A-type potassium current, which is present in the majority of SDH neurones (Walsh et al. 2009), acts to hyperpolarize membrane potential. Our previous work in the spastic mouse has shown that diminished glycinergic inhibition leads to changes in A-current properties that favour diminished excitability. Based on these observations we have proposed the changes in A-current properties provide an additional compensatory adaptation to maintain normal signal processing, in the face of decreased inhibition, within the SDH (Graham et al. 2007). To assess whether similar mechanisms apply in the spasmodic mouse, we used a series of voltage protocols to examine the properties of the A-type potassium current in SDH neurones (Fig. 6). A-current peak amplitude was similar for both genotypes as determined using partial (264.8 ± 36.7 pA vs. 207.0 ± 32.2 pA, P = 0.25; n = 25 and 21 for wild-type and spasmodic) and full activation protocols (2512.0 ± 281.2 pA vs. 2500.3 ± 318.0 pA, P = 0.98). Similarly, the inactivation time constant for partial (36.9 ± 3.9 ms vs. 35.8 ± 2.6 ms, P = 0.81) and fully activated currents was similar (14.7 ± 2.4 ms vs. 13.3 ± 2.1 ms, P = 0.67). Group data comparing activation curves shows half-activation (–21.2 ± 3.7 mV vs.−20.5 ± 1.2 mV, P = 0.85) and activation rate (7.4 ± 0.3 mV s−1vs. 7.5 ± 0.5 mV s−1, P = 0.92) were also unchanged in spasmodic mice. Comparisons for steady state inactivation also show that half-inactivation (–54.1 ± 2.1 mV vs.−51.4 ± 1.6 mV, P = 0.30) and inactivation rates (5.4 ± 0.4 mV s−1vs.−5.5 ± 0.5 mV s−1, P = 0.92) were similar in both genotypes. Finally, the time constant for recovery from inactivation was similar in wild-type and spasmodic mice (19.2 ± 2.4 ms vs. 16.8 ± 1.3 ms, P = 0.38). Together these data suggest that, although glycinergic inhibition is dramatically reduced in the SDH of spasmodic mice, A-type potassium current properties remain unaltered.
Figure 6. Comparison of A-type potassium current properties in wild-type and spasmodic mice.
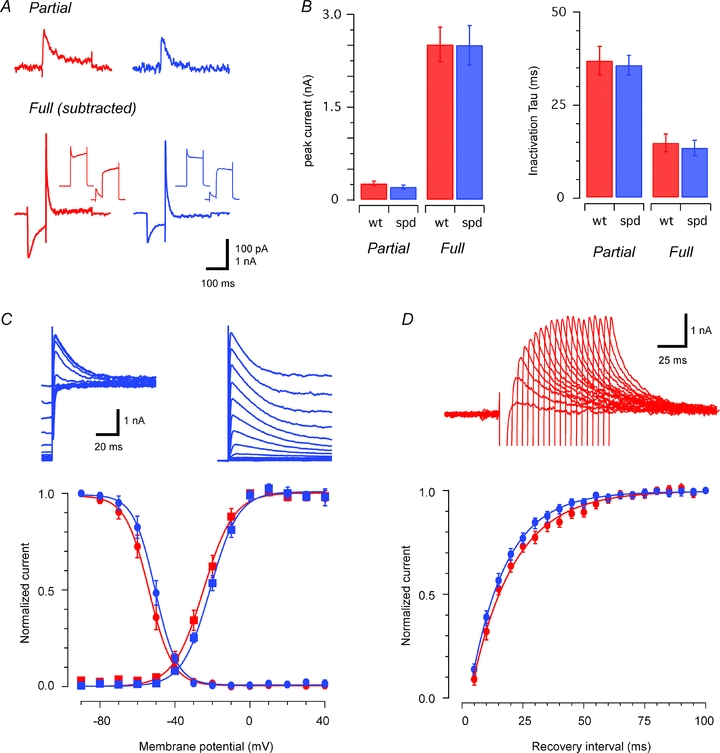
A, traces showing A-type potassium currents evoked by partial (upper) and full (lower) activation protocols. The partial activation protocol delivered a hyperpolarizing step from a holding potential of −60 mV to −90 mV (1 s duration) followed by a depolarizing step to −40 mV (200 ms duration). Limiting depolarization to −40 mV avoided the need to block voltage activated Na+ channels with TTX. The full activation protocol used a current subtraction approach and was run in the presence of TTX (1 μm). Voltage responses were recorded during an activation protocol (−90 mV, 1 s duration to +40 mV, 200 ms duration, left insets) and an inactivation protocol (−20 mV, 1 s duration to +40 mV, 200 ms duration, right insets). The voltage response during the inactivation protocol was subtracted from the activation protocol response to isolate the A-type current at full activation. B, plots comparing peak amplitude and inactivation time constant for A-type potassium currents at both partial and full activation in wild-type and spasmodic neurones. These data indicate that the magnitude and time course of A-type potassium currents are not altered in spasmodic neurones. C, traces show steady-state inactivation (upper left) and activation (upper right) for the A-type potassium current in a spasmodic neurone. Hyperpolarizing pre-pulses, of decreasing amplitude (−90 mV to +40 mV, 5 mV increments, 1 s duration), followed by a depolarizing voltage step to +40 mV (200 ms duration) were used to assess inactivation. Voltage-dependent activation was assessed by applying a hyperpolarizing pre-pulse to −90 mV (1 s duration) followed by depolarizing voltage steps of increasing amplitude (−85 mV to +40 mV, 5 mV increments, 200 ms duration). Membrane current– voltage relationship plot compares steady-state inactivation (circles) and activation curves (squares) for wild-type and spasmodic neurones (n = 25 and 21, respectively). These properties were similar in both genotypes. D, traces show the recovery from inactivation of the A-type potassium current in a representative neurone. See Methods for protocol. Plot indicates recovery from inactivation followed a mono-exponential time course and was similar for both genotypes.
Discussion
This study has shown that glycine-mediated inhibition and GlyR properties are substantially altered in SDH neurones in the spasmodic mouse. Specifically, glycinergic mIPSC amplitude and decay time in spasmodic neurones are reduced by approximately 25% and 50%, respectively. We also have shown, by applying glycine to excised patches from SDH neurones, that glycine sensitivity is reduced more than twofold in spasmodic GlyRs.
The reduced amplitudes and decay times observed in glycinergic mIPSCs from spasmodic SDH neurones qualitatively match data we have obtained previously in brainstem (hypoglossal) motoneurones in the same murine mutant (Graham et al. 2006). Our new data from SDH neurones, however, differ in the degree to which mIPSC amplitude is reduced. In spasmodic brainstem motoneurones, glycinergic mIPSC amplitude is reduced by 50%, versus 25% in SDH neurones. The effect of the spasmodic mutation on mIPSC frequency also differs in the two neurone populations. mIPSC frequency is reduced to 20% of control values in motoneurones, whereas it is unchanged in SDH neurones. These comparisons suggest the impact of the spasmodic mutation is less pronounced in the ‘sensory’ SDH versus‘motor’ regions of the CNS. Indeed, there are some data to support differences in the importance of glycinergic inhibition in the ‘sensory’ SDH versus the ‘motor’ hypoglossal nucleus. For example, it is widely accepted that glycine is a critical inhibitory transmitter in shaping motor behaviour in the ventral horn (Donato & Nistri, 2000; Gonzalez-Forero & Alvarez, 2005; Callister & Graham, 2010), whereas its inhibitory role within the ‘sensory’ SDH appears to be less important than that of GABA (Graham et al. 2003; Cronin et al. 2004; Inquimbert et al. 2007; Todd, 2010).
An additional explanation for the reduced impact of the spasmodic mutation on inhibition in the SDH versus motor nuclei is that additional GlyR isoforms, other than those containing α1 subunits, exist in the spinal cord dorsal horn. Recent work has highlighted the concentrated expression of GlyRs containing α3 subunits in the SDH and their importance in inflammatory pain (Harvey et al. 2004). In the context of our experiments it is important to note that evoked glycinergic currents in α3 subunit knockout mice are identical in amplitude and time course to those recorded in normal mice (Harvey et al. 2004). This suggests the kinetics of α1- and α3-GlyR isoforms is identical. α2 GlyR subunits are also expressed in the SDH, although their expression declines from the second postnatal week, whereafter α1 subunit expression predominates (Takahashi et al. 1992). Interestingly, α2 subunit knockout mice show no overt phenotype and their spinal cords develop normally (Young-Pearse et al. 2006). This suggests α2-containing GlyRs are not required for normal CNS function in adult mice, or could be involved in any ‘compensation’ for reduced function of other GlyR isoforms in mutations such as spasmodic. Irrespective of the specific function or expression pattern of GlyR subunits, the properties of α3 and/or α2 GlyR isoforms in the SDH will be unaffected in spasmodic mice, as the mutation resides in the α1 subunit. Thus, the presence of the α3 isoform of the GlyR means a higher level of inhibition remains in the SDH in the face of the spasmodic mutation, which is confined to the α1 isoform.
The existence of GlyR subunit heterogeneity in the SDH also raises questions regarding the composition of GlyR isoforms and their stochiometery at SDH synapses. Three possible isoforms, or combinations thereof, could exist within a single GlyR or GlyR cluster, i.e. α1–β, α3–β or mixed α1/α3–β based on a GlyR stoichiometry of 2α:3β (Grudzinska et al. 2005). To date, it has been difficult to distinguish between these possibilities in SDH neurones, as current pharmacological methods do not allow us to determine the relative contribution of α1 versusα3 subunits to GlyR properties in normal animals. The spasmodic mutation provides an opportunity to probe receptor composition because of the known effect of the mutation at the level of single GlyRs and glycinergic synapses. Our experiments on excised patches (Fig. 1C and D) took advantage of the decreased sensitivity of GlyRs containing mutant α1 subunits, to probe for the presence of α1 GlyR isoforms. Our data showed only ∼25% of patches exhibited normal glycine sensitivity and thus could be considered as free of mutant α1-containing GlyRs. This implies the GlyRs in these patches were the α3–β isoform. The remaining patches (∼75%) were insensitive to low (1–3 μm) glycine concentrations, suggesting they contained either α1–β or even α1/α3–β GlyR isoforms.
Our interpretation of the results of these agonist-sensitivity experiments rests on several assumptions. First, we assume channel open probability is similar in wild-type and mutant receptors. If this were not the case then the few currents/channel openings we observed in response to 3 μm glycine in spasmodic might simply reflect low channel open probability in the mutant receptors and not their absence. Second, it is at present unclear how many mutant α1 subunits are needed to alter agonist sensitivity in a GlyR, or if agonist sensitivity is graded according to the number of mutant subunits in the receptor. Future studies using recombinant GlyR expression systems and manipulation of GlyR subunit ratios, including the α1A52S (spasmodic) mutant, may resolve this issue.
We could also utilise the known effect of the spasmodic mutation on the decay of quantal glycinergic currents to gain insight into the manner by which various GlyR isoforms are clustered at postsynaptic densities on SDH neurones. In these experiments we relied on the notion that any postsynaptic cluster, which contains mutant α1 versusα3 subunits, should exhibit mIPSCs with substantially reduced decay time constants. We then asked, does any one SDH neurone receive glycinergic synapses with predominantly α1–β, α3–β or a mixture of α1/α3–β subunit-containing receptors? As only 13% (2/16) of spasmodic SDH neurones exhibited mIPSCs with normal decay time constant distributions (Fig. 4) we propose that glycinergic synapses on most SDH neurones contain clusters composed predominantly of α1 GlyR isoforms.
The notion that α1 containing GlyRs play a major role in glycinergic inhibition in the SDH is consistent with immunohistochemistry in the rat because gephyrin expression, a marker of glycinergic synapses, almost completely overlaps α1 subunit expression (Todd et al. 1996). In contrast, immunohistochemistry on mouse SDH neurones suggests approximately 50% of α3 subunit-containing synapses (i.e. postsynaptic clusters) lack α1 subunits (Harvey et al. 2004). These conflicting data could reflect species differences or technical issues associated with antibody specificity and false negatives. Our proposal that relatively few neurones (13%) have α3 subunit-only containing synapses in mouse is thus at odds with the high proportion of α3 subunit-only containing synapses described in the Harvey study. One explanation for these conflicting data is that glycinergic synapses are not evenly spread on SDH neurones, a proposal supported by the wide range of mIPSC frequencies observed in our experiments and those of others (Chery & de Koninck, 1999; Graham et al. 2003; Baccei & Fitzgerald, 2004). Thus we propose that α3-only containing synapses are confined to a small percentage of the SDH neurone population. In contrast, the remaining SDH neurones have synapses containing a mixture of α1 and α3 subunit-containing receptors or inputs where α1 subunit-containing receptors dominate. Future experiments that quantify the distribution and overlap of α1 and α3 subunits in a population of individually filled and reconstructed SDH neurones will be required to directly test this proposal.
Because the spasmodic mutation results in ∼50% reduction (based on charge transfer) in glycinergic inhibitory drive in SDH neurones, we tested whether compensatory mechanisms existed to maintain normal spinal sensory processing. Such compensation or homeostatic plasticity, a phenomenon that stabilises neuronal circuits in the face of altered synaptic inputs, is well established in other CNS regions (Turrigiano, 1999; Marder & Goaillard, 2006; Pozo & Goda, 2010). Indeed, our previous analyses on the spastic mouse has identified at least two forms of compensation that would help maintain normal spinal sensory processing mechanisms in the face of altered inhibition (Graham et al. 2007). Specifically, we showed that reduced glycinergic inhibition in the SDH of the spastic mouse is accompanied by increased inhibition from GABAAergic sources (Graham et al. 2003). Furthermore, this synaptic compensation is also accompanied by changes in intrinsic membrane properties in the spastic mouse in the form of enhanced A-type potassium current function (Graham et al. 2007). Thus, several precedents argue that compensatory mechanisms, or homeostatic plasticity, might be engaged in the spasmodic mouse.
In spite of the above observations, our experiments failed to show any compensatory changes in either GABAAergic inhibition or A-type potassium currents in the spasmodic mouse. Although this finding does not exclude the possibility that other, yet to be determined, compensatory changes occur in the spasmodic SDH, the properties investigated were considered good candidates for compensation given our previous findings in spastic mice. One explanation for this somewhat surprising result lies in the mechanisms by which the spastic and spasmodic mutation causes a comparable reduction in glycinergic drive. The spastic mutation, which affects the β subunit of the GlyR, reduces mIPSC amplitude and frequency without significantly altering channel kinetics (Graham et al. 2003). When combined with binding data (Becker et al. 1986), these findings have been interpreted as evidence for a substantial reduction in the number of functionally normal receptors at glycinergic synapses (Graham et al. 2003). In contrast, the spasmodic mutation affects the α1 subunit of the GlyR and dramatically reduces mIPSC decay time without substantially altering the amplitude or frequency of these currents. Our findings on the altered time course of mIPSCs are consistent with the reduced agonist sensitivity and altered receptor activation mechanisms observed in studies on recombinant receptors (Ryan et al. 1994; Saul et al. 1994; Plested et al. 2007). Likewise, our data on mIPSC amplitude and frequency match the results of binding and recombinant receptor studies that show relatively normal strychnine displacement by glycine (Lane et al. 1987; Ryan et al. 1994). Together these data provide evidence for relatively normal GlyR numbers but with altered functional properties at glycinergic synapses in the spasmodic mouse.
Thus, although spasmodic and spastic mutations result in a similar overall reduction in glycinergic inhibition, the underlying causes differ. These differences along with the evidence of compensation, in the spastic but not spasmodic mouse, may provide some insight into the functional role of glycinergic inhibition in spinal sensory processing. For example, if the duration (i.e. mIPSC time course) of glycinergic inhibition were crucial, the spastic mutation, which compromises mIPSC magnitude but not time course, would have limited effects in the SDH. Alternatively, if the magnitude (i.e. mIPSC amplitude) of glycinergic inhibition were the important factor, then the spasmodic mutation, which compromises time course, would have limited effects in the SDH. As the current experiments have failed to detect compensatory mechanisms in spasmodic mice, whereas both synaptic and intrinsic compensation have been demonstrated in the spastic mouse, we suggest that a major role of glycine in the SDH is to is to provide large, but brief, shifts in membrane potential during sensory processing. These issues could be further clarified using an in vivo patch clamping approach to directly study spinal sensory processing mechanisms in the spasmodic mouse (Graham et al. 2004).
Conclusion
This study has shown that glycinergic inhibition is diminished in the SDH of the spasmodic mouse by mechanisms that involve changes in receptor kinetics and agonist sensitivity, though not to the same degree as reported previously for motor nuclei. We suggest a major reason for this difference is the specific expression of the α3 subunit of the GlyR in the SDH. Because we did not observe compensatory changes in either GABAAergic inhibition or A-type potassium currents in spasmodic SDH neurones we suggest the remaining glycinergic inhibition, some of which is provided by α3 subunits, is adequate to maintain normal sensory processing in the SDH of spasmodic mice. Finally, our data imply that most GlyRs and glycinergic synapses in the SDH contain α1 isoforms of the receptor.
The discovery of α3 containing GlyRs in the SDH and their role in inflammatory pain has renewed interest in GlyRs as an analgesic (Harvey et al. 2004; Lynch & Callister, 2006). Unlike the GABA receptor, GlyRs have not previously been considered as a therapeutic target because they were only thought to come in one form (i.e. the α1/β isoform) and they are ubiquitous (Zeilhofer, 2005). The existence of a new form of the GlyR with a clearly defined function, and importantly, whose expression is confined to spinal cord circuits involved in pain signalling would appear to represent the ideal drug target. Of course this approach relies on drugs that can selectively target α3 isoforms and avoid the complications associated with antagonising α1 containing isoforms. Our data suggest few α3-only GlyRs exist in the SDH; rather, most receptors contain α1 subunits. It will therefore be important in future studies to ensure that the action of drugs that target the α3-only form of the receptor still act on the α1/α3 isoform and not overly effect the ubiquitously expressed form of the GlyR.
Acknowledgments
This work was supported by NH&MRC project grants (nos 276403, 401244, 569206, 628765, 631000) and the Hunter Medical Research Institute.
Glossary
Abbreviations
- CNQX
6-cyano-7-nitroquinoxaline-2,3-dione
- GlyR
glycine receptor
- mIPSC
miniature inhibitory postsynaptic current
- SDH
superficial dorsal horn
- TTX
tetrodotoxin
Author contributions
All experiments were conducted in the School of Biomedical Sciences and Pharmacy at the University of Newcastle and all authors approved the final version of the manuscript. B.A.G., P.R.S. and R.J.C. conceived and designed the experiments. B.A.G. and M.A.T. collected, analysed and interpreted the data. B.A.G., P.R.S. and R.J.C. drafted the article.
References
- Baccei ML, Fitzgerald M. Development of GABAergic and glycinergic transmission in the neonatal rat dorsal horn. J Neurosci. 2004;24:4749–4757. doi: 10.1523/JNEUROSCI.5211-03.2004. [DOI] [PMC free article] [PubMed] [Google Scholar]
- Becker C-M, Hermans-Borgmeyer I, Schmitt B, Betz H. The glycine receptor deficiency of the mutant mouse spastic: evidence for normal glycine receptor structure and localization. J Neurosci. 1986;6:1358–1364. doi: 10.1523/JNEUROSCI.06-05-01358.1986. [DOI] [PMC free article] [PubMed] [Google Scholar]
- Becker L, Hartenstein B, Schenkel J, Kuhse J, Betz H, Weiher H. Transient neuromotor phenotype in transgenic spastic mice expressing low levels of glycine receptor β-subunit: an animal model of startle disease. Eur J Neurosci. 2000;12:27–32. doi: 10.1046/j.1460-9568.2000.00877.x. [DOI] [PMC free article] [PubMed] [Google Scholar]
- Bekkers JM, Stevens CF. NMDA and non-NMDA receptors are co-localized at individual excitatory synapses in cultured rat hippocampus. Nature. 1989;341:230–233. doi: 10.1038/341230a0. [DOI] [PubMed] [Google Scholar]
- Biscoe TJ, Duchen MR. Synaptic physiology of spinal motoneurones of normal and spastic mice: an in vitro study. J Physiol. 1986;379:275–292. doi: 10.1113/jphysiol.1986.sp016253. [DOI] [PMC free article] [PubMed] [Google Scholar]
- Callister RJ, Graham BA. Early history of glycine receptor biology in mammalian spinal cord circuits. Front Mol Neurosci. 2010;3:13. doi: 10.3389/fnmol.2010.00013. [DOI] [PMC free article] [PubMed] [Google Scholar]
- Chery N, de Koninck Y. Junctional versus extrajunctional glycine and GABAA receptor-mediated IPSCs in identified lamina I neurons of the adult rat spinal cord. J Neurosci. 1999;19:7342–7355. doi: 10.1523/JNEUROSCI.19-17-07342.1999. [DOI] [PMC free article] [PubMed] [Google Scholar]
- Clements JD, Bekkers JM. Detection of spontaneous synaptic events with an optimally scaled template. Biophys J. 1997;73:220–229. doi: 10.1016/S0006-3495(97)78062-7. [DOI] [PMC free article] [PubMed] [Google Scholar]
- Cronin JN, Bradbury EJ, Lidierth M. Laminar distribution of GABAA- and glycine-receptor mediated tonic inhibition in the dorsal horn of the rat lumbar spinal cord: effects of picrotoxin and strychnine on expression of Fos-like immunoreactivity. Pain. 2004;112:156–163. doi: 10.1016/j.pain.2004.08.010. [DOI] [PubMed] [Google Scholar]
- Drummond GB. Reporting ethical matters in The Journal of Physiology: standards and advice. J Physiol. 2009;587:713–719. doi: 10.1113/jphysiol.2008.167387. [DOI] [PMC free article] [PubMed] [Google Scholar]
- Donato R, Nistri A. Relative contribution by GABA or glycine to Cl−-mediated synaptic transmission on rat hypoglossal motoneurons in vitro. J Neurophysiol. 2000;84:2715–2724. doi: 10.1152/jn.2000.84.6.2715. [DOI] [PubMed] [Google Scholar]
- Gonzalez-Forero D, Alvarez FJ. Differential postnatal maturation of GABAA, glycine receptor, and mixed synaptic currents in renshaw cells and ventral spinal interneurons. J Neurosci. 2005;25:2010–2023. doi: 10.1523/JNEUROSCI.2383-04.2005. [DOI] [PMC free article] [PubMed] [Google Scholar]
- Graham BA, Brichta AM, Callister RJ. An in vivo mouse spinal cord preparation for patch-clamp analysis of nociceptive processing. J Neurosci Methods. 2004;136:221–228. doi: 10.1016/j.jneumeth.2004.01.014. [DOI] [PubMed] [Google Scholar]
- Graham BA, Brichta AM, Schofield PR, Callister RJ. Altered potassium channel function in the superficial dorsal horn of the spastic mouse. J Physiol. 2007;584:121–136. doi: 10.1113/jphysiol.2007.138198. [DOI] [PMC free article] [PubMed] [Google Scholar]
- Graham BA, Schofield PR, Sah P, Callister RJ. Altered inhibitory synaptic transmission in superficial dorsal horn neurones in spastic and oscillator mice. J Physiol. 2003;551:905–916. doi: 10.1113/jphysiol.2003.049064. [DOI] [PMC free article] [PubMed] [Google Scholar]
- Graham BA, Schofield PR, Sah P, Margrie TW, Callister RJ. Distinct physiological mechanisms underlie altered glycinergic synaptic transmission in the murine mutants spastic, spasmodic, and oscillator. J Neurosci. 2006;26:4880–4890. doi: 10.1523/JNEUROSCI.3991-05.2006. [DOI] [PMC free article] [PubMed] [Google Scholar]
- Grudzinska J, Schemm R, Haeger S, Nicke A, Schmalzing G, Betz H, Laube B. The β subunit determines the ligand binding properties of synaptic glycine receptors. Neuron. 2005;45:727–739. doi: 10.1016/j.neuron.2005.01.028. [DOI] [PubMed] [Google Scholar]
- Hamill OP, Neher ME, Sakmann B, Sigworth FJ. Improved patch-clamp techniques for high-resolution current recording from cells and cell-free membrane patches. Eur J Physiol. 1981;391:85–100. doi: 10.1007/BF00656997. [DOI] [PubMed] [Google Scholar]
- Hartenstein B, Schenkel J, Kuhse J, Besenbeck B, Kling C, Becker CM, Betz H, Weiher H. Low level expression of glycine receptor β subunit transgene is sufficient for phenotype correction in spastic mice. EMBO J. 1996;15:1275–1282. [PMC free article] [PubMed] [Google Scholar]
- Harvey RJ, Depner UB, Wassle H, Ahmadi S, Heindl C, Reinold H, Smart TG, Harvey K, Schutz B, Abo-Salem OM, Zimmer A, Poisbeau P, Welzl H, Wolfer DP, Betz H, Zeilhofer HU, Muller U. GlyR α3: an essential target for spinal PGE2-mediated inflammatory pain sensitization. Science. 2004;304:884–887. doi: 10.1126/science.1094925. [DOI] [PubMed] [Google Scholar]
- Heller AH, Hallett M. Electrophysiological studies with the spastic mutant mouse. Brain Res. 1982;234:299–308. doi: 10.1016/0006-8993(82)90870-8. [DOI] [PubMed] [Google Scholar]
- Inquimbert P, Rodeau J-L, Schlichter R. Differential contribution of GABAergic and glycinergic components to inhibitory synaptic transmission in lamina II and laminae III-IV of the young rat spinal cord. Eur J Neurosci. 2007;26:2940–2949. doi: 10.1111/j.1460-9568.2007.05919.x. [DOI] [PubMed] [Google Scholar]
- Katz B. The Release of Neural Transmitter Substances. Liverpool: Liverpool University Press; 1969. [Google Scholar]
- Lane PW, Ganser AL, Kerner A-L, White WF. Spasmodic, a mutation on chromosome 11 in the mouse. J Hered. 1987;78:353–356. doi: 10.1093/oxfordjournals.jhered.a110414. [DOI] [PubMed] [Google Scholar]
- Langosch D, Hoch W, Betz H. The 93 kDa protein gephyrin and tubulin associated with the inhibitory glycine receptor are phosphorylated by an endogenous protein kinase. FEBS Lett. 1992;298:113–117. doi: 10.1016/0014-5793(92)80034-e. [DOI] [PubMed] [Google Scholar]
- Legendre P. The glycinergic inhibitory synapse. Cell Mol Life Sci. 2001;58:760–793. doi: 10.1007/PL00000899. [DOI] [PMC free article] [PubMed] [Google Scholar]
- Lim R, Oleskevich S, Few AP, Leao RN, Walmsley B. Glycinergic mIPSCs in mouse and rat brainstem auditory nuclei: modulation by ruthenium red and the role of calcium stores. J Physiol. 2003;546:691–699. doi: 10.1113/jphysiol.2002.035071. [DOI] [PMC free article] [PubMed] [Google Scholar]
- Lynch JW. Molecular structure and function of the glycine receptor chloride channel. Physiol Rev. 2004;84:1051–1095. doi: 10.1152/physrev.00042.2003. [DOI] [PubMed] [Google Scholar]
- Lynch JW, Callister RJ. Glycine receptors: a new therapeutic target in pain pathways. Curr Opin Investig Drugs. 2006;7:48–53. [PubMed] [Google Scholar]
- Marder E, Goaillard JM. Variability, compensation and homeostasis in neuron and network function. Nat Rev Neurosci. 2006;7:563–574. doi: 10.1038/nrn1949. [DOI] [PubMed] [Google Scholar]
- Molon A, Di Giovanni S, Hathout Y, Natale J, Hoffman EP. Functional recovery of glycine receptors in spastic murine model of startle disease. Neurobiol Dis. 2006;21:291–304. doi: 10.1016/j.nbd.2005.05.030. [DOI] [PubMed] [Google Scholar]
- Plested AJR, Groot-Kormelink PJ, Colquhoun D, Sivilotti LG. Single-channel study of the spasmodic mutation α1A52S in recombinant rat glycine receptors. J Physiol. 2007;581:51–73. doi: 10.1113/jphysiol.2006.126920. [DOI] [PMC free article] [PubMed] [Google Scholar]
- Pozo K, Goda Y. Unraveling mechanisms of homeostatic synaptic plasticity. Neuron. 2010;66:337–351. doi: 10.1016/j.neuron.2010.04.028. [DOI] [PMC free article] [PubMed] [Google Scholar]
- Rajendra S, Schofield PR. Molecular mechanisms of inherited startle syndromes. Trends Neurosci. 1995;18:80–82. [PubMed] [Google Scholar]
- Rall W. Core conductor theory and cable properties of neurons. In: Kandel ER, editor. Handbook of Physiology, section 1, The Nervous System, vol. I, Cellular Biology of Neurons. Bethesda: American Physiological Society; 1977. pp. 39–97. [Google Scholar]
- Ruscheweyh R, Sandkuhler J. Lamina-specific membrane and discharge properties of rat spinal dorsal horn neurones in vitro. J Physiol. 2002;541:231–244. doi: 10.1113/jphysiol.2002.017756. [DOI] [PMC free article] [PubMed] [Google Scholar]
- Ryan SG, Buckwalter MS, Lynch JW, Handford CA, Segura L, Shiang R, Wasmuth JJ, Camper SA, Schofield PA, O'Connell P. A missense mutation in the gene encoding the α1 subunit of the inhibitory glycine receptor in the spasmodic mouse. Nat Genet. 1994;7:131–135. doi: 10.1038/ng0694-131. [DOI] [PubMed] [Google Scholar]
- Saul B, Schmeiden V, Kling C, Mülhardt C, Gass P, Kuhse J, Becker C-M. Point mutation of glycine receptor α1 subunit in the spasmodic mouse affects agonist responses. FEBS Lett. 1994;350:71–76. doi: 10.1016/0014-5793(94)00736-5. [DOI] [PubMed] [Google Scholar]
- Simon ES. Involvement of glycine and GABAA receptors in the pathogenesis of spinal myoclonus: in vitro studies in the isolated neonatal rodent spinal cord. Neurology. 1995;45:1883–1892. doi: 10.1212/wnl.45.10.1883. [DOI] [PubMed] [Google Scholar]
- Singer JH, Talley EM, Bayliss DA, Berger AJ. Development of glycinergic synaptic transmission to rat brain stem motoneurons. J Neurophysiol. 1998;80:2608–2620. doi: 10.1152/jn.1998.80.5.2608. [DOI] [PubMed] [Google Scholar]
- Safronov BV. Spatial distribution of Na+ and K+ channels in spinal dorsal horn neurones: role of the soma, axon and dendrite in spike generation. Prog Neurobiol. 1999;59:217–241. doi: 10.1016/s0301-0082(98)00051-3. [DOI] [PubMed] [Google Scholar]
- Takahashi T, Momiyama A, Hirai K, Hishinuma F, Akagi H. Functional correlation of fetal and adult forms of glycine receptors with developmental changes in inhibitory synaptic receptor channels. Neuron. 1992;9:1155–1161. doi: 10.1016/0896-6273(92)90073-m. [DOI] [PubMed] [Google Scholar]
- Todd AJ. Neuronal circuitry for pain processing in the dorsal horn. Nat Rev Neurosci. 2010;11:823–836. doi: 10.1038/nrn2947. [DOI] [PMC free article] [PubMed] [Google Scholar]
- Todd A, Watt C, Spike R, Sieghart W. Colocalisation of GABA, glycine, and their receptors at synapses in the rat spinal cord. J Neurosci. 1996;16:974–982. doi: 10.1523/JNEUROSCI.16-03-00974.1996. [DOI] [PMC free article] [PubMed] [Google Scholar]
- Trudeau L, Doyle RT, Emery DG, Haydon PG. Calcium-independent activation of the secretory apparatus by ruthenium red in hippocampal neurons: A new tool to assess modulation of presynaptic function. J Neurosci. 1996;16:46–54. doi: 10.1523/JNEUROSCI.16-01-00046.1996. [DOI] [PMC free article] [PubMed] [Google Scholar]
- Turrigiano GG. Homeostatic plasticity in neuronal networks: the more things change, the more they stay the same. Trends Neurosci. 1999;22:221–227. doi: 10.1016/s0166-2236(98)01341-1. [DOI] [PubMed] [Google Scholar]
- von Wegerer J, Becker K, Glockenhammer D, Becker CM, Zeilhofer HU, Swandulla D. Spinal inhibitory synaptic transmission in the glycine receptor mouse mutant spastic. Neurosci Lett. 2003;345:45–48. doi: 10.1016/s0304-3940(03)00499-3. [DOI] [PubMed] [Google Scholar]
- Walsh MA, Graham BA, Brichta AM, Callister RJ. Evidence for a critical period in the development of excitability and potassium currents in mouse lumbar superficial dorsal horn neurons. J Neurophysiol. 2009;101:1800–1812. doi: 10.1152/jn.90755.2008. [DOI] [PubMed] [Google Scholar]
- Yoshimura M, Jessell TM. Membrane properties of rat substantia gelatinosa neurons in vitro. J Neurophysiol. 1989;62:109–118. doi: 10.1152/jn.1989.62.1.109. [DOI] [PubMed] [Google Scholar]
- Young-Pearse TL, Ivic L, Kriegstein AR, Cepko CL. Characterization of mice with targeted deletion of glycine receptor α2. Mol Cell Biol. 2006;26:5728–5734. doi: 10.1128/MCB.00237-06. [DOI] [PMC free article] [PubMed] [Google Scholar]
- Zeilhofer HU. The glycinergic control of spinal pain processing. Cell Mol Life Sci. 2005;62:2027–2035. doi: 10.1007/s00018-005-5107-2. [DOI] [PMC free article] [PubMed] [Google Scholar]