

Non-technical summary
It is not well understood how all of the connections among neurons required for the brain to process information are established during development. It has recently become apparent that waves of spontaneous electrical activity spread across large groups of neurons during early brain development and that these waves of activity are crucial for correct development of brain circuitry. In this paper, we show that waves of spontaneous electrical activity propagate across the mouse cerebral cortex, beginning on the day before birth and continuing through the first 12 postnatal days. These waves are initiated at specific locations in the cortex, which do not change during the period of wave generation. Identity of the neurons that initiate the waves, however, does change during this time. This work indicates that even though spontaneous electrical activity occurs during a short contiguous period of development, the mechanisms underlying that activity change.
Abstract
Abstract
Waves of spontaneous electrical activity propagate across many regions of the central nervous system during specific stages of early development. The patterns of wave propagation are critical in the activation of many activity-dependent developmental programs. It is not known how the mechanisms that initiate and propagate spontaneous waves operate during periods in which major changes in neuronal structure and function are taking place. We have recently reported that spontaneous waves of activity propagate across the neonatal mouse cerebral cortex and that these waves are initiated at pacemaker sites in the septal nucleus and ventral cortex. Here we show that spontaneous waves occur between embryonic day 18 (E18) and postnatal day 12 (P12), and that during that period they undergo major changes in transmitter dependence and propagation patterns. At early stages, spontaneous waves are largely GABA dependent and are mostly confined to the septum and ventral cortex. As development proceeds, wave initiation depends increasingly on AMPA-type glutamate receptors, and an ever increasing fraction of waves propagate into the dorsal cortex. The initiation sites and restricted propagation of waves at early stages are highly correlated with the position of GABAergic neurons in the cortex. The later switch to a glutamate-based mechanism allows propagation of waves into the dorsal cortex, and appears to be a compensatory mechanism that ensures continued wave generation even as GABA transmission becomes inhibitory.
Introduction
Spontaneous electrical activity plays widespread and important roles in the development of nervous systems, in both vertebrates and invertebrates (see Moody & Bosma, 2005 and Blankenship & Feller, 2010, for reviews). In the mammalian CNS, spontaneous activity occurs as waves that propagate across large areas. Such waves have been observed in the cortex (Garaschuk et al. 2000; Corlew et al. 2004; Lischalk et al. 2009; Conhaim et al. 2010), hippocampus (Leinekugel et al. 1998), retina (Meister et al. 1991), midbrain (Rockhill et al. 2009), hindbrain (Gust et al. 2003; Hunt et al. 2005) and spinal cord (O'Donovan et al. 1998). Waves initiated within a particular structure may spread to another structure, such as has been reported between midbrain and hindbrain (Rockhill et al. 2009) and between septal nucleus and cortex (Conhaim et al. 2010).
Spontaneous activity mediates a large variety of developmental processes. Some of these appear to be intrinsic to single neurons, independent of the patterns of wave propagation, such as neurotrophin gene expression, neuronal migration, and the maturation of ion channel and receptor properties (reviewed in Moody & Bosma, 2005). However, other functions of spontaneous activity depend critically on the spatial and temporal patterns of wave propagation, such as invoking coincidence detection mechanisms to strengthen developing synapses (Kasyanov et al. 2004; Voigt et al. 2005), conveying the relative spatial location of neuronal somata to their downstream synaptic targets (Shatz & Stryker, 1988), or mediating the change between excitatory and inhibitory GABAergic transmission (Balena & Woodin, 2008).
Spontaneous waves rely on synaptic and intrinsic properties that are specific to developing neurons. The most notable example of this is GABAA excitation, caused by the high levels of intracellular chloride in developing neurons (Rohrbough & Spitzer, 1996; Owens et al. 1996). GABAA excitation drives spontaneous activity in hippocampus and cortex at some stages of development (Garaschuk et al. 1998; Allene et al. 2008; present results). Other properties of embryonic neurons are likely to contribute as well, such as high input resistance (Bahrey & Moody, 2003; Picken-Bahrey et al. 2003) and high densities of T-type calcium channels (Barish, 1991; Gu & Spitzer, 1993; Tarasenko et al. 1998; Biljenga et al. 2000).
A central question concerning how spontaneous waves are generated is whether the waves of activity are initiated as an emergent property of the overall circuit (Butts et al. 1999) or by a specific population of pacemaker neurons. Although embryonic neural circuits often operate in the parameter space of mutual excitation combined with intrinsic spontaneous activity that can give rise to waves of activity as an emergent property (Butts et al. 1999), recent evidence indicates that spontaneous waves in many structures emanate from specific pacemaker regions and/or cell types. Such pacemakers have been identified in hindbrain (Hunt et al. 2005), cortex (Lischalk et al. 2009; Conhaim et al. 2010), retina (Zheng et al. 2006) and possibly hippocampus (Strata et al. 1997; Leinekugel et al. 1998; but see Menendez de la Prida & Sanchez-Andres, 2000).
The pacemaker neurons for each CNS structure are responsible for initiating spontaneous waves during a specific developmental period. The intrinsic and circuit properties of these structures, however, are not static during that period, and the changes in these properties that occur affect both the initiation and propagation of spontaneous waves in ways that are likely to constrain how activity-dependent developmental programs are activated. In cortex, for example, expression of the KCC2 chloride pump in late embryonic and early postnatal neurons results in the gradual conversion of GABAA action from excitatory to inhibitory throughout the known period of wave generation (Owens et al. 1996; Hubner et al. 2001). Although the emergence of GABAA inhibition eventually participates in the termination of cortical spontaneous waves (McCabe et al. 2006), it is likely to change the properties of spontaneous waves at earlier stages as well. How it does so will depend critically on the extent to which GABAergic neurons are involved in wave initiation and propagation. A GABAergic pacemaker, for example, would be expected to cease functioning with a modest loss of GABAA excitation, whereas a glutamatergic pacemaker would require the emergence of substantial GABAA inhibition at later stages to be prevented from initiating waves of activity.
There are apparently conflicting results as to the transmitter dependence of spontaneous waves in the cortex. It has been reported to be primarily glutamate-based, contrasting with hippocampal activity at the same stages (Garaschuk et al. 2000), but also to change form and transmitter dependence from glutamatergic to GABAergic (Allene et al. 2008). Other reports indicate participation of both glutamatergic and GABAergic mechanisms even at early stages (Conhaim et al. 2010). It would be somewhat surprising if GABAergic mechanisms were not involved at early stages, given evidence that GABA excites cortical neurons and elicits Ca2+ transients in both embryonic and early postnatal cortical neurons (Owens et al. 1996).
In the present experiments, we used wide-field whole-slice calcium imaging to investigate how the initiation and propagation of waves change during early development, and to determine how those changes relate to the development of GABA and glutamate function in the cortical circuitry. We find that during the period between E18 and P12, cortical waves change from a primarily GABA-based to glutamate-based pacemaker. We also find that the early, GABA-based waves are primarily restricted to the ventral pacemaker regions, possibly accounting for why GABAergic mechanisms have not always been detected in cortical activity at early stages. Later, glutamate-based waves propagate throughout the cortex. The transition between GABA- and glutamate-based wave mechanisms may be a compensatory mechanism that operates to ensure that spontaneous waves continue to be generated as GABA becomes inhibitory. These complex changes in transmitter dependence and propagation patterns are likely to increase the information content of waves and enable them to carry out more complex developmental functions.
Methods
Ethical approval
All procedures involving animals in this study were approved by the Institutional Animal Care and Use Committee (IACUC) at the University of Washington, following guidelines established by Association for Assessment and Accreditation of Laboratory Animal Care International (AALAC).
Animals
Time-mated Swiss–Webster mice were purchased from Harlan (Indianapolis, IN, USA). Pregnant females were killed on gestational day 17 (E17) by trained personnel using CO2 inhalation followed by decapitation. Fetuses were removed from the uteri, decapitated and brains placed into ice-cold artificial cerebrospinal fluid (ACSF; see below) equilibrated with carbogen gas (95% O2–5% CO2).
Slice preparation and culture
Brains were mounted in the holder of a vibratome (TPI, St Louis, MO, USA). Coronal slices (300–400 μm) were taken from the region anterior to the hippocampus, but within the extent of the lateral ventricles (corresponding approximately to gestational day 18 coronal sections 8–10 in Schambra et al. 1992). These sections include cortex, corpus callosum, septal nuclei and basal ganglia structures (caudate-putamen and globus pallidus). Slices were placed on Millicell sterilized culture plate inserts (Millipore Corp., Billerica, MA, USA) in 1 ml of culture medium (see below), and cultured in a water-jacketed incubator at 36–37°C in 5% CO2. Previous experiments have shown that cultured slices reproduce the time course of several physiological properties of cortical neurons (voltage-gated sodium and potassium currents, capacitance, resting conductance), the onset and disappearance of spontaneous waves (McCabe et al. 2006) and the dorsal migration of GABAergic interneurons (C. R. Easton & W. J. Moody, unpublished observations).
Solutions
Cell culture medium contained 75% sterile Neurobasal-A Medium (1X) (Invitrogen, Carlsbad, CA, USA), 25% horse serum (Sigma), penicillin (100 IU ml−1), streptomycin (0.1 mg ml−1) and 2 mm l-glutamine (HyClone Laboratories Inc., Logan, UT, USA). Artificial cerebrospinal fluid contained (mm): 140 NaCl, 3 KCl, 2 MgCl2, 2 CaCl2, 1.25 NaHPO4, 26.5 NaHCO3 and 20 d-glucose. Picrotoxin and CNQX (Tocris) were used at 10 μm and 25 μm, respectively, in ACSF.
Calcium imaging
Cultured tissue slices were removed from the incubator and held in oxygenated ACSF at 30°C for 1–2 h. Slices were then immersed in oxygenated ACSF containing the [Ca2+]i-indicating dye Fluo-4 (1.5 μm) and 0.07% Pluronic F-127 (Molecular Probes, Eugene, OR, USA) for 30–45 min, rinsed and placed into a glass-bottomed experimental chamber. Oxygenated ACSF (30–34°C) was superfused continuously during experiments. Images were captured at an interval of 0.75 s with CoolSnap ES or QuantEM512SC cameras (Photometrics, Tucson, AZ, USA) attached to a Nikon AZ100 microscope. Images were recorded using either MetaFluor (Universal Imaging, West Chester, PA, USA) or NIS Elements AR software (Nikon USA, Melville, NY, USA).
Immunocytochemistry
Calcium-imaged slices were fixed in 4% paraformaldehyde (PFA), rinsed with phosphate buffered saline (PBS), then treated with primary antibody (rabbit α GAD65/67, 1:500, US Biological) and 10% normal goat serum (NGS) in PBS plus 1% Triton X-100 (PBST). Slices were rinsed again in PBS, and secondary antibody (goat α rabbit 594, 1:400, Invitrogen) applied with 10% NGS in PBST. PFA, primary and secondary antibodies were all applied overnight, and PBS rinses in between these applications consisted of 5 rinses of 15–20 min duration. A Texas Red filter set was used for imaging. Three control slices were calcium imaged, and had secondary antibody applied with no primary antibody before imaging. In all cases bleed-through of remaining calcium signal into the 594 channel was minimal, and little signal was observed. Additional (n = 15) E18 and P0 cultured slices were not calcium imaged, and were immunostained following the above procedures. In all cases GAD65/67 immunofluorescence matched what was seen in calcium imaged slices, indicating that our immuno results were not influenced by bleed-through from the calcium dye in the 488 channel.
Data analysis
Stored image sequences were analysed for event frequencies in various regions by placing regions of interest (ROIs) bilaterally over the septal nuclei, and ventral, lateral and dorsal cortex (see Fig. 1). Using NIS Elements software, mean fluorescence for each ROI vs. time was recorded from the image stack and exported into SigmaPlot spreadsheet software (Systat, Chicago). Activity in each slice was displayed in SigmaPlot by stacking the fluorescence records for each ROI in a single plot (e.g. Fig. 3). Frequency and interval data from each ROI was calculated using custom-written MatLab functions. Raw F vs. time data from each ROI were imported into MatLab and converted into ΔF/F records. These records were subjected to an event detection routine based on a ΔF/F threshold of 0.7–1.0%. For each event detected, the time of its occurrence (peak) and its amplitude were stored in MatLab arrays, which were used to calculate event frequency and event interval distribution. Montages and films of events were created from image stacks using custom-written MatLab functions. Fluorescence image stacks were imported into MatLab, converted into ΔF/F images, and passed through a linear 5 × 5 pixel spatial filter to reduce noise and emphasize clusters of active pixels. The frames were then thresholded at 3 standard deviations (SD) above mean background fluorescence, and the resulting activity pseudocoloured and superimposed onto a camera image of the slice so that the pathway of wave spread could be visualized in relation to slice anatomy. This superposition was done by scaling down the pixel values of the camera image and blanking those portions of the image under the activity, so as to preserve accurate ΔF/F values for the events. The speed of wave propagation in the ventral cortex near the point of initiation is rapid compared to our frame capture rate, so that accurate points of wave initiation could not be determined for many events. To find initiation points, a MatLab function scanned image stacks for the first frame of each event that contained a contiguous cluster of pixels with densities >3 SD above mean background ΔF/F. Events with an initial frame in which these pixels comprised <1% of the slice area were analysed for the location of this initiation point by measuring the angles bounding the pixel cluster (see Conhaim et al. 2010) and the fractional depth between pial surface and slice midpoint of the centroid of the pixel cluster. Analysis of GAD immunofluorescence in different brain regions was done by using the same ROIs as for Fluo-4 signals (Fig. 1). Mean pixel intensity (background subtracted) was calculated for each ROI. To detect the location of edge points of immunofluorescence decline (e.g. Fig. 8), a MatLab function that detects local maxima of the first spatial derivative of fluorescence along the path of wave propagation was used.
Figure 1. Camera image of a typical cultured coronal slice used in these experiments.
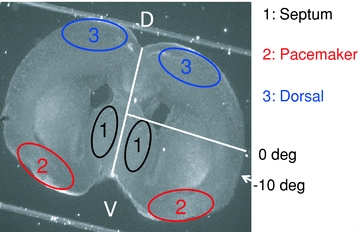
White lines indicate the midline of the slice and the 0 deg reference line extending from the midpoint of the midline to the pial surface. Numbered areas indicate the regions of interest (ROIs) used in Fluo-4 fluorescence records presented in the later figures (1: septal nuclei; 2: ventral cortical pacemaker; 3: dorsal cortex follower). The −10 deg label indicates the mean maximum extent of propagation of waves that do not enter the dorsal cortex. Waves that cross this point (fully propagating waves; FPWs) typically reach the dorsal midline, and never stop ventral to +60 deg (Conhaim et al. 2010). The same angular reference points were used on both sides of the slice.
Figure 3. Typical Fluo-4 records of activity at various stages of development.
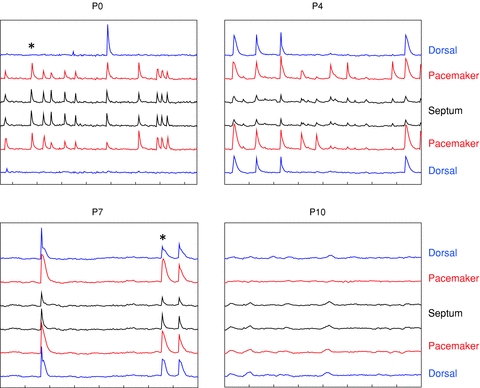
Traces are mean ΔF/F for the ROIs shown in Fig. 1. Traces are stacked so the regions on the left side of the slice are displayed in the upper half of each graph, those on the right side in the lower half. Moving upward or downward from the centre are septal nuclei (ROIs 1 in Fig. 1), the ventral pacemakers (ROIs 2), and the dorsal follower cortex (ROIs 3). Time markers on the x-axes are 20 s for all plots. Traces are stacked at intervals of 1%ΔF/F in all plots. Note the increasing fraction of waves that propagate into the dorsal cortex between P0 and P7. *Events shown in Fig. 4 films.
Figure 8. Pattern of GAD 65/67 staining in relation to wave propagation.
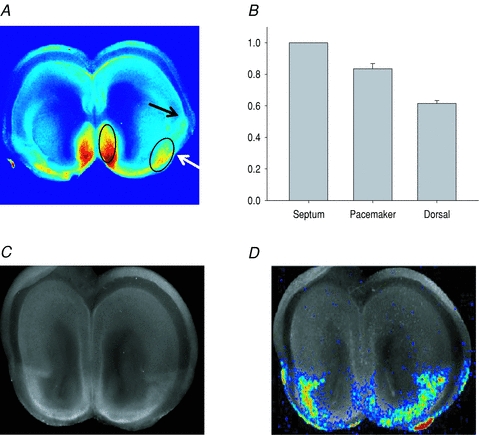
A, GAD65/67-stained coronal P0 slice. Arrows show two points of drop-off of GAD staining in the path of wave propagation. The second point (black arrow) is near the rhinal fissure and is not significantly different from the point at which local waves stop (see text). The elliptical area comprises 95% of all points of origin of waves. B, histogram of mean pixel intensities from all GAD65/67-stained slices (E18–P0) in the same regions as shown in Fig. 1. Staining is highest in the septal nuclei (normalized to 1.0), lower in the pacemaker region (0.83 ± 0.03; P = 0.005 vs. septum), and lowest in the dorsal follower regions (0.61 ± 0.02; P < 0.001 vs. both septum and pacemaker). C, GAD65/67 staining, showing clear boundary near the rhinal fissure. D, Fluo-4 fluorescence at maximum spatial extent of a spontaneous wave in the same slice, superimposed on the GAD65/67 staining. The maximum extent of propagation of the wave is seen to very closely follow the distribution of GAD65/67 staining.
Results
In mouse cortex, spontaneous waves at E18–P1 occur as propagating waves that are initiated in a pacemaker in the ventral cortex (ROI 2 in Fig. 1) (Lischalk et al. 2009; Conhaim et al. 2010). In some waves, this cortical pacemaker is itself triggered by preceding activity in the septal nuclei (ROI 1 in Fig. 1) (Conhaim et al. 2010). In both cases, waves of activity propagate dorsally from the site of initiation at rates between 7 and 16 mm s−1. Only 16% of these waves propagate out of the ventral cortex to invade the dorsal cortex. The 84% of waves that are restricted to the pacemaker region stop at a very consistent point near the rhinal fissure, the boundary between piriform cortex (paleocortex) and neocortex (arrow, Fig. 1). Waves that do propagate into the dorsal cortex transiently slow their rate of propagation to 0.5 mm s−1 at this same point (see Conhaim et al. 2010).
Frequency and patterns of spontaneous waves change with development
To determine the range of stages during which spontaneous waves occur and how wave initiation and propagation change during that period, we used calcium imaging methods in 272 slices from 163 animals between E18 and P12. We found that propagating waves can be detected in cortex at all stages from E18 to P12 (Fig. 2A). At all stages, waves are initiated in either the septal nucleus or the ventral cortex (pacemaker), as we reported for activity at E18–P1 (Conhaim et al. 2010). The pattern of wave propagation, however, changes markedly during this period. The frequencies of events in the septal nucleus and pacemaker increase from E18 to peak values at P0 and P2, respectively, and then decrease steadily to near zero at P12 (Fig. 2A). The frequency of activity in the dorsal cortex (ROI 3 in Fig. 1) follows a different pattern, starting near zero at E18, rising gradually to peak at P5, and then decreasing to zero at P10. Thus, more events are initiated in the septum and pacemaker regions at early stages, but only a small percentage of those events propagate to the dorsal cortex. As development proceeds past P2, fewer events are initiated, but a greater fraction propagate into the dorsal cortex, so that event frequency in the dorsal cortex increases until P5. After P5, event frequencies in all regions decrease. This relationship is quantified in Fig. 2B, which shows the fraction of pacemaker events that propagate into the dorsal cortex as a function of stage. This fraction starts at 7% at E18, and increases steadily to reach 72% at P8. We did not measure significant changes in wave propagation velocity with development.
Figure 2. Developmental changes in the frequency and spatial pattern of spontaneous waves.
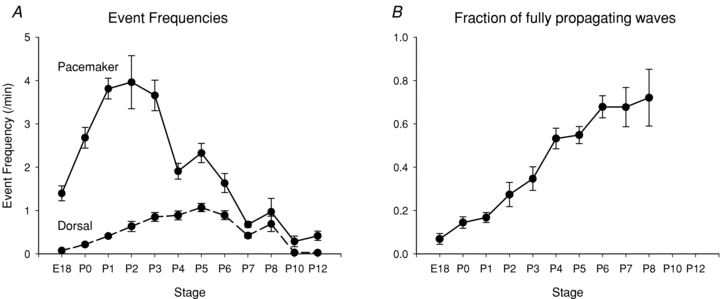
A, frequency of spontaneous waves in the ventral pacemaker (continuous line) and dorsal follower (dashed line) regions of the cortex. Note that pacemaker frequency is higher than follower frequency at early stages, because few events propagate out of the ventral cortex. Frequencies in the septal nuclei showed a similar pattern to that in the pacemaker regions, but peaked at P0. The apparent increase in frequency in the pacemaker between P4 and P5 is not significant (P = 0.31). B, the fraction of waves that propagate out of the ventral cortex steadily increases as a function of stage. Measurements beyond P8 were difficult due to the low overall frequency of events.
Sample records of fluorescence vs. time for each of the ROIs (see Fig. 1) are shown in Fig. 3. These records illustrate the reciprocal changes in pacemaker and dorsal event frequencies between P0 and P7. Figure 4 shows montages of images from films of Fluo-4 fluorescence superimposed on slice camera images (see Methods) for the two events marked in Fig. 3 at P0 and P7.
Figure 4. Montages of images of wave propagation at P0 and P7.
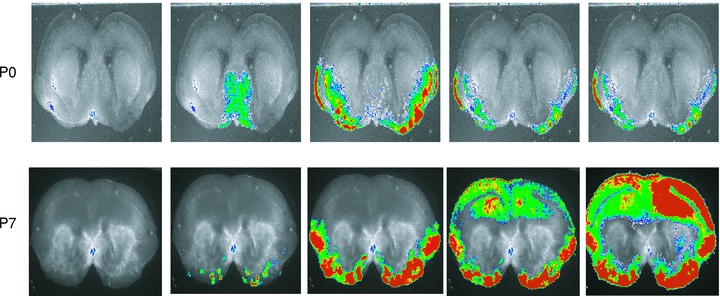
Events shown are marked in Fig. 3 with asterisks. Fluo-4 fluorescence is displayed (red, high; blue, low in online version) superimposed on the black-and-white slice image (see Methods). Note that the local wave at P0 is initiated in the septal nuclei and stops at a point near 0 deg (see Fig. 1), whereas the P7 wave is initiated in the cortical pacemaker and propagates to the dorsal midline. Both waves were initiated simultaneously on the left and right sides of the slice, which was not always the case. Frame intervals: 0.75 s.
Transmitter dependence of spontaneous waves changes with development
The above results show that spontaneous waves occur in cortex during a relatively long period of postnatal development, a time that spans the stages during which cortical GABA action changes from excitatory to inhibitory (Owens et al. 1996). Similar waves in hippocampus depend strongly on excitatory GABA transmission (Leinekugel et al. 1997), but cortical waves have been reported to depend primarily on AMPA-type glutamatergic activity (Garaschuk et al. 2000). We next asked whether the transmitter dependence of cortical waves might change during development, and how the changing nature of GABAergic transmission was manifest in wave properties.
At early stages (E18–P0), picrotoxin, a GABAA receptor blocker, blocks spontaneous waves by >90%, indicating a strong dependence of spontaneous waves of activity on GABAA excitation (Fig. 5A and B). By P6, however, picrotoxin exerts only a 33% block of activity, and by P7, picrotoxin increases the frequency of activity by 1.5-fold, indicating that GABAA action is inhibitory to waves. After P10, picrotoxin induces waves in slices that were previously silent (Fig. 5C), suggesting that the emergence of GABAA-based inhibition is, at least in part, causing the developmental disappearance of spontaneous waves (see also McCabe et al. 2006).
Figure 5. Inversion of the picrotoxin effect on spontanous waves between E18 and P12.
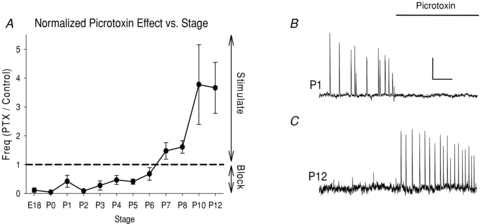
A, plot of normalized event frequency in picrotoxin vs. control as a function of stage. Numbers <1.0 indicate picrotoxin block of activity; numbers >1.0 indicate that picrotoxin stimulates activity. Dashed line at no picrotoxin effect (1.0) for reference. Note that picrotoxin inhibits activity >90% between E18 and P0, the picrotoxin effect inverts from inhibitory to excitatory between P6 and P7, and picrotoxin stimulates activity after P7. In cases where picrotoxin induced activity in a previously quiescent slice, an arbitrary value of 10 was used. B, example of block of spontaneous waves by picrotoxin at P1. C, example of induction of spontaneous waves in a previously quiescent slice at P12. In B and C, activity in the pacemaker is shown (ROI 2 in Fig. 1), although when picrotoxin induced activity at later stages, dorsal regions were also involved in all events. Scale bars: 4 min, 2%ΔF/F.
We next asked whether glutamate assumes the role of wave initiation after GABA assumes an inhibitory role. At E18, when GABAA receptor inhibition blocks waves by >90%, the AMPA receptor blocker CNQX reduces the frequency of waves by only 21% (Fig. 6A and B). By P6, when GABAA receptor blockade inhibits waves by only 33%, CNQX exerts a 92% block, and after P6, when GABAA inhibition stimulates waves, CNQX blocks waves completely (Fig. 6A and C). (CNQX data were not obtained after P8 because wave frequency is too low for reliable data.) At all stages, CNQX reduced the amplitude of the calcium transients, as seen in Fig. 6B. There was a significant transient decrease in CNQX sensitivity between P2 and P3 (P = 0.005), stages at which the waves are still substantially blocked by picrotoxin. We do not know the cause of this transient change.
Figure 6. Increase in CNQX block between E18 and P8.
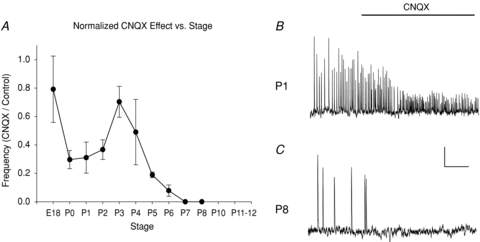
A, plot of normalized event frequency in CNQX vs. control as a function of stage. Unlike the case for picrotoxin, all numbers are <1.0, because CNQX never stimulates activity. B, example of lack of CNQX block of activity at P1. As was typical, CNQX reduced Ca2+ transient amplitude, but did not affect frequency. C, example of complete CNQX block of activity at P8. In B and C, activity in the pacemaker is shown (ROI 2 in Fig. 1). Scale bars: 4 min, 2%ΔF/F.
The above data indicate that, although spontaneous waves continue to be generated throughout the period E18–P8, the neurons responsible for initiating them gradually shift from the GABAergic to the glutamatergic population. The shift to glutamatergic waves explains how waves of activity continue to occur even after the changing Cl− gradient has converted GABA to an inhibitory transmitter.
Local and propagating waves show different transmitter dependence
The above data show that the developmental increase in the fraction of spontaneous waves that propagate from the ventral pacemaker into the dorsal cortex parallels the transition from a GABAergic to a glutamatergic pacemaker (compare Figs 2B and 5A). This suggests that, at intermediate stages when both transmitter systems participate in spontaneous waves, propagating waves might be mediated by the glutamatergic system and local pacemaker waves by the GABAergic system. To test this hypothesis, we measured the effects of picrotoxin and CNQX on local and fully propagating waves between P1 and P5 (Fig. 7). These results indicate that local waves are approximately seven times more sensitive to picrotoxin than are propagating waves (Fig. 7A and B). Conversely, fully propagating waves are about six times more sensitive to CNQX than are local waves (Fig. 7A and C). One interpretation of these data is that waves that are initiated by ventral GABAergic neurons do not often propagate dorsally because of the limited number of GABAergic neurons in the dorsal cortex at these stages (see below) and immature synaptic connections between this GABAergic population and dorsal glutamatertic neurons. Later, when ventral glutmatergic neurons become involved in wave initiation, synaptic circuitry within that population might allow more dorsal propagation.
Figure 7. Preferential effects of picrotoxin and CNQX on local and fully propagating waves.
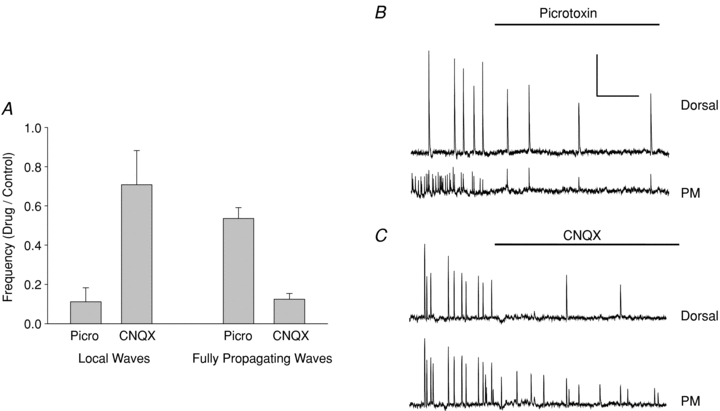
A, normalized frequencies of local and fully propagating waves in picrotoxin and CNQX vs. control. Picrotoxin preferentially blocks local waves, whereas CNQX preferentially blocks fully propagating waves. Data collected from P1–P5 slices, in which both types of waves showed significant frequencies (see Fig. 2). B, picrotoxin effect on activity in a P1 slice. Lower trace is from the pacemaker region (ROI 2 in Fig. 1); upper trace from dorsal region (ROI 3). Note that picrotoxin reduces pacemaker frequency much more than dorsal frequency. C, CNQX effect on activity in a P3 slice. Same regions as in B. Note that CNQX has the opposite effect, greatly reducing dorsal activity while having little effect on pacemaker frequency. Scale bars: 4 min, 4%ΔF/F.
Initiation sites and propagation patterns of spontaneous waves correlate with GABAergic neuron location
The fact the early GABAergic waves are restricted to the ventral cortex may be related to the location of GABAergic neurons themselves, as inhibitory interneurons are born in the ventrally located ganglionic eminences and radiate tangentially to their final destinations in dorsal cortex (Lavdas et al. 1999). To test directly whether waves at these stages are localized to regions containing GABAergic neurons, we stained E18 and P0 slices with antibodies directed against the synthetic enzyme for GABA, glutamic acid decarboxylase (GAD65/67; see Methods) (n = 20). Figure 8A shows a typical staining pattern, with higher expression of GAD65/67 in the septal nuclei and ventral cortex than in dorsal cortex. Within the ventral cortex, GAD expression declined in two steps along the path of wave propagation, one near −45 deg from the horizontal midline (Fig. 8A, white arrow) and a second near the boundary between ventral and dorsal cortex near the point of the rhinal fissure (Fig. 8A, black arrow). (These steps were detected as local maxima of the first spatial derivative of pixel density along the path of wave propagation. See Methods.) The resulting overall pattern of staining is summarized in Fig. 8B, in which mean staining intensity is quantified in the same ROIs shown in Fig. 1. GAD staining is highest in the septal nuclei, slightly but significantly lower in the ventral cortex, and lowest in the dorsal cortex. The two elliptical regions in Fig. 8A are drawn to encompass 95% of all wave initiation points (n = 55) (see Methods), indicating that wave initiation at these stages occurs consistently within regions of high GAD expression.
At these stages, spontaneous waves are mostly restricted to the ventral cortex. To test how closely this stop point corresponds to the second decline in GAD staining (Fig. 8A, black arrow), we imaged waves in nine E18–P0 slices and then processed those slices for GAD antibody staining. The second decline in GAD staining was located just ventral to the ventral–dorsal boundary of the slice (−9.9 ± 0.59 deg; see Fig. 1). This was not significantly different from the wave arrest point measured in our overall population of E18–P0 slices (−8.2 ± 0.7 deg, n = 81; P = 0.31), or within the slices where we obtained both imaging and GAD staining (−7.7 ± 1.0 deg; n = 9; P = 0.07). The close correspondence of the maximum extent of wave propagation at these early stages with the pattern of GAD staining is emphasized in Fig. 8C and D, which compares the maximum extent of wave spread with GAD staining in the same slice.
These data indicate that at early stages of development, between E18 and P0, when pharmacological evidence indicates a strong GABAergic component to spontaneous waves, waves initiate in regions of high GAD expression, and the spatial extent of their propagation is limited either by the spatial distribution of GABAergic neurons themselves or by the strength of the synaptic interactions among them, as indicated by elevated GAD expression.
Discussion
Waves of spontaneous activity propagate across both hemispheres of the mouse cerebral cortex from E18 to P12. We have shown that during this period, the waves undergo marked changes in frequency, in the spatial patterns of propagation, and in transmitter dependence. At all of these stages, waves are initiated in one of two pacemaker locations: the septal nuclei or the ventrolateral cortex (Lischalk et al. 2009; Conhaim et al. 2010). Frequencies of activity in these two regions peak at P0 and P2, respectively. At E18 and P0, about 90% of the waves are restricted to the septal nucleus and ventral cortex, with only 10% crossing into the dorsal cortex to reach the dorsal midline. As development proceeds, an increasing fraction of waves propagate dorsally, so that by P4, half of all waves propagate dorsally and by P8, 75% do. During these later stages, the frequency at which waves are initiated by the septal nucleus and ventral cortical pacemaker gradually decreases, so that the absolute frequency of waves propagating into the dorsal cortex peaks at P5 (Fig. 2).
All of our experiments were done in coronal slices. Spontaneous activity has also been recorded in horizontal slices, in which wave propagation in the anterior–posterior direction has been reported (Garaschuk et al. 2000; Corlew et al. 2004). It is likely that the 3-dimensional propagation patterns in vivo are more complex than either section plane reveals, which may increase the information content of the waves beyond what we detect here.
As these changes in the spatial patterns of propagation occur, the waves also change their transmitter dependence. At early stages, when most waves are local to the septal nucleus and ventral cortex, waves are blocked completely by picrotoxin but only partially by CNQX, indicating that wave initiation is primarily a function of GABAergic neurons. As development proceeds and an increasing fraction of waves propagate dorsally, picrotoxin sensitivity gradually diminishes and CNQX sensitivity increases, indicating a switch in the neuronal populations that initiate waves from GABAergic to glutamatergic (Figs 5 and 6). At intermediate stages, when both transmitter systems are participating, local waves are preferentially blocked by picrotoxin whereas propagating waves are preferentially blocked by CNQX (Fig. 7). These data and the immunocytochemical evidence shown in Fig. 8 indicate that developmental changes in wave propagation are a function of changing transmitter dependence and the different spatial distribution of GABAergic and glutamatergic neuronal populations.
Emergence of glutamatergic pacemaker parallels loss of GABA excitation
By P7, glutamatergic transmission assumes the primary role for initiating and propagating spontaneous waves and GABA becomes inhibitory to their initiation, as evidenced by the inversion of the picrotoxin effect on wave frequency from inhibitory to stimulatory at this stage (Fig. 5). The emergence of the cortical glutamatergic pacemaker, therefore, allows spontaneous waves to continue despite the changing sign of GABA action. Our data also indicate that glutamatergic circuits play a major role in causing waves to propagate into the dorsal cortex at later stages (see Fig. 7). The biological role of the switch in transmitter dependence of the cortical pacemaker may be to allow spontaneous waves to span a range of critical developmental stages that extend beyond the time when GABA transmission becomes inhibitory and incapable of wave initiation. Presumably, the cessation of waves after P12 reflects the development of GABA inhibition that is sufficiently intense to limit spontaneous activity to smaller clusters of coactive neurons (Rochefort et al. 2009) and to override the ability of glutamatergic excitation to initiate and propagate waves.
The transition in GABA action on spontaneous waves between P6 and P7 does not necessarily indicate that GABA becomes inhibitory as judged by the effects of its application to inactive cortical neurons. In order to inhibit the generation of waves, GABA action need only reduce the level of glutamatergic excitation to a point where it cannot sustain waves of activity, an action that GABA could carry out when its reversal potential becomes sufficiently negative to the glutamate reversal potential, even if it were still positive to threshold. Thus, it is possible for GABA to excite inactive neurons while at the same time inhibiting circuit generation of waves.
This switch in transmitter dependence of spontaneous waves parallels that reported in hippocampus (Garaschuk et al. 1998), but contrasts with the change from glutamatergic to GABAergic mechanisms reported in rat cortex (Allene et al. 2008) and the purely glutamatergic wave initiation reported by Garaschuk et al. (2000), also in rat. There are several possible explanations for these apparent discrepancies. GABA and glutamate have different effects on rat and mouse cortical neuronal migration (Behar et al. 1999), raising the possibility of species differences in the mechanisms of spontaneous waves. A more likely possibility, however, is that multiple mechanisms of spontaneous activity coexist in the cortex, as shown directly by Allene et al. (2008), and that the location and size of the recording field influences the results obtained. For example, at early stages in mouse cortex, spontaneous waves are restricted to the ventral regions, so that recordings in dorsal areas might show localized patterns of spontaneous activity different from the later waves that enter this region from the ventral pacemaker. Even within the ventral pacemaker, both GABAergic and glutamatergic events can coexist at intermediate stages (see Fig. 7).
In our experiments, the ventrolateral location of the cortical initiation zone does not change during the switch from GABA- to glutamate-based pacemaker. We could not determine the specific location within that ventrolateral region at all stages because wave propagation within the ventral cortex is too fast for our frame capture rate to detect small initiation points consistently (see Conhaim et al. 2010), so it remains possible that there is a small shift in pacemaker location as initiation switches between neuronal populations. The question remains, however, as to why the pacemaker remains ventrally located. Glutamatergic neurons are more widespread in the cortex at early stages because of their radial migratory pathway, in contrast to the tangentially migrating GABAergic neurons (Lavdas et al. 1999). It appears that some combination of intrinsic and synaptic properties of the glutamatergic circuitry in the ventral cortex endows those neurons with pacemaking ability. One possibility is that ventral glutamatergic neurons acquire these properties because they are exposed to high frequencies of GABA-initiated waves at early stages. If the GABAergic pacemaker activates glutamatergic neurons synchronously in this region, coincidence-detection mechanisms are likely to be invoked that strengthen glutamatergic synapses to the point that they form functional circuits capable of wave initiation. In this model, the shift to glutamatergic waves would depend on preceding GABAergic waves.
In fact, the close correspondence at early stages between GAD immunofluorescence and wave boundaries might also reflect activity-dependent mechanisms, especially of GAD-67 expression (Huang, 2009). It is possible that a feedback loop exists at early stages of cortical waves, whereby initial ventral localization of GABAergic neurons drives ventrally restricted waves, which in turn up-regulate GAD expression and strengthen synaptic transmission among GABAergic neurons within that restricted area, keeping wave localization relatively constant even as GABAergic interneurons continue to migrate dorsally.
Complex information content of variably propagating waves
These patterns endow spontaneous waves with a high level of information content compared to waves with uniform frequency and spatial patterns of propagation. Consider, for example, the differences between activity experienced by neurons in the dorsal vs. ventral cortex. In the dorsal cortex, activity at all stages will be correlated with immediately preceding activity ventrally, because all waves are initiated by the ventrally located pacemaker. However, as development proceeds between E18 and P10, dorsal and ventral neurons experience very different patterns of activity. Ventral neurons experience high frequencies of activity at early stages, and then frequency decreases gradually beginning at P2. Dorsal neurons, on the other hand, initially experience very low frequencies of activity because only a small fraction of waves propagate into the dorsal cortex. This frequency increases to a peak at P5, but this peak frequency is only 25% of the earlier peak frequency ventrally. After P5, dorsal and ventral neurons experience about the same, declining frequencies of activity. This suggests that downstream synaptic targets, for example, cannot only detect the spatial relationship between cortical neurons by the intervals between their bursts of activity during individual waves (resulting from the rate of wave propagation), but that they can also detect gross regional location of cortical neurons by the absolute frequencies of their activity at different stages of development.
Acknowledgments
This work was supported by grants from the National Science Foundation and the National Institutes of Health to W.J.M. C.R.E. was supported by the NIH Neurobiology Training Grant to the University of Washington, and in part by funding from the NIH to A. Folch, Dept of Bioengineering. M.B., E.R.C., J.G.M. and L.F.M. were supported by the Mary Gates Endowment for Undergraduate Research at the University of Washington.
Glossary
Abbreviations
- E
embryonic day
- P
postnatal day
- PFA
paraformaldehyde
Author contributions
The experiments were carried out in the laboratory of W.J.M. All authors contributed to the design and execution of experiments, to the analysis and interpretation of data, and to the critical revising of the manuscript. W.J.M. drafted the manuscript. All authors approved the final version.
References
- Allene C, Cattani A, Ackman JB, Bonifazi P, Aniksztejn L, Ban-Ari Y, Cossart R. Sequential generation of two distinct synapse-driven network patterns in developing neocortex. J Neurosci. 2008;28:12851–12863. doi: 10.1523/JNEUROSCI.3733-08.2008. [DOI] [PMC free article] [PubMed] [Google Scholar]
- Bahrey HP, Moody WJ. Voltage-gated currents, dye and electrical coupling in the embryonic mouse neocortex. Cereb Cortex. 2003;13:239–251. doi: 10.1093/cercor/13.3.239. [DOI] [PubMed] [Google Scholar]
- Balena T, Woodin MA. Coincident pre- and postsynaptic activity downregulates NKCC1 to hyperpolarize ECl during development. Eur J Neurosci. 2008;27:2402–2412. doi: 10.1111/j.1460-9568.2008.06194.x. [DOI] [PubMed] [Google Scholar]
- Barish ME. Increases in intracellular calcium ion concentration during depolarization of cultured embryonic Xenopus spinal neurones. J Physiol. 1991;444:545–565. doi: 10.1113/jphysiol.1991.sp018893. [DOI] [PMC free article] [PubMed] [Google Scholar]
- Behar TN, Scott CA, Greene CL, Wen X, Smith SV, Maric D, Liu QY, Colton CA, Barker JL. Glutamate acting at NMDA receptors stimulates embryonic cortical neuronal migration. J Neurosci. 1999;19:4449–4461. doi: 10.1523/JNEUROSCI.19-11-04449.1999. [DOI] [PMC free article] [PubMed] [Google Scholar]
- Biljenga P, Liu JH, Espinaos E, Haenggeli CA, Fischer-Lougheed J, Bader C, Bernheim L. T-type α1H Ca2+ channels are involved in Ca2+ signaling during terminal differentiation (fusion) of human myoblasts. Proc Natl Acad Sci U S A. 2000;97:7627–7632. doi: 10.1073/pnas.97.13.7627. [DOI] [PMC free article] [PubMed] [Google Scholar]
- Blankenship AG, Feller MB. Mechanisms underlying spontaneous patterned activity in developing neural circuits. Nat Rev Neurosci. 2010;11:18–29. doi: 10.1038/nrn2759. [DOI] [PMC free article] [PubMed] [Google Scholar]
- Butts DA, Feller MB, Shatz CJ, Rokhsar DS. Retinal waves are governed by collective network properties. J Neurosci. 1999;19:3580–3593. doi: 10.1523/JNEUROSCI.19-09-03580.1999. [DOI] [PMC free article] [PubMed] [Google Scholar]
- Conhaim J, Cedarbaum ER, Barahimi M, Moore JG, Becker MI, Gleiss H, Kohl C, Moody WJ. Bimodal septal and cortical triggering and complex propagation patterns of spontaneous waves of activity in the developing mouse cerebral cortex. Dev Neurobiol. 2010;70:679–692. doi: 10.1002/dneu.20797. [DOI] [PubMed] [Google Scholar]
- Corlew R, Bosma MM, Moody WJ. Spontaneous, synchronous electrical activity in neonatal mouse cortical neurons. J Physiol. 2004;560:377–390. doi: 10.1113/jphysiol.2004.071621. [DOI] [PMC free article] [PubMed] [Google Scholar]
- Garaschuk O, Hanse E, Konnerth A. Developmental profile and synaptic origin of early network oscillations in the CA1 region of rat neonatal hippocampus. J Physiol. 1998;507:219–236. doi: 10.1111/j.1469-7793.1998.219bu.x. [DOI] [PMC free article] [PubMed] [Google Scholar]
- Garaschuk O, Linn J, Eilers J, Konnerth A. Large-scale oscillatory calcium waves in the immature cortex. Nat Neurosci. 2000;3:452–459. doi: 10.1038/74823. [DOI] [PubMed] [Google Scholar]
- Gu X, Spitzer NC. Low-threshold Ca2+ current and its role in spontaneous elevations of intracellular Ca2+ in developing Xenopus neurons. J Neurosci. 1993;13:4936–4948. doi: 10.1523/JNEUROSCI.13-11-04936.1993. [DOI] [PMC free article] [PubMed] [Google Scholar]
- Gust J, Wright JJ, Pratt EB, Bosma MM. Development of synchronized activity of cranial motor neurons in the segmented embryonic mouse hindbrain. J Physiol. 2003;550:123–133. doi: 10.1113/jphysiol.2002.038737. [DOI] [PMC free article] [PubMed] [Google Scholar]
- Huang ZJ. Activity-dependent development of inhibitory synapses and innervation pattern: role of GABA signalling and beyond. J Physiol. 2009;587:1881–1888. doi: 10.1113/jphysiol.2008.168211. [DOI] [PMC free article] [PubMed] [Google Scholar]
- Hubner CA, Stein V, Harmans-Borgmeyer I, Meyer T, Ballanyi K, Jentsch TJ. Disruption of KCC2 reveals an essential role of K-Cl cotransport in early synaptic inhibition. Neuron. 2001;30:515–524. doi: 10.1016/s0896-6273(01)00297-5. [DOI] [PubMed] [Google Scholar]
- Hunt PN, McCabe AK, Bosma MM. Midline serotonergic neurons contribute to widespread synchronous activity in embryonic mouse hindbrain. J Physiol. 2005;566:807–819. doi: 10.1113/jphysiol.2005.089581. [DOI] [PMC free article] [PubMed] [Google Scholar]
- Kasyanov AM, Safiulina VF, Voronin LL, Cherubini E. GABA-mediated giant depolarizing potentials as coincidence detectors for enhancing synaptic efficacy in the developing hippocampus. Proc Natl Acad Sci U S A. 2004;101:5311–5312. doi: 10.1073/pnas.0305974101. [DOI] [PMC free article] [PubMed] [Google Scholar]
- Lavdas AA, Grigoriou M, Pachnis V, Parnavelas JG. The medial ganglionic eminence gives rise to a population of early neurons in the developing cerebral cortex. J Neurosci. 1999;99:7881–7888. doi: 10.1523/JNEUROSCI.19-18-07881.1999. [DOI] [PMC free article] [PubMed] [Google Scholar]
- Leinekugel X, Khalilov I, Ben-Ari Y, Khazipov R. Giant depolarizing potentials: the septal pole of the hippocampus paces the activity of the developing intact septohippocampal complex in vitro. J Neurosci. 1998;18:6349–6357. doi: 10.1523/JNEUROSCI.18-16-06349.1998. [DOI] [PMC free article] [PubMed] [Google Scholar]
- Leinekugel X, Medina I, Khalilov I, Ben-Ari Y, Khazipov R. Ca2+ oscillations mediated by the synergistic excitatory actions of GABAA and NMDA receptors in the neonatal hippocampus. Neuron. 1997;18:243–255. doi: 10.1016/s0896-6273(00)80265-2. [DOI] [PubMed] [Google Scholar]
- Lischalk JW, Easton CR, Moody WJ. Bilaterally propagating waves of spontaneous activity arising from discrete pacemakers in the neonatal mouse cerebral cortex. Dev Neurobiol. 2009;69:407–414. doi: 10.1002/dneu.20708. [DOI] [PubMed] [Google Scholar]
- McCabe AK, Chisholm SL, Picken-Bahrey HL, Moody WJ. The self-regulating nature of spontaneous synchronized activity in developing mouse cortical neurones. J Physiol. 2006;577:155–167. doi: 10.1113/jphysiol.2006.117523. [DOI] [PMC free article] [PubMed] [Google Scholar]
- Meister M, Wong ROL, Baylor DA, Shatz CJ. Synchronous bursts of action potentials in ganglion cells of the developing mammalian retina. Science. 1991;252:939–943. doi: 10.1126/science.2035024. [DOI] [PubMed] [Google Scholar]
- Menendez de la Prida I, Sanchez-Andres JV. Heterogeneous populations of cells mediate spontaneous synchronous bursting in the developing hippocampus through a frequency-dependent mechanism. Neuroscience. 2000;97:227–241. doi: 10.1016/s0306-4522(00)00029-4. [DOI] [PubMed] [Google Scholar]
- Moody WJ, Bosma MM. Ion channel development, spontaneous activity, and activity-dependent development in nerve and muscle cells. Physiol Rev. 2005;85:883–941. doi: 10.1152/physrev.00017.2004. [DOI] [PubMed] [Google Scholar]
- O'Donovan MJ, Chub N, Wenner P. Mechanisms of spontaneous activity in developing spinal networks. J Neurobiol. 1998;37:131–145. doi: 10.1002/(sici)1097-4695(199810)37:1<131::aid-neu10>3.0.co;2-h. [DOI] [PubMed] [Google Scholar]
- Owens DF, Boyce LH, Davis MBE, Kriegstein AR. Excitatory GABA responses in embryonic and neonatal cortical slices demonstrated by gramicidin perforated-patch recordings and calcium imaging. J Neurosci. 1996;16:6414–6423. doi: 10.1523/JNEUROSCI.16-20-06414.1996. [DOI] [PMC free article] [PubMed] [Google Scholar]
- Picken-Bahrey HP, Albrieux M, Moody WJ. Early development of voltage-gated ion currents and firing properties in neurons of the mouse cerebral cortex. J Neurophysiol. 2003;89:1761–1773. doi: 10.1152/jn.00972.2002. [DOI] [PubMed] [Google Scholar]
- Rockhill W, Kirkman JL, Bosma MM. Spontaneous activity in the developing mouse midbrain driven by an external pacemaker. Dev Neurobiol. 2009;69:689–704. doi: 10.1002/dneu.20725. [DOI] [PubMed] [Google Scholar]
- Rochefort NL, Garaschuk O, Milos RI, Narushima M, Marandi N, Pichler B, Kovalchuk Y, Konnerth A. Sparsification of neuronal activity in the visual cortex at eye-opening. Proc Natl Acad Sci U S A. 2009;106:15049–15054. doi: 10.1073/pnas.0907660106. [DOI] [PMC free article] [PubMed] [Google Scholar]
- Rohrbough J, Spitzer NC. Regulation of intracellular Cl− levels by Na+-dependent Cl− cotransport distinguishes depolarizing from hyperpolarizing GABAA receptor-mediated responses in spinal neurons. J Neurosci. 1996;16:82–91. doi: 10.1523/JNEUROSCI.16-01-00082.1996. [DOI] [PMC free article] [PubMed] [Google Scholar]
- Schambra UB, Lauder JM, Silver J, editors. Atlas of the Prenatal Mouse Brain. New York: Academic Press Inc.; 1992. [DOI] [PubMed] [Google Scholar]
- Shatz CJ, Stryker MP. Prenatal tetrodotoxin infusion blocks segregation of retinogeniculate afferents. Science. 1988;242:87–89. doi: 10.1126/science.3175636. [DOI] [PubMed] [Google Scholar]
- Strata F, Atzori M, Molnar M, Ugolini G, Tempia F, Cherubini E. A pacemaker current in dye-coupled hilar interneurons contributes to the generation of giant GABAergic potentials in developing hippocampus. J Neurosci. 1997;17:1435–1446. doi: 10.1523/JNEUROSCI.17-04-01435.1997. [DOI] [PMC free article] [PubMed] [Google Scholar]
- Tarasenko AN, Isaev DX, Eremin AV, Kostyuk PG. Developmental changes in the expression of low-voltage-activated Ca2+ channels in rat visual cortical neurones. J Physiol. 1998;509:385–394. doi: 10.1111/j.1469-7793.1998.385bn.x. [DOI] [PMC free article] [PubMed] [Google Scholar]
- Voigt T, Optiz T, de Lima AD. Activation of early silent synapses by spontaneous synchronous network activity limits the range of neocortical connections. J Neurosci. 2005;25:4604–4615. doi: 10.1523/JNEUROSCI.3803-04.2005. [DOI] [PMC free article] [PubMed] [Google Scholar]
- Zheng J, Lee S, Zhou ZJ. A transient network of intrinsically bursting starburst amacrine cells underlies the generation of retinal waves. Nat Neurosci. 2006;9:363–371. doi: 10.1038/nn1644. [DOI] [PubMed] [Google Scholar]