

Non-technical summary
The strength of the heart beat is regulated by a short-lived increase of calcium in the cardiac muscle cells. This calcium concentration is assumed to rise particularly high in microdomains where it modulates calcium-dependent processes and controls calcium release from the intracellular store. However, direct measurement of microdomain calcium remains a technical challenge. We have used as reporters the ionic currents from L-type Ca2+ channels and from the Na+/Ca2+ exchanger, proteins that are located in these microdomains and sensitive to local calcium. Microdomain calcium has a much sharper rise and fall than the global calcium signal and its amplitude is 20–30 times higher. Surprisingly, for different global signals, the microdomain signal remained equally high. These findings show the feasibility of reporting on microdomain calcium and demonstrate the divergence between microdomain and global calcium signals.
Abstract
Abstract
During Ca2+ release from the sarcoplasmic reticulum triggered by Ca2+ influx through L-type Ca2+ channels (LTCCs), [Ca2+] near release sites ([Ca2+]nrs) temporarily exceeds global cytosolic [Ca2+]. [Ca2+]nrs can at present not be measured directly but the Na+/Ca2+ exchanger (NCX) near release sites and LTCCs also experience [Ca2+]nrs. We have tested the hypothesis that ICaL and INCX could be calibrated to report [Ca2+]nrs and would report different time course and values for local [Ca2+]. Experiments were performed in pig ventricular myocytes (whole-cell voltage-clamp, Fluo-3 to monitor global cytosolic [Ca2+], 37°C). [Ca2+]nrs-dependent inactivation of ICaL during a step to +10 mV peaked around 10 ms. For INCX we computationally isolated a current fraction activated by [Ca2+]nrs; values were maximal at 10 ms into depolarization. The recovery of [Ca2+]nrs was comparable with both reporters (>90% within 50 ms). Calibration yielded maximal values for [Ca2+]nrs between 10 and 15 μmol l−1 with both methods. When applied to a step to less positive potentials (−30 to −20 mV), the time course of [Ca2+]nrs was slower but peak values were not very different. In conclusion, both ICaL inactivation and INCX activation, using a subcomponent analysis, can be used to report dynamic changes of [Ca2+]nrs. Absolute values obtained by these different methods are within the same range, suggesting that they are reporting on a similar functional compartment near ryanodine receptors. Comparable [Ca2+]nrs at +10 mV and −20 mV suggests that, although the number of activated release sites differs at these potentials, local gradients at release sites can reach similar values.
Introduction
Ca2+ release from the sarcoplasmic reticulum (SR) through the ryanodine receptor (RyR) is a central event in the excitation–contraction coupling of cardiac myocytes with opening of RyRs triggered by Ca2+ influx, predominantly across the sarcolemma through L-type Ca2+ channels (LTCCs) (Bers, 2002). This functional scheme is supported by a dedicated structural organization in dyads where LTCCs in sarcolemma face clusters of RyRs in the SR, separated by a narrow cleft. In ventricular myocytes, these dyads are mostly found in the T-tubules (Franzini-Armstrong et al. 1999). In the dyadic cleft the local Ca2+ concentration during Ca2+ influx and triggered SR Ca2+ release is expected to differ substantially from the bulk cytosolic Ca2+ concentration (Soeller & Cannell, 1997). This local [Ca2+] provides a tight control on the release mechanism allowing for a graded overall release process. Other Ca2+ transport systems, such as the Na+/Ca2+ exchanger (NCX) and Na+ transporters such as Na+ channels and the Na+/K+-ATPase, can modulate the dyadic [Ca2+] and the release process. Co-localization studies using immunofluorescence labelling indicate a more tight interplay between RyRs and LTCCs compared to other transporters, and with different subpopulations for NCX(Scriven et al. 2000).
The evidence for the existence of a defined [Ca2+] near release sites and a gradient with cytosolic [Ca2+] is quite compelling. The observation of Ca2+ release triggered by Na+ current at voltages below activation of LTCCs led to the concept of a fuzzy space with restricted diffusion for Na+ and Ca2+ (Leblanc & Hume, 1990; Lederer et al. 1990). The interpretation of these data has been debated (e.g. Sipido et al. 1995b) and theoretical modelling by Langer & Peskoff (1996) failed to obtain a rise in Ca2+ through NCX of sufficient speed and amplitude to activate RyRs. However, even if NCX may not be very efficient in itself in triggering SR Ca2+ release, it is likely that Ca2+ influx through NCX has a modulatory role in the release process and acts synergistically with LTCCs (Sobie et al. 2008; Larbig et al. 2010).
Some of the most direct data in favour of the existence of a gradient of [Ca2+] from release sites to cytosol are the discrepancy between the Ca2+-activated NCX current, INCX, observed during the release process and the expected INCX based on the observed cytosolic [Ca2+] (e.g. Trafford et al. 1995). During a caffeine-induced SR Ca2+ release, hysteresis is seen on the curve relating INCX to Ca2+. It is assumed that late during the decline of the caffeine-induced Ca2+ transient the [Ca2+] gradients between cytosol and release sites in the dyad have dissipated. Hence, using the [Ca2+]–INCX relation during this late phase, or the [Ca2+]–INCX relation obtained during steady state experiments, local [Ca2+] during SR Ca2+ release has been extrapolated to be up to 10-fold higher than the cytosolic values (Weber et al. 2002).
Additional experimental support for local gradients comes from studying the LTCC current, ICaL. Ca2+-dependent inactivation of ICaL during SR Ca2+ release exceeds what can be expected from bulk [Ca2+] (Sipido et al. 1995a; Adachi Akahane et al. 1996). This effect was independent of the membrane potential and was postulated to result from direct binding of Ca2+ outside the pore of the channel (Sipido et al. 1995a). The Ca2+ sensor mediating Ca2+-dependent inactivation was indeed found to be located in the C-terminal tail of the α-subunit (de Leon et al. 1995; Peterson et al. 2000). The Ca2+-dependent modulation of ICaL has been used to extract data on the release process (Shannon et al. 2000; Zahradnikova et al. 2004) and the extent of inactivation and recovery of ICaL was recently also used to demonstrate differences in [Ca2+] near release sites in a model of cardiac hypertrophy (Antoons et al. 2007).
Theoretical modelling of dyadic cleft [Ca2+] is based on structure of the dyadic cleft, arrangements of the different transporters and functional properties of single channels and transporters. In different computational models dyadic cleft [Ca2+] varies between tens and hundreds of micromolar (Langer & Peskoff, 1996; Soeller & Cannell, 1997; Shannon et al. 2004; Sobie & Ramay, 2009).
The relevance of this local [Ca2+] is not limited to excitation–contraction coupling but also affects current thinking about Ca2+-dependent signalling, as e.g. CaMKinase (Couchonnal & Anderson, 2008). Yet directly measuring this local [Ca2+] remains a challenge. Current fluorescent Ca2+ indicators predominantly report the cytosolic [Ca2+], though simultaneous buffering of the cytosolic Ca2+ reveals spiky signals that may reflect SR Ca2+ release (Song et al. 1998).
In the current study we have compared different methods using ICaL and INCX to examine local [Ca2+] during SR Ca2+ release evoked be a simple depolarizing step, testing the hypothesis that with different localization these reporters would yield different time course and values for local [Ca2+]. Because we are using reporters that are near release sites, without making direct information on the structural location, we refer to this [Ca2+] as [Ca2+]nrs rather than dyadic cleft Ca2+ as used in computational models. We examine the time course and extent of activation of INCX and of Ca2+-dependent inactivation of ICaL and recovery of this process. We subsequently derive more quantitative estimates on [Ca2+]nrs from these measurements and compare the results obtained with the two reporters. The experimental data stimulated computational modelling which provided validation of this experimental approach (Livshitz et al. submitted). In the present paper we further examined in situ calibration methods and compared [Ca2+]nrs at different potentials.
Methods
Animals and myocyte isolation
Ventricular myocytes were isolated from the mid-myocardial layer of the posterior wall of healthy pigs. Animals (n = 12, weight 35–45 kg) were housed and treated according to the Guide for the Care and Use of Laboratory Animals (National Institutes of Health, USA); experimental protocols were approved by the in-house ethical committee (KULeuven Ethical Committee for Animal Experiments). The current study conforms with the ethical standards set by The Journal of Physiology (Drummond, 2009).
The isolation procedure was as described before (Heinzel et al. 2002). Killing of the pigs was done under full anaesthesia (premedication with tiletamine and zolazepam, 4 mg kg−1i.m. and xylazine 0.25 mg kg−1i.m., maintenance anaesthesia with propofol i.v., 7 mg kg−1 h−1); pigs were intubated and ventilated with a 1:1 oxygen–air mixture. After an additional bolus of pentobarbital (100 mg kg−1i.v.), hearts were excised quickly and placed in oxygenated Tyrode solution. The circumflex coronary artery was cannulated and the myocardium was perfused with Ca2+-free Tyrode solution and subsequently enzyme solution. Isolated cells were stored at room temperature and used within 12 h.
Solutions
Chemicals were purchased from Sigma, fluorescent probes from Invitrogen, Belgium. Tyrode solution for cell storage contained (in mmol l−1): NaCl 130, KCl 5.4, Hepes 11.8, MgCl2 0.5, CaCl2 1.8, and glucose 10, pH 7.40 with NaOH. For recording ICaL and INCX, the extracellular solution contained (in mmol l−1): NaCl 130, CsCl 10, Hepes 11.8, MgCl2 0.5, CaCl2 1.8, glucose 10; pH 7.4 adjusted with NaOH. To block the fast Na+ current 200 μmol l−1 lidocaine was included in the external solution. In order to increase the amplitude of the ICaL and facilitate study of Ca2+-dependent inactivation and recovery by increasing SR Ca2+ content, 5 μmol l−1 forskolin was added to the external solution. The pipette solution contained (in mmol l−1): caesium aspartate 120, TEACl 10, NaCl 5, Hepes 10, MgCl2 0.5, MgATP 5, pH 7.2 adjusted with CsOH, with 50 μmol l−1 K5Fluo-3 added as a fluorescent Ca2+ indicator for measurement of the global cytosolic Ca2+ concentration. In the experiments carried out in Na+-free conditions the external solution contained (in mmol l−1): N-methyl-d-glucamine 120, TEACl 20, Hepes 11, MgCl2 0.5, CaCl2 1.8, glucose 10; pH 7.4 with HCl; for these experiments NaCl was omitted from the pipette solution.
Cardiac myocytes were placed in a perfusion chamber on an inverted microscope (Nikon Diaphot). The set-up for epifluorescence recording, calibration of the [Ca2+]i-dependent fluorescence and measurement of membrane currents were as described previously (Antoons et al. 2002). Fluorescence signals were recorded from the entire cell and calibrated to [Ca2+] after obtaining Fmax at the end of the experiments. All experiments were performed at 36°C.
The voltage protocols are described in the Results and illustrated in the figures.
Results
Ca2+-dependent inactivation and recovery of ICaL with SR Ca2+ release
In a first experimental approach we recorded ICaL with various amplitudes of SR Ca2+ release, without contamination from other ionic currents (Fig. 1A). To this end, after depletion of the SR with a brief application of caffeine, cells were repeatedly stimulated in Na+-free conditions. This led to increasing SR Ca2+ load as Ca2+ efflux on Na+/Ca2+ exchange was inhibited. The example shows superimposed ICaL traces and Ca2+ transients of the first four pulses. During the first depolarizing step the rise in cytosolic Ca2+ is due to Ca2+ influx through LTCC only. With successive pulses the increasing amplitude of the transients reflected increasing SR Ca2+ release with gradual filling of the SR Ca2+ store. This caused concomitant changes in the Ca2+ current: peak ICaL decreased and the rate of inactivation was faster. For direct identification of the release-dependent modulation of ICaL, we subtracted the current of the fourth pulse with a large amount of release from the current during the first step without release (Fig. 1A right panel). This difference current then represents the fraction of the channels inactivated by the release process (the first current recording, I0, is taken as reference, and current difference is shown as 1 –I/I0, Fig. 1B). The peak of the difference current is the time at which release-dependent inactivation is maximal, and the decline then reflects recovery from this process. In Fig. 1B, we superimposed this difference current and the upstroke of the global Ca2+ transient of the fourth pulse with high SR Ca2+ release. As expected, the time course of the difference current was faster than the changes of global Ca2+ reported by fluo-3. From the global Ca2+ transient we calculated the net Ca2+ flux through the SR as previously described (Sipido & Wier, 1991). Figure 1C shows a plot of the calculated SR Ca2+ flux with superimposed ICaL difference current as a measure of Ca2+-dependent inactivation. There was a much closer relation than with the global Ca2+ transient, suggesting that Ca2+-dependent regulation of ICaL was driven by local Ca2+ release, rather than by global changes throughout the cytosol.
Figure 1. Extent and time course of inactivation of ICaL related to SR Ca2+ release.
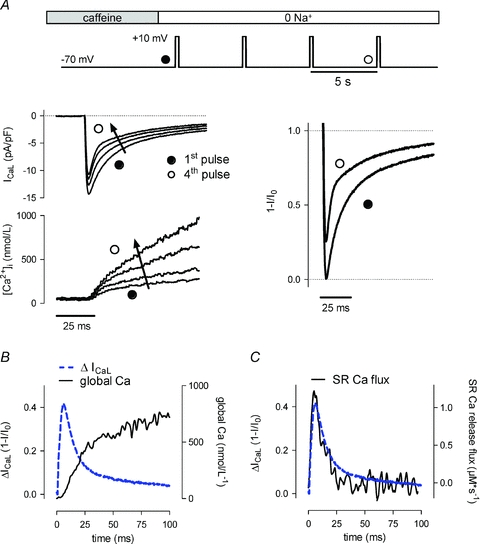
A, protocol and typical example of ICaL and Ca2+ transients with increasing SR Ca2+ load. After depletion of SR Ca2+ with caffeine, cells were reloaded by applying repetitive depolarizing pulses to +10 mV in 0 Na+ conditions to prevent Ca2+ removal on NCX. The arrow on ICaL indicates the increasing rate of inactivation of ICaL. Current traces (right) corresponding to a low (filled circle) or large (open circle) amount of SR Ca2+ release are shown after normalization to I0, the first ICaL. B, difference current between normalized traces from A, together with the Ca2+ transient of the fourth pulse. C, difference current superimposed on the SR release flux calculated from the Ca2+ transient of the fourth pulse (see text for details).
We next examined the modulation of ICaL at a lower membrane potential where fewer Ca2+ channels are opening with increased latency. Concurrently, release events are more scattered and temporally inhomogeneous, as illustrated in Fig. 2A. At this potential, though global SR Ca2+ release across the cell is less than at +10 mV, locally the gain of the release process is high (Wier et al. 1994; Cannell et al. 1995; Altamirano & Bers, 2007b). Figure 2B shows an example of recordings at −20 mV and in the right panel the difference current illustrates the time course of SR release-dependent modulation which appears slower in onset and decay than at +10 mV. The different time course at these two potentials is further illustrated in Fig. 2C, showing the averaged traces of difference currents obtained in a series of cells at +10 mV and at −20 mV. Figure 2D gives mean data of the individual recordings confirming that indeed the time of onset of release-dependent inactivation is later at −20 mV. However, this analysis also shows that the extent of inactivation is not different and tends to be even larger at −20 mV than at +10 mV. This occurs despite lower amplitude of global Ca2+ transients (337 ± 103 nmol l−1 at −20 mV vs. 809 ± 244 nmol l−1 at +10 mV, n = 6–11) and total SR Ca2+ content (33 ± 6 μmol l−1 at −20 mV vs. 121 ± 19 μmol l−1 at +10 mV, P < 0.05).
Figure 2. ICaL and release-dependent modulation at different levels of depolarization.
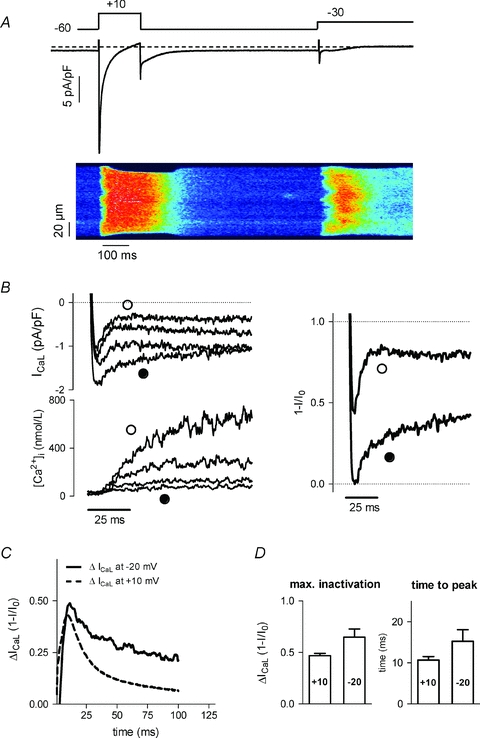
A, examples of Ca2+ transients in confocal line scan recordings with corresponding ICaL during a step to +10 and −30 mV. B, traces of ICaL, Ca2+ transients and release-dependent inactivation at −20 mV (as in Fig. 1). C, time course of release-dependent inactivation of ICaL at different voltages; averaged traces of difference currents from n = 11 cells at +10 mV and n = 6 cells at −20 mV. D, comparison of maximal inactivation and time to peak of the difference currents recorded at +10 (n = 11) and −20 mV (n = 6).
Inactivation and recovery of ICaL in the presence of Na+/Ca2+ exchange
In the previous approach, Ca2+-dependent ICaL inactivation was measured in Na+-free conditions, which ensures recording of ‘pure’ICaL, but the absence of functional Na+/Ca2+ exchange may affect local Ca2+ dynamics. We therefore examined ICaL in a different protocol that allowed us to probe more directly the level of inactivation during the time course of SR Ca2+ release (Fig. 3A). First, we applied a step to +10 mV to induce maximal activation of LTCCs, and the peak amplitude of ICaL was taken as reference for maximal availability of Ca2+ channels (zero level of inactivation; first trace, thick black, in Fig. 3A). Next, during a depolarization to −30 mV which activates only a fraction of LTCCs, we interrupted the depolarization at incremental time intervals with a test step to +10 mV (series of traces in Fig. 3A, blue trace at 50 ms, red trace at 110 ms). Comparing the amplitude of ICaL evoked by each test step to the reference step from the holding potential reflects the degree of inactivation, and [Ca2+]nrs, present at that time point. This degree of inactivation is calculated as 1 –I/I0, with in this case I0 being the amplitude of the reference current during the step to +10 mV from the holding potential.
Figure 3. SR Ca2+ release-dependent inactivation and recovery of ICaL in the presence of Na+/Ca2+ exchange.
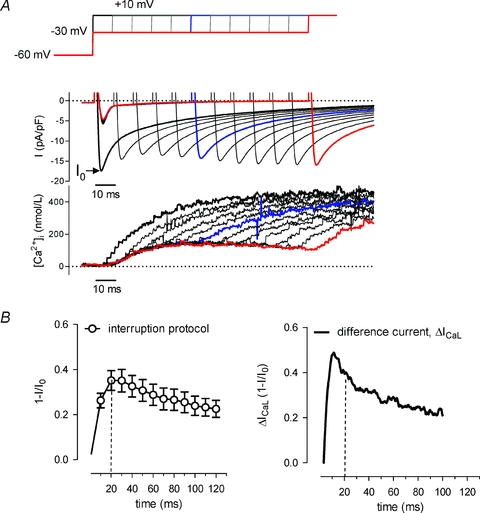
A, voltage clamp protocol, current recordings and corresponding Ca2+ transients. A step to +10 mV from the holding potential is given to set a reference for maximal availability of LTCCs (peak ICaL is I0, marked by arrow, no inactivation). Subsequently a series of depolarizing steps to −30 mV are applied. Each step is interrupted with a test step to +10 mV at increasing time intervals after the initial depolarization, starting at 10 ms, with increments of 10 ms. With these test steps we measure availability of Ca2+ channels (peak of ICaL, I) and thus the inactivation of LTCCs incurred during the step to −30 mV, compared to the reference, I0; the degree of inactivation is expressed as 1 –I/I0. A test step at 50 ms is marked in blue (1 –I/I0 is 0.21), a step at 100 ms is marked in red (1 –I/I0 is 0.11). B, left panel, mean data obtained with the protocol of panel A for degree of inactivation of LTCCs during a step to −30 mV (n = 8). The right panel repeats the data from Fig. 2C for a step to −20 mV for comparison.
In Fig. 3B, the mean data for inactivation and recovery of ICaL observed with this interruption protocol are shown in the left hand panel. The limitation of this protocol is that we can study ICaL modulation only at this negative potential, because we need a low level of activation against our test step to +10 mV, but we can compare these results to our earlier analysis at −20 mV. These are shown for comparison in the right-hand panel of Fig. 3B (data from Fig. 2). While the difference current at −20 mV has a sharper peak, the further time course is very comparable.
Deriving more quantitative values on [Ca2+]nrs from ICaL
To extract local [Ca2+]nrs from ICaL inactivation, a calibration curve is needed. Hofer et al. (1997) measured steady state inactivation of Ca2+ channels in excised patches and report a Kd value of 4 μmol l−1. Based on these data we calculated [Ca2+]nrs from the difference currents (Fig. 2C) and obtained values between 10 and 15 μmol l−1 (Fig. 4A). Since the data of Hofer et al. were not obtained in physiological conditions, we also established a calibration curve in intact cells. We measured the availability of ICaL at +10 mV for various levels of cytosolic Ca2+, in conditions where we assume equilibrium between Ca2+ in the cytosol, measured with fluorescent dyes, and Ca2+ near release sites. After eliciting Ca2+ release with a caffeine application, there is a slow decline of Ca2+ where this condition is assumed to be met and rather high levels of Ca2+ can be achieved. The protocol is illustrated in Fig. 4B. First, a step to +10 mV provides the reference maximal ICaL (I0). After 3 s caffeine is applied to induce SR Ca2+ release with a test step to activate ICaL during the Ca2+ removal phase. The reduced peak of ICaL at the second step reflects inactivation by elevated Ca2+ levels. The protocol was repeated with different timing between the caffeine and test pulse and inactivation of ICaL was calculated as a fraction of total current for different values of [Ca2+]. We could thus construct a calibration curve with individual data plotted against [Ca2+] and described by a Michaelis–Menten model. (Fig. 4C). The Kd value of this fit was 0.78 ± 0.067 μmol l−1[Ca2+]i and maximal inactivation was 0.61 ± 0.025 of total current (mean data from 10 cells with multiple tests per cell). We next used this calibration to estimate [Ca2+]nrs from the difference currents of Fig. 2C. This approach yielded mean maximal [Ca2+]nrs values of 2–3 μmol l−1 during release triggered by a depolarizing step to −20 mV (Fig. 4D).
Figure 4. Estimation of [Ca2+]nrs from release-dependent inactivation of ICaL.
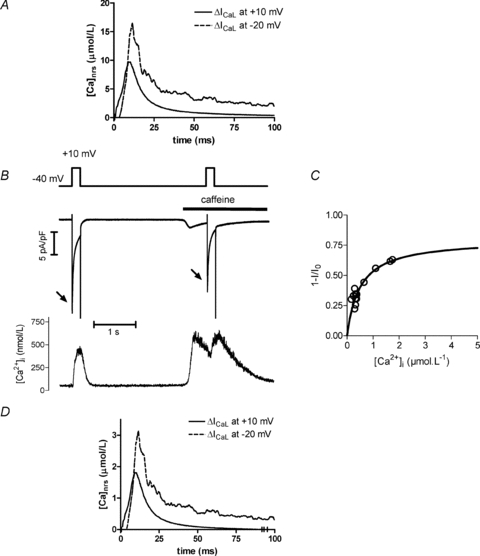
A, [Ca2+]nrs estimated using the calibration curve for steps to +10 and −20 mV (data from Fig. 2C and using calibration of Hofer et al. (1997)). B, protocol for establishing an intracellular calibration curve. After the first pulse evoking a reference ICaL (I0, no inactivation), 10 mm caffeine was applied to the cell to induce SR Ca2+ release. During the declining phase of the [Ca2+]i transient a test depolarizing pulse was given to record ICaL (I) and estimate Ca2+-dependent inactivation. This was applied with different delays to obtain I at different [Ca2+]. C, Ca2+-dependent inactivation of ICaL plotted against [Ca2+]. Maximal inactivation (M) and Ca2+ causing half-maximal inactivation (Kd) were estimated for individual cells by fitting the equation 1 –I/I0=M× Ca/(Ca +Kd) to the data points. A calibration curve to relate release-dependent inactivation and Ca2+ was constructed using the mean values of M and Kd (0.61 ± 0.025 and 780 ± 67 nm, respectively, n = 10 cells). D, [Ca2+]nrs estimated using the calibration curve for steps to +10 and −20 mV (data from Fig. 2C).
The calibration procedure, through the non-linear nature of the curve, reveals better the time course of [Ca2+]nrs reported by ICaL, with the fast recovery, and accentuates the differences between the two depolarization levels. Issues relating to the absolute values of [Ca2+]nrs are addressed in the Discussion.
NCX tail currents as sensor for [Ca2+]nrs levels
The NCX current has different properties as Ca2+ probe compared to Ca2+ channels. NCX current immediately increases in response to Ca2+ due to the shift in the reversal potential, but also is regulated through Ca2+-dependent activation and a slower allosteric modulation. With a resting [Ca2+] of around 120 nmol l−1, the first is probably the main process responsible for changes in NCX current during a single step. Therefore activation of NCX during the time course of SR Ca2+ release is another method to derive time course and values of [Ca2+]nrs.
To measure activation of NCX related to [Ca2+]nrs during SR Ca2+ release, we used a variant of the protocol described above in Fig. 3. In this protocol, we now repolarized to −70 mV at incremental time intervals during a depolarizing step (Fig. 5A). On this repolarization, INCX is measured as tail current, as described before, e.g. during the action potential (Egan et al. 1989); examples of these tail currents are shown in Fig. 5A. The peak value of INCX reflects the [Ca2+] near NCX at this time point. We then used two approaches to derive [Ca2+]nrs from these values.
Figure 5. Translating NCX current into [Ca2+]nrs using the global NCX current.
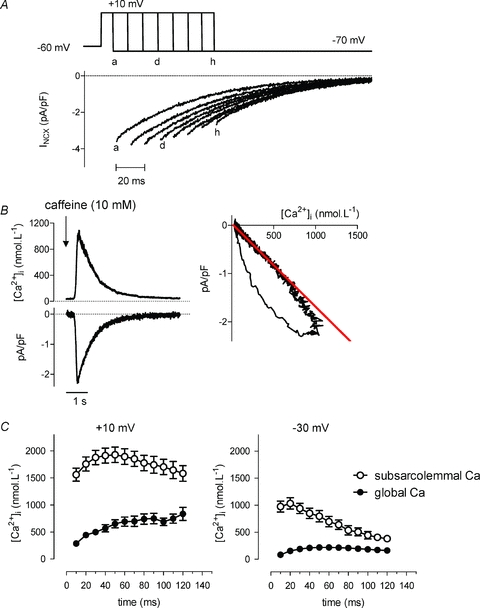
A, voltage protocol illustrating how a step to +10 mV is interrupted by repolarization to −70 mV at increasing time intervals, to record the tail NCX currents on repolarization. The letters a, d, and h denote the corresponding repolarization time and currents. The current traces during the depolarization have been omitted for clarity. B, calibration for converting NCX current amplitude to [Ca2+]. Typical recordings of Ca2+ transient and the concomitant inward INCX after application of 10 mm caffeine. A linear relationship (right) between INCX amplitude and Ca2+ was obtained by fitting a line to the declining phase of the caffeine induced Ca2+ transient (intercept 106.5 ± 14.1 nm, slope –0.00194 ± 0.000129 pA pF−1 nm−1, n = 25). C, global Ca2+ transient (filled circles) during SR Ca2+ release and subsarcolemmal Ca2+ (open circles) estimated by using the linear relationship in B for a step to +10 mV (left panel, n = 4), and to −30 mV (right panel, n = 8).
First, a straightforward approach was to calibrate this peak value of the NCX tail current for [Ca2+] near the membrane. This approach has been used before (e.g. Weber et al. 2002) and is introduced here as a reference for subsequent alternative approaches. We first established a calibration curve based on measurement of NCX during a caffeine-induced release of Ca2+ from the SR. In this experiment, the NCX current typically shows hysteresis when plotted against the values for cytosolic [Ca2+] reported by a fluorescent dye (Fig. 5B, right-hand graph). The larger NCX current values are seen during the release phase and reflect that [Ca2+] near NCX is higher than apparent from the fluorescence measurements, implying a local source of high Ca2+ and gradients (Trafford et al. 1995). However, during the descending phase of the caffeine-induced Ca2+ transient, it can be assumed that gradients have dissipated and that the relation between INCX and [Ca2+] can be used as calibration to derive [Ca2+] values from current measurements. We thus fitted this descending phase and based on this calibration (red trace in the graph), we calculated maximal values for [Ca2+] around 1.5 μmol l−1 during a step to −30 mV and up to 2 μmol l−1 for a step to +10 mV (Fig. 5C). These values are lower than what we derived from ICaL for similar depolarizations and also much slower in time course. This indicates that the global NCX current, even when recalculated for average subsarcolemmal [Ca2+], is not reporting on a similar [Ca2+] transient to that reported by ICaL.
Identification of a NCX component reporting on [Ca2+]nrs
Indeed, the second distinguishing feature of INCX versus ICaL as a probe for [Ca2+]nrs is that the association of NCX with RyRs is much less tight than for LTCCs (Scriven et al. 2000), with only a small fraction of NCX close to release sites. We thus set out to extract the NCX current component that is driven by [Ca2+]nrs. In this analysis we assume two functional compartments and current components: a component near release sites and a global component that is driven by cytosolic Ca2+. The measured INCX thus is the sum of INCX-nrs and NCX activated by the global cytosolic rise in Ca2+. To extract the two current components, we used the analysis illustrated in Fig. 6A. The example shows the Ca2+ transient and INCX tail measured on repolarization at two different time points.
Figure 6. NCX tail current analysis with two compartments to extract [Ca2+]nrs.
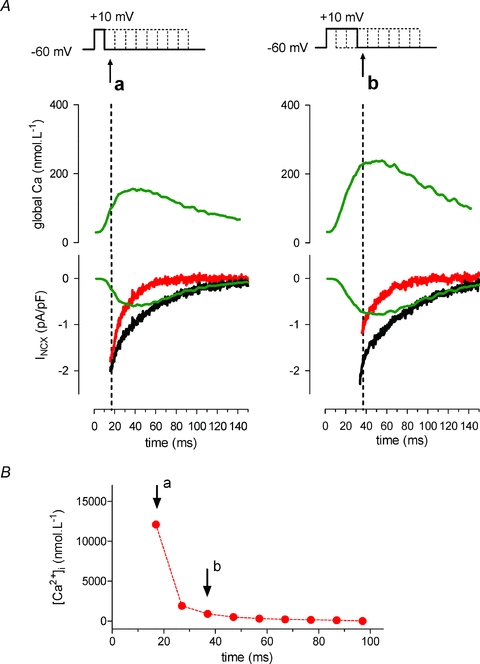
A, two recordings at 10 ms and at 30 ms into the depolarizing step are shown with the global [Ca2+]i transient and the recorded NCX tail current on repolarization (black current trace). Predicted values for NCX activated by the cytosolic Ca2+ transient are calculated using the NCX model equation of (Weber et al. 2001) (green trace). The difference current between the recorded (black trace) and calculated (green trace) then reflects NCX activated by Ca2+ near release sites and not reported by the cytosolic dye. This measurement is repeated every 10 ms. B, [Ca2+]nrs for during the example depolarizing step to +10 mV as calculated from the values of local NCX current at the corresponding time points.
We first calculated the NCX current for the cytosolic transient based on the equation of Weber et al. (2003). This equation describes the steady-state dependence of INCX on [Ca2+]i and takes into account the allosteric activation of NCX by Ca2+. We then compared this calculated NCX current to the recorded NCX current. As expected, during the upstroke of the global Ca2+ transient, we found a large discrepancy between the actually measured NCX current (black trace in the lower panel) and the calculated INCX derived from the cytosolic [Ca2+] measurements (green trace in the lower panel). Subtraction of the calculated current from the recorded current yields an ‘extra’ NCX current (red trace), reflecting activation of NCX by Ca2+ near release sites, not visible to the cytosolic Ca2+ dye reporter. We assumed that [Ca2+]nrs could thus be predicted from this ‘extra’ current. To infer the [Ca2+]nrs underlying this extra INCX, first a simple computer algorithm was applied to minimize the difference (error <0.01 pA pF−1) between the measured and calculated total NCX current. For back calculation of [Ca2+]nrs from this extra INCX, the equation has two independent variables, Vmax and Ca2+. Thus, to solve for Ca2+, we need an a priori estimation for the Vmax of NCX that reports [Ca2+]nrs (Vmax,nrs). As an estimate, we used the highest value of the extra INCX, taken at the onset of the first repolarization step. This is a constraint for the lower limit of Vmax,nrs, because the extra INCX cannot exceed the maximum capacity of NCX. Because Vmax and Ca2+ are inversely related when INCX is constant (see Weber et al. 2002), with this assumption of Vmax,nrs, we estimate the higher limit of [Ca2+] sensed by the NCX near release sites.
When we applied this type of analysis to tail currents at different time intervals, we could estimate [Ca2+]nrs during a triggered release event. For the particular example in Fig. 6, these values are shown in Fig. 6C. Fig. 7 summarizes the results from NCX tail current analysis for a depolarizing step to −10 mV and −30 mV. The amplitudes of the measured NCX tail currents (Fig. 7A, filled circles) were smaller at −30 mV as expected from the lower cytosolic Ca2+ transients (Fig. 7B, lower panels, filled circles). However, differences were less pronounced for the extra NCX current component of near release sites, particularly during early release, and there was no delay in timing at the more negative potential (Fig. 7A, open circles). Derived [Ca2+]nrs therefore was not different at the two potentials (Fig. 7B, upper panels). The earliest measurement that can be obtained in this protocol is at 10 ms, with in addition some further delay of a few ms because of the interference of the capacitance transient (not corrected in the graphs). This first time point gives the maximal values of [Ca2+]nrs with fast decline. This rate of decline is quite comparable to the time course extracted from ICaL (compare to Fig. 4D).
Figure 7. Time course of [Ca2+]nrs as estimated from the NCX tail currents.
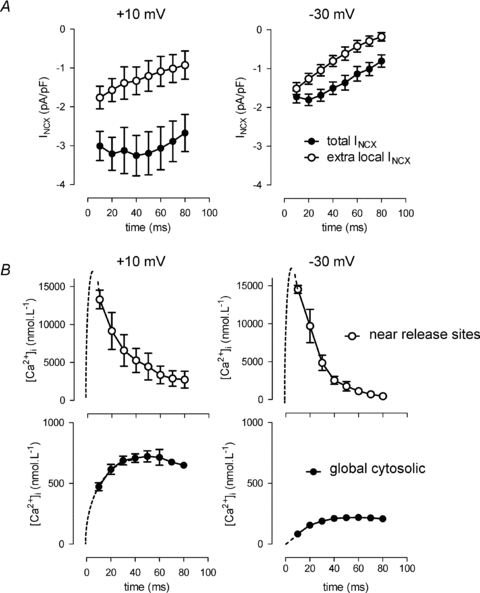
A, measured total (filled circles) NCX currents and calculated extra NCX (open circles) at +10 (n = 4) and −30 mV (n = 8). B, calculated [Ca2+]nrs (open circles) and measured global [Ca2+] (filled circles) during steps to +10 (n = 4) and −30 mV (n = 8).
Discussion
ICaL as probe for[Ca2+]nrs
The feedback of SR Ca2+ release on Ca2+ channels is well recognized as a major factor accounting for Ca2+-dependent inactivation (reviewed in Bito et al. 2008). We have previously highlighted the recovery process from this inactivation, which may be disturbed in heart failure (Sipido et al. 1995a,1998;). In contrast, in a model of compensated hypertrophy we found a well preserved recovery and postulated a role for this process in generating early afterdepolarizations, EADs (Antoons et al. 2007). We and others have highlighted how this process reflects the local [Ca2+] (Sipido et al. 1995a; Adachi Akahane et al. 1996; Altamirano & Bers, 2007a). We have now taken these studies further to examine whether we could use the process of Ca2+-dependent modulation to get to more quantitative data on [Ca2+]nrs in pig ventricular myocytes. The interest in this species is twofold, their use as pre-clinical models for complex diseases, and, from a more mechanistic point of view, their organization of calcium release units (CRUs) with fewer T-tubules and a relatively high fraction of RyRs outside couplings (Heinzel et al. 2002, 2008).
In the present study we first calculated the Ca2+ release-dependent inactivation as a difference current between ICaL traces recorded with and without SR Ca2+ release (Fig. 1). This difference current has a nadir around 10 ms, which reflects a mean or integrated values of the time of maximal SR Ca2+ release across all CRUs. This value is comparable to guinea-pig and rabbit (Shannon et al. 2000). Given that even at +10 mV not all sites are activated perfectly in synchrony, we can assume that the true local SR release flux and consequently [Ca2+]nrs in individual dyads can peak even earlier. Indeed, spike measurements in rat myocytes suggest a time to peak release of a CRU to be rather around 5 ms (Song et al. 1998). At a more negative potential of −20 mV the latency of activation of LTCCs enhances the level of dyssychrony and hence indeed we saw an average time to maximal inactivation that was significantly longer. Again, at the level of individual dyads this is likely to be equally early after RyR opening as at +10 mV. Using an interruption protocol in our second approach, we found on average a slightly later time of maximal inactivation. This most likely reflects the discontinuous nature of the measurement, and possibly also the somewhat more negative potential we have to use in this protocol. Nevertheless, both protocols correlate quite well on the level of inactivation around 20 ms and on the time course of recovery, which is rather slow at −30 mV. In contrast, at +10 mV, recovery is quite fast. The removal processes, predominantly SERCA and to some extent NCX, are unlikely to be different, suggesting that the slower recovery at negative potentials is the result of the dyssynchrony and late release events.
Deriving true Ca2+ values near release sites from the difference current relies on a calibration curve relating the fraction of open Ca2+ channels to local [Ca2+]. Using the calibration curve of Hofer et al. (1997) the values correspond well to predicted values from computational approaches. When we established our own calibration curve, however, different values were obtained. In contrast to experiments on single channels in excised patches, we only rarely observed a degree of inactivation exceeding 50% of available channels in our experiments. Thus direct calibration of our data would imply that [Ca2+]nrs stays below a few μmol l−1. A possible explanation is that the ‘on’ rate of Ca2+ binding is limiting and in the absence of a steady state, the calibration curve is not valid. This has been argued against based on the time constant of inactivation, which is quite fast (Shannon et al. 2004). Another possibility is that the number of channels exposed to [Ca2+]nrs is only a fraction of the total current and thus we should correct for this when we use the fractional inactivation to derive local Ca2+. At present there are few data that address this question. In rat, LTCC outside couplons are assumed to be rare (Scriven et al. 2000), but this may be species dependent. Lastly, our calibration procedure did not achieve very high Ca2+ values, and thus carries a degree of uncertainty in the maximal values. Experimentally, this is, however, the best that can be achieved in an intact cell system with normal Ca2+ fluxes. As the data could be well fitted with Michaelis–Menten kinetics, this suggests saturation was reached (this is also supported by the data in Fig. 1 where the increase in inactivation between pulse 3 and 4 is much less than between 1 and 2). Yet, the hypothesis that the lower values reflect true values can be rejected since we get much higher values based on NCX as reporter. This suggests that maybe indeed a significant number of Ca2+ channels are not facing [Ca2+]nrs. This may be a particular feature of pig ventricular myocytes.
NCX as a probe for [Ca2+]nrs
NCX current as a reporter for near-membrane Ca2+ is much more established than ICaL (Trafford et al. 1995; Weber et al. 2002). As a comparison to earlier data we first recalculated cytosolic Ca2+ levels by calibration of the global NCX current. When we compare these data to the data obtained in the rabbit (Weber et al. 2002), Ca2+ values in the pig are substantially lower and also slower in rate of rise. This approach, however, doesn't take into account subcompartments of NCX, near to or more remote from release sites. In modelling approaches two, three or four compartments have been implemented (Faber & Rudy, 2000; Shannon et al. 2004; Sher et al. 2007). In the experimental approach described here, we consider only two compartments, one that is in equilibrium with the global cytosolic Ca2+ concentration and one that is not in equilibrium with the cytosol during fast changes in Ca2+, and is thus the fraction that is near the release sites. Our approach to derive the fraction of NCX in non-equilibrium is thus a variable, functional parameter, which becomes 0 near the end of the Ca2+ transient when there is no gradient any more. During the early phase of the transient, it may be close to the physical fraction of NCX that is within and close to the dyad. These values varied between 10 and 15% of the total during the early phase of a pulse to +10 mV and are in general agreement with preliminary estimates from co-localization studies in pig myocytes (Moore et al. unpublished).
The values for [Ca2+]nrs obtained from NCX are comparable to what is obtained from the LTCC difference current with the higher assumed Kd. As with the calibration of LTCCs, several caveats exist. In this case we can underestimate the true Vmax of NCX and consequently as well the Vmax of the fraction near release sites. Small increases in Vmax,nrs lead to drastic changes in [Ca2+]nrs because of the non-linear nature of the calibration curve in this range. A second consideration is that we have a discontinuous measurement. Our first measurement is at 10 ms within the depolarizing step, and we can only measure the declining phase. It is possible that this is the first point, as it corresponds to the time point of maximal LTCC inactivation, but this is currently unproven. If NCX has a faster response time, and we can sample faster, we could measure earlier and higher [Ca2+]nrs, as can be explored in computational approaches (Livshitz et al. submitted). In contrast to uncertainty regarding timing of the maximal value of [Ca2+]nrs, the experimentally derived time course of the declining phase of [Ca2+]nrs is clear and is actually quite comparable to the time course of LTCC-derived values.
New insights into microdomain Ca2+ signals
We have shown that both ICaL inactivation, using two different methods, and INCX activation can be used to report dynamic changes of [Ca2+]nrs. Within the limitations of current calibrations, absolute values obtained by these different methods are within the same range, suggesting that they are reporting on a similar functional compartment near ryanodine receptors. Of note, this is valid in the approach where only a fractional component of NCX current was used, in line with colocalization experiments that place only a fraction of NCX molecules near ryanodine receptors.
Both measurements indicate the early and fast rise of [Ca2+]nrs as well as fast dissipation of the gradient. Using ICaL as reporter, maximal [Ca2+]nrs that is apparently achieved at +10 mV is not higher than what is achieved at −20 mV. Given that the fractional inactivation of ICaL is similar, this is independent of calibration. It is known that at −20 mV a lower number of Ca2+ channels are opening, but these channels are activating RyRs with a gain that is at least as high as at +10 mV. A straightforward interpretation of our results is then that within the population of open channels a similar fraction (if a lower absolute number) is facing RyRs and indeed [Ca2+]nrs is equally high.
This is also seen with NCX as reporter. A striking observations is that, as for LTCC as reporter, we obtained values for [Ca2+]nrs during a step to +10 mV that are quite comparable to what is obtained at the lower potential. This further supports the idea that we are looking at [Ca2+]nrs near active release sites, and the only difference between the two potentials is the number of locations within the cells where the high [Ca2+]nrs exists. It also supports the concept that both NCX, when analysed to its component near release sites, and LTCC are reporting the same events.
In conclusion, both LTCCs and NCX can be used as reporters, each with strengths and limitations, together providing a robust view of the short-lived [Ca2+]nrs signal. Maximal values of [Ca2+]nrs were quite similar at different potentials suggesting that even when the number of release sites is different, local gradients at release sites can reach similar values.
Acknowledgments
This study was funded by grants from the Belgian Science Policy Program P6/31 and from the European Community's Seventh Framework Program FP7/2007-2013 under grant agreement no HEALTH-F2-2009-241526, EUTrigTreat (to K.R.S.), and was supported by the Fondation Leducq Award to the Alliance for Calmodulin Kinase Signalling in Heart Disease (to K.R.S. and Y.R.). Additional support was provided by NIH-NHLBI Grants R01-HL049054-18 and R01-HLR01033343-26, and NSF Grant CBET-0929633 (to Y.R.). The authors thank Dr. Ed Moore, University of British Columbia, Vancouver, for sharing his preliminary data on localization of NCX.
Glossary
Abbreviations
- [Ca2+]nrs
[Ca2+] near release sites
- ICaL
L-type Ca2+ current
- INCX
current through Na+/Ca2+ exchanger
- LTCC
L-type Ca2+ channel
- NCX
Na+/Ca2+ exchanger
- RyR
ryanodine receptor
- SR
sarcoplasmic reticulum
Author contributions
KA performed experiments and data analysis and participated in manuscript writing. KA developed the computational methods together with LL and YR. GA performed experiments, analysis and participated in writing. LL and YR participated in data analysis, provided the theoretical basis for the computations, and contributed to manuscript writing. KS contributed the experimental study design and final manuscript writing. All authors approved the final version for publication. The experimental work and most of analysis and writing was carried out at the laboratory in Leuven, with additional analysis and writing done at the laboratories in Szeged and St-Louis.
References
- Adachi Akahane S, Cleemann L, Morad M. Cross-signaling between L-type Ca2+ channels and ryanodine receptors in rat ventricular myocytes. J Gen Physiol. 1996;108:435–454. doi: 10.1085/jgp.108.5.435. [DOI] [PMC free article] [PubMed] [Google Scholar]
- Altamirano J, Bers DM. Effect of intracellular Ca2+ and action potential duration on L-type Ca2+ channel inactivation and recovery from inactivation in rabbit cardiac myocytes. Am J Physiol Heart Circ Physiol. 2007a;293:H563–H573. doi: 10.1152/ajpheart.00469.2006. [DOI] [PubMed] [Google Scholar]
- Altamirano J, Bers DM. Voltage dependence of cardiac excitation-contraction coupling: unitary Ca2+ current amplitude and open channel probability. Circ Res. 2007b;101:590–597. doi: 10.1161/CIRCRESAHA.107.152322. [DOI] [PubMed] [Google Scholar]
- Antoons G, Mubagwa K, Nevelsteen I, Sipido KR. Mechanisms underlying the frequency dependence of contraction and [Ca2+]i transients in mouse ventricular myocytes. J Physiol. 2002;543:889–898. doi: 10.1113/jphysiol.2002.025619. [DOI] [PMC free article] [PubMed] [Google Scholar]
- Antoons G, Volders PG, Stankovicova T, Bito V, Stengl M, Vos MA, Sipido K. Window Ca2+ current and its modulation by Ca2+ release in hypertrophied cardiac myocytes from dogs with chronic atrioventricular block. J Physiol. 2007;579:147–160. doi: 10.1113/jphysiol.2006.124222. [DOI] [PMC free article] [PubMed] [Google Scholar]
- Bers DM. Cardiac excitation-contraction coupling. Nature. 2002;415:198–205. doi: 10.1038/415198a. [DOI] [PubMed] [Google Scholar]
- Bito V, Heinzel FR, Biesmans L, Antoons G, Sipido KR. Crosstalk between L-type Ca2+ channels and the sarcoplasmic reticulum: alterations during cardiac remodelling. Cardiovasc Res. 2008;77:315–324. doi: 10.1093/cvr/cvm063. [DOI] [PubMed] [Google Scholar]
- Cannell MB, Cheng H, Lederer WJ. The control of calcium release in heart muscle. Science. 1995;268:1045–1049. doi: 10.1126/science.7754384. [DOI] [PubMed] [Google Scholar]
- Couchonnal LF, Anderson ME. The role of calmodulin kinase II in myocardial physiology and disease. Physiology (Bethesda) 2008;23:151–159. doi: 10.1152/physiol.00043.2007. [DOI] [PubMed] [Google Scholar]
- de Leon M, Wang Y, Jones L, Perez Reyes E, Wei X, Soong TW, Snutch TP, Yue DT. Essential Ca2+-binding motif for Ca2+-sensitive inactivation of L-type Ca2+ channels. Science. 1995;270:1502–1506. doi: 10.1126/science.270.5241.1502. [DOI] [PubMed] [Google Scholar]
- Drummond GB. Reporting ethical matters in The Journal of Physiology: standards and advice. J Physiol. 2009;587:713–719. doi: 10.1113/jphysiol.2008.167387. [DOI] [PMC free article] [PubMed] [Google Scholar]
- Egan TM, Noble D, Noble SJ, Powell T, Spindler AJ, Twist VW. Sodium-calcium exchange during the action potential in guinea-pig ventricular cells. J Physiol. 1989;411:639–661. doi: 10.1113/jphysiol.1989.sp017596. [DOI] [PMC free article] [PubMed] [Google Scholar]
- Faber GM, Rudy Y. Action potential and contractility changes in [Na+]i overloaded cardiac myocytes: a simulation study. Biophys J. 2000;78:2392–2404. doi: 10.1016/S0006-3495(00)76783-X. [DOI] [PMC free article] [PubMed] [Google Scholar]
- Franzini-Armstrong C, Protasi F, Ramesh V. Shape, size, and distribution of Ca2+ release units and couplons in skeletal and cardiac muscles. Biophys J. 1999;77:1528–1539. doi: 10.1016/S0006-3495(99)77000-1. [DOI] [PMC free article] [PubMed] [Google Scholar]
- Heinzel FR, Bito V, Biesmans L, Wu M, Detre E, von Wegner F, Claus P, Dymarkowski S, Maes F, Bogaert J, Rademakers F, D'hooge J, Sipido KR. Remodeling of T-tubules and reduced synchrony of Ca2+ release in myocytes from chronically ischemic myocardium. Circ Res. 2008;102:338–346. doi: 10.1161/CIRCRESAHA.107.160085. [DOI] [PubMed] [Google Scholar]
- Heinzel FR, Bito V, Volders PG, Antoons G, Mubagwa K, Sipido KR. Spatial and temporal inhomogeneities during Ca2+ release from the sarcoplasmic reticulum in pig ventricular myocytes. Circ Res. 2002;91:1023–1030. doi: 10.1161/01.res.0000045940.67060.dd. [DOI] [PubMed] [Google Scholar]
- Hofer GF, Hohenthanner K, Baumgartner W, Groschner K, Klugbauer N, Hofmann F, Romanin C. Intracellular Ca2+ inactivates L-type Ca2+ channels with a Hill coefficient of approximately 1 and an inhibition constant of approximately 4 microM by reducing channel's open probability. Biophys J. 1997;73:1857–1865. doi: 10.1016/S0006-3495(97)78216-X. [DOI] [PMC free article] [PubMed] [Google Scholar]
- Langer GA, Peskoff A. Calcium concentration and movement in the diadic cleft space of the cardiac ventricular cell. Biophys J. 1996;70:1169–1182. doi: 10.1016/S0006-3495(96)79677-7. [DOI] [PMC free article] [PubMed] [Google Scholar]
- Larbig R, Torres N, Bridge JH, Goldhaber JI, Philipson KD. Activation of reverse Na+-Ca2+ exchange by the Na+ current augments the cardiac Ca2+ transient: evidence from NCX knockout mice. J Physiol. 2010;588:3267–3276. doi: 10.1113/jphysiol.2010.187708. [DOI] [PMC free article] [PubMed] [Google Scholar]
- Leblanc N, Hume JR. Sodium current-induced release of calcium from cardiac sarcoplasmic reticulum. Science. 1990;248:372–376. doi: 10.1126/science.2158146. [DOI] [PubMed] [Google Scholar]
- Lederer WJ, Niggli E, Hadley RW. Sodium-calcium exchange in excitable cells: fuzzy space. Science. 1990;248:283. doi: 10.1126/science.2326638. [DOI] [PubMed] [Google Scholar]
- Peterson BZ, Lee JS, Mulle JG, Wang Y, de Leon M, Yue DT. Critical determinants of Ca2+-dependent inactivation within an EF-hand motif of L-type Ca2+ channels. Biophys J. 2000;78:1906–1920. doi: 10.1016/S0006-3495(00)76739-7. [DOI] [PMC free article] [PubMed] [Google Scholar]
- Scriven DR, Dan P, Moore ED. Distribution of proteins implicated in excitation-contraction coupling in rat ventricular myocytes. Biophys J. 2000;79:2682–2691. doi: 10.1016/S0006-3495(00)76506-4. [DOI] [PMC free article] [PubMed] [Google Scholar]
- Shannon TR, Ginsburg KS, Bers DM. Potentiation of fractional sarcoplasmic reticulum calcium release by total and free intra-sarcoplasmic reticulum calcium concentration. Biophys J. 2000;78:334–343. doi: 10.1016/S0006-3495(00)76596-9. [DOI] [PMC free article] [PubMed] [Google Scholar]
- Shannon TR, Wang F, Puglisi J, Weber C, Bers DM. A mathematical treatment of integrated Ca dynamics within the ventricular myocyte. Biophys J. 2004;87:3351–3371. doi: 10.1529/biophysj.104.047449. [DOI] [PMC free article] [PubMed] [Google Scholar]
- Sher AA, Hinch R, Noble PJ, Gavaghan DJ, Noble D. Functional significance of Na+/Ca2+ exchangers co-localization with ryanodine receptors. Ann N Y Acad Sci. 2007;1099:215–220. doi: 10.1196/annals.1387.047. [DOI] [PubMed] [Google Scholar]
- Sipido KR, Callewaert G, Carmeliet E. Inhibition and rapid recovery of ICa during calcium release from the sarcoplasmic reticulum in guinea-pig ventricular myocytes. Circ Res. 1995a;76:102–109. doi: 10.1161/01.res.76.1.102. [DOI] [PubMed] [Google Scholar]
- Sipido KR, Carmeliet E, Pappano AJ. Na+ current and Ca2+ release from the sarcoplasmic reticulum during action potentials in guinea-pig ventricular myocytes. J Physiol. 1995b;489:1–17. doi: 10.1113/jphysiol.1995.sp021025. [DOI] [PMC free article] [PubMed] [Google Scholar]
- Sipido KR, Stankovicova T, Flameng W, Vanhaecke J, Verdonck F. Frequency dependence of Ca2+ release from the sarcoplasmic reticulum in human ventricular myocytes from end-stage heart failure. Cardiovasc Res. 1998;37:478–488. doi: 10.1016/s0008-6363(97)00280-0. [DOI] [PubMed] [Google Scholar]
- Sipido KR, Wier WG. Flux of Ca2+ across the sarcoplasmic reticulum of guinea-pig cardiac cells during excitation-contraction coupling. J Physiol. 1991;435:605–630. doi: 10.1113/jphysiol.1991.sp018528. [DOI] [PMC free article] [PubMed] [Google Scholar]
- Sobie EA, Cannell MB, Bridge JH. Allosteric activation of Na+-Ca2+ exchange by L-type Ca2+ current augments the trigger flux for SR Ca2+ release in ventricular myocytes. Biophys J. 2008;94:L54–L56. doi: 10.1529/biophysj.107.127878. [DOI] [PMC free article] [PubMed] [Google Scholar]
- Sobie EA, Ramay HR. Excitation-contraction coupling gain in ventricular myocytes: insights from a parsimonious model. J Physiol. 2009;587:1293–1299. doi: 10.1113/jphysiol.2008.163915. [DOI] [PMC free article] [PubMed] [Google Scholar]
- Soeller C, Cannell MB. Numerical simulation of local calcium movements during L-type calcium channel gating in the cardiac diad. Biophys J. 1997;73:97–111. doi: 10.1016/S0006-3495(97)78051-2. [DOI] [PMC free article] [PubMed] [Google Scholar]
- Song LS, Sham JS, Stern MD, Lakatta EG, Cheng H. Direct measurement of SR release flux by tracking ‘Ca2+ spikes’ in rat cardiac myocytes. J Physiol. 1998;512:677–691. doi: 10.1111/j.1469-7793.1998.677bd.x. [DOI] [PMC free article] [PubMed] [Google Scholar]
- Trafford AW, Diaz ME, O'Neill SC, Eisner DA. Comparison of subsarcolemmal and bulk calcium concentration during spontaneous calcium release in rat ventricular myocytes. J Physiol. 1995;488:577–586. doi: 10.1113/jphysiol.1995.sp020991. [DOI] [PMC free article] [PubMed] [Google Scholar]
- Weber CR, Ginsburg KS, Bers DM. Cardiac submembrane [Na+] transients sensed by Na+-Ca2+ exchange current. Circ Res. 2003;92:950–952. doi: 10.1161/01.RES.0000071747.61468.7F. [DOI] [PubMed] [Google Scholar]
- Weber CR, Ginsburg KS, Philipson KD, Shannon TR, Bers DM. Allosteric regulation of Na/Ca exchange current by cytosolic Ca in intact cardiac myocytes. J Gen Physiol. 2001;117:119–132. doi: 10.1085/jgp.117.2.119. [DOI] [PMC free article] [PubMed] [Google Scholar]
- Weber CR, Piacentino V, Ginsburg KS, Houser SR, Bers DM. Na+-Ca2+ exchange current and submembrane [Ca2+] during the cardiac action potential. Circ Res. 2002;90:182–189. doi: 10.1161/hh0202.103940. [DOI] [PubMed] [Google Scholar]
- Wier WG, Egan TM, Lopez-Lopez JR, Balke CW. Local control of excitation-contraction coupling in rat heart cells. J Physiol. 1994;474:463–471. doi: 10.1113/jphysiol.1994.sp020037. [DOI] [PMC free article] [PubMed] [Google Scholar]
- Zahradnikova A, Kubalova Z, Pavelkova J, Gyorke S, Zahradnik I. Activation of calcium release assessed by calcium release-induced inactivation of calcium current in rat cardiac myocytes. Am J Physiol Cell Physiol. 2004;286:C330–C341. doi: 10.1152/ajpcell.00272.2003. [DOI] [PubMed] [Google Scholar]