

Abstract
Cytochrome P450 2A6 (CYP2A6) is the primary catalyst of nicotine metabolism. To develop a predictive genetic model of nicotine metabolism, the conversion of deuterated (D2)-nicotine to D2-cotinine was quantified in 189 European Americans and the contribution of CYP2A6 genotype to variability in first-pass nicotine metabolism was assessed. Specifically, 1) single time-point measures of D2-cotinine/(D2-cotinine + D2-nicotine) following oral administration were used as a metric of CYP2A6 activity; 2) the impact of CYP2A6 haplotype was treated as acting multiplicatively; 3) parameter estimates were calculated for all haplotypes in the subject pool, defined by a set of polymorphisms previously reported to affect function, including gene copy number; and 4) a minimum number of predictive polymorphisms are justified to be included in the model based on statistical evidence of differences between haplotypes. The final model includes seven polymorphisms and fits the phenotype, 30 minutes following D2-nicotine oral administration, with R2=0.719. The predictive power of the model is robust: parameter estimates calculated in men (n=89) predict the phenotype in women (n=100) with R2=0.758 and vice versa with R2=0.617; estimates calculated in current smokers (n=102) predict phenotype in former smokers (n=86) with R2=0.690 and vice versa with R2=0.703. Comparisons of haplotypes also demonstrate that CYP2A6*12 is a loss of function allele indistinguishable from CYP2A6*4 and CYP2A6*2 and that the CYP2A6*1B 5′ UTR conversion has negligible impact on metabolism. After controlling for CYP2A6 genotype modest associations were found between increased metabolism and both female gender (p= 4.8×10⁻⁴) and current smoking (p=0.02).
Keywords: CYP2A6, nicotine metabolism, cotinine
Introduction
A primary goal of genetic studies of smoking behavior is to identify biological pathways that modulate nicotine consumption and contribute to the development of nicotine dependence. Loci identified as associated with these complex phenotypes include the direct targets of nicotine in the central nervous system, nicotinic receptor subunits[1, 2] and genes involved in the metabolism and clearance of nicotine. Because the psychoactive properties of nicotine closely correlate with its plasma concentration, dependent smokers may titrate nicotine intake and smoking behavior to maintain target nicotine blood levels [3]. For example: dependent smokers given a lower nicotine cigarette than their usual brand inhale more deeply to achieve their typical dose [4]and smokers asked to decrease their cigarette consumption reduce their cigarettes per day (CPD) but increase their intake of nicotine per cigarette [5]. These observations underlie current theories to explain the differences in CPD and craving between fast and slow nicotine metabolizers [6].
The primary pathway of nicotine metabolism is CYP2A6-catalyzed 5′-oxidation [7]. The product of this reaction is further oxidized, either by CYP2A6 or aldehyde oxidase, to cotinine [7, 8]. In most smokers, the conversion of nicotine to cotinine accounts for greater than 75% of nicotine metabolism. Cotinine is the most abundant nicotine metabolite in smokers’ plasma; nicotine is typically present at concentrations 10 to 20 times lower than those of cotinine due to its relatively short half-life [7]. The major metabolite of cotinine is trans 3′-hydroxycotinine, and CYP2A6 is also the primary catalyst of this reaction [9, 10]. Individuals who are homozygous for CYP2A6 deletion alleles (*4/*4), excrete much reduced levels of cotinine and trans 3′-hydroxycotinine [11, 12]. The ratio of trans 3′-hydroxycotinine to cotinine has been used as a proxy for CYP2A6 activity [13, 14]and is correlated with oral nicotine clearance [15].
In a number of studies, variation in nicotine metabolism and CYP2A6 genotype have been associated with variation in smoking phenotypes [13, 16]. Polymorphisms are common in nicotine metabolism genes, although only a minority of the known variants have been fully characterized [17]. Recent studies have provided strong evidence for an association between cigarette consumption and CYP2A6 genotype in multiple populations[6, 16, 18]. Several polymorphisms in CYP2A6 are associated with lower smoking intensity; these include CYP2A6 *4, CYP2A6*2, an inactivation point mutation, CYP2A6*9, which alters the TATA box promoter region, and CYP2A6*12, a hybrid CYP2A6/CYP2A7 allele [19].
CYP2A6 polymorphisms have also been shown to influence the pharmacokinetics of nicotine. This was clearly demonstrated in a study using intravenous infusion of D2-nicotine in carriers of the CYP2A6 *4, *2, *9, and *12 alleles [15]. However, the portion of variability in nicotine clearance explained by these alleles and a duplication allele associated with faster metabolism, was only 10% [20]. In addition, significant variation in nicotine clearance and in the trans 3′-hydroxycotinine to cotinine ratio exists in individuals identified as wild type [13, 15]. Taken together these data suggest that other as yet uncharacterized polymorphisms in CYP2A6 or other genes may contribute to nicotine metabolism and clearance. To accurately access the role of individual polymorphisms in nicotine metabolism it would be useful to develop a predictive model to transform genotype into a quantitative measure of relative enzyme activity.
In this study we use a single oral dose of [3′,3′]-D2-nicotine, similar to that used previously by Dempsey et al. [14]to establish the relationship between CYP2A6 genotype and oral nicotine metabolism. Plasma concentrations of nicotine and its metabolites, and nicotine metabolite ratios are used as metrics of CYP2A6 activity. The metabolism of oral nicotine occurs predominantly in the liver and CYP2A6 is the primary hepatic catalyst of nicotine metabolism. Therefore, quantifying the conversion of nicotine to cotinine should allow the direct characterization of the impact of CYP2A6 genotype on nicotine 5′-oxidation. Administration of D2-nicotine and assessment of its metabolism in 189 European Americans, both current smokers and former-smokers, allowed us to confirm the functional significance of some CYP2A6 polymorphisms and redefine others. Relative nicotine metabolism was used to estimate parameters for each haplotype and a robust genetic model of CYP2A6-catalyzed metabolism was developed. This model, defining CYP2A6 genotype as a quantitative measure of enzyme activity, may be further applied to the study of CYP2A6 genotype and smoking behavior.
Materials and methods
Study Subjects
Participants were recruited from the Collaborative Genetic Study of Nicotine Dependence (COGEND), a multi-site project in the United States [1]. Potential subjects were excluded from participation if they reported regularly using psychotropic medications (e.g., paroxetine, fluoxetine, nortriptyline, sertraline, heloperidol, olanzepine, risperidone, quetiapine, diazepam, valproate, lithium), systemic steroids, antihistamines, or cimitidene. Oral contraceptive use was not determined. All subjects were self-identified as being of European ancestry and between 27 and 44 years of age. Self-reported race was previously verified using EIGENSTRAT [2]. Current smoking status was defined by a mean non-deuterated cotinine measurement of >2 ng/ml. The relatively low cut-point was chosen to exclude all individuals who reported smoking in the previous week. One male subject currently using a nicotine patch was excluded from all analyses of smoking status. Results for all analyses of smoking status did not differ using a more stringent definition (mean D0-cotinine > 20 ng/ml). Subject characteristics are summarized in Supplemental Table 1. All subjects were requested not to consume food, and especially grapefruit and grapefruit juice, for 12h prior to their visit. Subjects were not asked to abstain from smoking except between their arrival and the first blood draw, 30 minutes after D2-nicotine administration. The time of last cigarette smoked was recorded for each subject.
Subjects were given 2 mg of [3′,3′-D2] nicotine (synthesized and purified to >99.4 % as described previously [21]) in 4 oz of juice, and blood was drawn approximately 30, 150, and 240 minutes later. This dose is well tolerated by non-smokers and results in measurable plasma nicotine concentrations[14]. All but 9 subjects were administered D2-nicotine prior to noon, the majority between 8 AM and 10 AM. The observed difference in plasma D2-cotinine at 30 min (Table 2) was not affected by the time of D2-nicotine administration. Plasma was collected and frozen at −20°C until analysis. The study complies with the Code of Ethics of the World Medical Association and obtained informed consent from participants and approval from the appropriate institutional review boards.
Table 2.
Plasma Concentrations of D2-nicotine, D2-cotinine, D2-3OH-cotinine, D0-cotinine, and D0-3OH-cotinine
| D2-nicotine | D2-cotinine | D2-3OH-cotinineb | D0-3OH-cotininec | mean D0-cotinined | |||||
|---|---|---|---|---|---|---|---|---|---|
| 30 min | 150 min | 240 min | 30 min | 150 min | 240min | 240 min | 240 min | ||
| All Subjects (189) | 1.9±1.1 | 1.4±1.0 | 0.8±0.6 | 12.7±7.2 | 24.5±7.0 | 23.7±6.8 | 2.6±1.8 | ||
| Males (89) | 1.8±0.9 | 1.4±0.8 | 0.8±0.5 | 10.3±5.3 | 20.8±5.5 | 20.2±5.5 | 1.8±1.7 | ||
| Females (100) | 2.1±1.3 | 1.5±1.1 | 0.8±0.7 | 14.8±8.0 | 27.9±6.5 | 26.8±6.4 | 3.3±1.9 | ||
|
Current smokerse
|
|||||||||
| All (102) | 2.0±1.1 | 1.4±0.9 | 0.8±0.6 | 14.2±7.4* | 24.1±6.9 | 23.0±7.3 | 2.6±1.9 | 107±67 | 331±183 |
| Male (52) | 1.7±0.9 | 1.2±0.7 | 0.7±0.5 | 11.1±5.0 | 20.6±5.4 | 19.7±5.8 | 2.0±1.3 | 111±75 | 353±198 |
| Female (50) | 2.3±1.3 | 1.5±1.1 | 0.9±0.7 | 17.5±8.1** | 27.9±6.4 | 26.5±7.1 | 3.3±2.1 | 103±59 | 309 ±166 |
|
Non-current smokers
|
|||||||||
| All (86) | 1.8±1.1 | 1.5±1.0 | 0.9±0.6 | 10.9±6.5* | 25.0±7.1 | 24.6±6.2 | 2.6±1.7 | 0.3±0.3 | |
| Male (36) | 1.8±0.9 | 1.6±0.8 | 0.9±0.5 | 9.3±5.6 | 21.0±5.7 | 21.0±5.1 | 1.6±0.9 | 0.3±0.3 | |
| Female (50) | 1.8±1.2 | 1.4±1.1 | 0.8±0.6 | 12.0±6.9** | 28.0±6.6 | 27.1±5.7 | 3.3±1.7 | 0.4±0.3 | |
Plasma was collected 30, 150, and 240 min following the administration of deuterated nicotine (D2-nicotine) and analyzed by LC/MS/MS. Values are expressed as means ± standard deviation in ng/ml.
[4′,4′-D2]-trans 3′hydroxycotinine (D2-3OH-cotinine)
trans 3′-hydroxycotinine (D0-3OH-cotinine)(n=85)
The mean of all three timepoints was calculated for each subject; Limit of quantitation = 0.2 ng/ml.
Current smokers includes all subjects with mean undeuterated cotinine > 2 ng/ml, excluding one subject using the nicotine patch.
current smokers vs. non-current smokers, p = 0.0015
female current smokers vs. female non-current smokers, p = 0.0005
Nicotine, Cotinine and Hydroxycotinine Analysis
D2-nicotine, D2-cotinine, D2-trans-3′-hydroxycotinine, non-deuterated (D0)-cotinine and D0-trans-3′-hydroxycotinine were analyzed by liquid chromatography tandem mass spectrometry (LC/MS/MS) by modification of a previously described method[21]. Changes to the method included: the addition of D9-trans-3′-hydroxycotinine (a gift from Dr, Peyton Jacob, University of California, San Francisco) to the plasma samples as an internal standard and elution of the solid phase extraction column with methanol containing 2% ammonium hydroxide (MeOH/base). An aliquot was removed for nicotine analysis and the remainder was evaporated to dryness, and resuspended in 1/10th the volume of MeOH/base for cotinine and trans 3′-hydroxycotinine analysis. LC/MS/MS for nicotine was as previously described [21], whereas the simultaneous analysis of cotinine and trans 3′-hydroxycotinine required a mobile phase of 95% acetonitrile, 4% water, 1% formic acid, flow rate, 20ul/min. Cotinine eluted at 2.53 min and trans 3′-hydroxycotinine eluted at 2.65min. The mass transitions monitored for D-and D9-trans-3′-hydroxycotinine were m/z 193 → 80 and m/z 202 → 84, respectively. The limits of quantitation for D2-nicotine, D2-cotinine, D2 trans 3′-hydroxycotinine were 0.25, 0.25 and 0.6 ng/ml plasma. D2-nicotine, D2-cotinine, and D0-cotinine plasma concentrations were determined for all subjects at 30, 150 and 240 min, D2 trans 3′-hydroxycotinine in all subjects at 240 min, and D0 trans-3′-hydroxycotinine in all current smokers at 240 min.
Genotyping
Subjects were initially analyzed for CYP2A6 copy number (CYP2A6*4 and CYP2A6*1X2) and genotyped for eight other polymorphisms previously reported to be common in Europeans and potentially associated with CYP2A6 mRNA expression or enzyme activity: 1) rs4803381 (−1013A/G), 2) rs61663607 (−745A/G) [22], 3) rs28399433 (−48T/G, the defining SNP in CYP2A6*9) [23], 4) rs1137115 (51A/G, V17V) [24], 5) rs28399435 (86G/A, S29N, the defining amino acid change in CYP2A6*14)[25], 6) rs2801272 (1799T/A, L160H, the defining amino acid change in CYP2A6*2)[26], 7) the large deletion resulting in the CYP2A7/CYP2A6 hybrid CYP2A6*12 [19]and 8) the 58 bp CYP2A7 gene conversion in the 3′ UTR of CYP2A6*1B [27]. Polymorphism nomenclature follows official recommendations (http://www.cypalleles.ki.se/cyp2a6.htm). A TaqMan CNV assay, Hs00010002_cn (Applied Biosytems, Foster City, CA, USA) was used to determine CYP2A6 copy number. Copy number variation was analyzed by real-time PCR using an ABI-7900 real-time PCR system. Each real-time PCR run included within-plate duplicates and an RNase P reference assay. CopyCaller v1.0 software (Applied Biosystems) was used to interpret copy number results. Individual genotypes at SNPs rs1137115 and rs28399435 had been previously determined using a custom designed array as part of a larger study[1], and were found in accord with further Sanger sequencing. Further sequencing was attempted in all subjects using primers previously reported to cover all CYP2A6 exons, as well as 2kb of the 5′ flanking region[24]. SNPs rs4803381 (−1013A/G), rs61663607 (−745A/G), and rs28399433 (−48T/G) were genotyped exclusively by Sanger sequencing. PCR assays for the *12 deletion and *1B 3′ UTR conversion also followed Haberl et al. [24]. All fragments to be sequenced were amplified under the same conditions (25μl volume containing 5x GoTaq Flexi buffer (Promega), 5x Q-Solution (Qiagen), 100μM each dNTP, 400 nM each primer, 1.25 GoTaq Polymerase (Promega); PCR profile: 94°C followed by 34 cycles of 45s at 94°C, 45s at 62° and 1 min at 72°C). DNA sequence was analyzed using Sequencher software (v4.7, Gene Codes Corp). All polymorphisms genotyped were in Hardy-Weinberg equilibrium.
Haplotype structure
A single individual determined to carry three copies of CYP2A6 was assumed to be heterozygous for a CYP2A6*1X2 duplication allele. The six individuals determined to carry only one copy of the gene were assumed to be heterozygous for a CYP2A6*4 deletion allele. Using 189 subjects and 8 variants, PHASE software predicted 11 haplotypes (Table 1). The most likely diplotypes were predicted with a probability of >0.97 for all subjects. Consistent with reported allele frequencies, homozygotes for the *1B 3′ gene conversion were also homozygous for the G allele at rs4803381 (−1013), the A allele at rs61663607 (−745), and the G allele at rs1137115 (+51) in all but one individual (n=1/20 subjects); the single exceptional individual heterozygous at all three polymorphic loci was considered a heterozygote for the *1B12 allele [24]. One heterozygote for the *1B 3′ gene conversion (n=1/81) was also a homozygote for the A alleles at both rs4803381 (−1013) and rs61663607 (−745), and a homozygote for the G allele at rs1137115 (+51) and was therefore considered a heterozygote for the *1B7 allele [24].
Table 1.
CYP2A6 Haplotype Definitions and Frequencies
| Haplotype name | rs4803381; −1013 | rs61663607; −745 | rs28399433, −48 (TATA box) | rs1137115; 51 (V17V) | rs28399435; 86 (S29N) | rs1801272; 1799 (L160H) | 5023A/G (Y351H) | 3′ gene conversion | alleles | frequency |
|---|---|---|---|---|---|---|---|---|---|---|
| *1A(+51A) | A | A | T | A | G | T | A | 57 | 15.1% | |
| *1B12 | A | A | T | A | G | T | A | + | 1 | 0.3% |
| *2 | A | A | T | A | G | A | A | 12 | 3.2% | |
| *14 | A | A | T | A | A | T | A | 15 | 4.0% | |
| *1A(+51G) | A | A | T | G | G | T | A | 2 | 0.5% | |
| *1B7 | A | A | T | G | G | T | A | + | 1 | 0.3% |
| *1H | A | G | T | G | G | T | A | 30 | 7.9% | |
| *1B | G | A | T | G | G | T | A | + | 119 | 31.5% |
| *1D | G | A | T | G | G | T | A | 99 | 26.2% | |
| *1D Y351H | G | A | T | G | G | T | G | 2 | 0.5% | |
| *9 | G | A | G | G | G | T | A | 24 | 6.3% | |
| *4 | - | - | - | - | - | - | - | 6 | 1.6% | |
| *12 | - | - | - | - | - | T | A | 9 | 2.4% | |
| *1X2 | 1 | 0.3% |
Polymorphic sites analyzed are given at the top of each column by rs number, gene position and further relevant description. 5023A/G indicates a novel polymorphism resulting in a change at amino acid 351, Tyrosine to Histidine (Y351H). Haplotype name indicates the common allele name, with the addition of differentiating *1A alleles by the polymorphism at position 51, and *1D alleles by the polymorphism at position 5,023. *4 and *1X2 alleles are assumed based on CYP2A6 copy number. “+” indicates the presence of the 5′ UTR gene conversion. “-” indicates a deleted region. Haplotypes are ordered by similarity beginning from the most 5′ polymorphism.
Only two individuals were predicted to carry the*1A haplotype defined by the presence of A alleles at both rs4803381 (−1013) and rs61663607 (−745) (n= 85 haplotypes) and the major allele G at rs1137115, consistent with the reported rarity of this haplotype [24]. This haplotype, hence referred to as *1A(51G), was considered separately from the more common *1A(51A) allele in further analyses.
Statistical Analysis
All t-tests performed were two-sided. Normality of nicotine metabolism metrics was tested using the Shapiro-Wilk test. Among subjects in the most common diplotype classes normality was further tested controlling for diplotype by using the difference from diplotype mean for each subject and applying the Shapiro-Wilk test. Stepwise regression analyses were initially performed without assumptions to determine the contributions of less-frequent CYP2A6 alleles, gender, and current smoking status to measured metabolism phenotype according to additive and multiplicative models in 189 subjects. The additive model simply treats the parameter estimate for each defined CYP2A6 haplotype in a diplotype as an equal part in the phenotype, i.e. Phenotype = haplotype1 + haplotype2. The multiplicative model determines the parameter estimate for each haplotype in the context of the full diplotype: 1 Phenotype = haplotype1 • haplotype2. Conceptually, this method may also be seen as treating the effect of each haplotype on the phenotype sequentially, assuming that the phenotype is a rough estimate of the percent of substrate metabolized. The first haplotype catalyzes conversion of a percentage of substrate to metabolite and the second haplotype acts upon the remaining substrate. For the multiplicative model we use %n1 = β0 • βH1 • βH2, where β0 corresponds to a global parameter, the intercept, and a βH parameter is identified for each defined haplotype H. The modeled phenotype, “%n1” refers to D2-nicotine/(D2-nicotine + D2-cotinine) at time point 1. This is the same as 1 –(D2-cotinine/(D2-nicotine + D2-cotinine)). The regression was performed on the log of the model: log (%n1) = log(β0) + log(βH1) + log(βH2). Use of the log-transformed parameters here is a mathematical convenience that allows the regression for the multiplicative model to be performed as additive. Under this model, log (βH) values close to zero correspond to βH parameters close to one, which corresponds to slower metabolism. The null hypothesis for these tests is that the genotype in question does not influence nicotine metabolism.
To determine parameter estimates for individual CYP2A6 haplotypes, further regression analyses were performed assuming a multiplicative effect of haplotype. Two subjects carrying rare non-synonymous polymorphisms were excluded from this analysis (see results). Two versions of this regression were performed. First, β parameters for haplotypes CYP2A6*2 and CYP2A6*4 were fixed at one (zero activity) and parameter estimates were obtained for all other haplotypes. Linear hypothesis tests were then performed on the resulting model. These were used to determine which haplotype effects are significantly different from the most common haplotype (*1B), used here as the reference haplotype. Based on these results, for the final analysis β parameters for haplotypes CYP2A6*2, CYP2A6*4, CYP2A6*12, and CYP2A6*1D-Y351H were fixed at one and the remaining haplotypes were grouped into equivalence classes corresponding to those determined significantly different and readily distinguished by genotype. In particular, three haplotype parameters were modeled: the first for CYP2A*9, the second for CYP2A6*1A(51A) and CYP2A6*1B12, and the third for the remaining six haplotypes (*1B, *1B7, *1A(51G), *1H, *1D and *1X2). To display parameter estimates intuitively in terms of relative activities in tables 6 and 7, estimates were normalized by first converting to the phenotype, D2-cotinine/(D2-nicotine + D2-cotinine), by subtracting from 1, so that an estimate of 0 corresponds to zero activity, and then divided by the converted estimate for the reference allele, *1B (0.61), in Table 6, or by the converted estimate for ‘all normal activity alleles’ (0.58) in Table 7. Upper and lower confidence intervals in tables 6 and 7, provided to demonstrate the precision of each parameter estimate, were converted and normalized following the same procedure.
Table 6.
Comparison by CYP2A6 Haplotype to Zero Activity and a Reference Allele
| Variable | n | Normalized Estimate (95% | p (≠0)b | p (≠reference)c |
|---|---|---|---|---|
| *1B | 118 | 1 (1.10 - 0.88) | < 2×10⁻¹⁶ | |
| *1D | 99 | 0.97 (1.07 - 0.85) | < 2×10⁻¹⁶ | 0.32 |
| *1A(51A) | 56 | 0.75 (0.89 - 0.57) | 3.1×10⁻¹⁰ | 4.4×10⁻⁹ |
| *1H | 30 | 0.90 (1.04 - 0.73) | 3.2×10⁻¹² | 0.056 |
| *9 | 23 | 0.65 (0.85 - 0.40) | 1.8×10⁻⁵ | 9.2×10⁻⁷ |
| *14 | 15 | 0.94 (1.08 - 0.75) | 4.2×10⁻¹¹ | 0.37 |
| *12 | 8 | 0.31 (0.67 – −0.18) | 0.19 | 1.0×10⁻⁷ |
| *1A(51G) | 2 | 1.20 (1.41 - 0.76) | 3.2×10⁻⁴ | 0.27 |
| *1D-Y351H | 2 | 0.05 (0.71 – −1.10) | 0.92 | 6.2×10⁻⁴ |
| *1X2 | 1 | 1.15 (1.39 - 0.66) | 9.10×10⁻⁴ | 0.43 |
| *1B12 | 1 | 0.98 (1.30 - 0.30) | 0.01 | 0.93 |
| *1B7 | 1 | 0.15 (1.09 – −2.51) | 0.85 | 0.92 |
| gender | 0.29 (0.42 - 0.13) | 4.8×10⁻⁴ | ||
| smokingd | 0.19 (0.33 - 0.02) | 0.03 |
Parameter estimates and confidence intervals (CI) were converted in terms of D2-cotinine/(D2-nicotine + D2-cotinine), where an estimate of 0 corresponds to zero activity, and normalized to the estimate for the most frequent allele, CYP2A6*1B.
p(≠0) is the probability that the parameter estimate is different by chance from assumed zero CYP2A6 activity, assuming CYP2A6*2 and CYP2A6*4 to be null alleles.
p(≠reference) is the probability that the parameter estimate is different by chance from the reference allele, CYP2A6*1B. The two subjects carrying unique amino acid
changes were excluded from this analysis.
Smoking = smoking status as stratified by a mean D0-cot >2ng/ml.
Table 7.
Parameter Estimates for Haplotypes Grouped in a Minimal Genotype Model
| Haplotype | n | Estimate | Normalized Estimate (95% CI)a | p (≠0)b |
|---|---|---|---|---|
| all normal activity alleles | 266 | 0.42 | 1 (1.09 - 0.89) | 1.4×10⁻¹⁰ |
| *1A(51A) and *1B12 | 57 | 0.57 | 0.74 (0.88 - 0.56) | |
| *9 | 23 | 0.65 | 0.60 (0.80 - 0.34) | 6.5×10⁻⁵ |
| Intercept | 0.56 | 0.76 (0.98 - 0.47) | 1.7×10⁻⁵ |
Parameter estimates and confidence intervals (CI) were converted in terms of D2-cotinine/(D2-nicotine + D2-cotinine), where an estimate of 0 corresponds to zero activity, and normalized to the estimate for all normal activity CYP2A6 alleles, defined as *1B, *1D, *1H, *14, *1A(51G), *1X2 and *1B7.
p(≠0) is the probability that the parameter estimate is different by chance from assumed zero CYP2A6 activity, assuming CYP2A6*2, *4, *12 and *1D-Y351H to be equivalent.
Results
CYP2A6 polymorphisms and identification of novel variants
Subjects (n=189) were analyzed for CYP2A6 copy number and genotyped for eight other polymorphisms previously reported as potentially associated with CYP2A6 mRNA expression or enzyme activity. A summary of haplotypes defined by these polymorphisms is presented in Table 1. Sequencing within CYP2A6 exons identified six additional non-synonymous SNPs in four individuals. Two individuals carried a novel coding SNP, 5023A>G (chromosome 19 position 41,351,309 GRCh37, *1D Y351H, Table 1), one individual with diplotype *1B/*12 carried the minor alleles of two SNPs, rs2644906 (4372G>A) and rs4997557 (4379C>G), resulting in the amino acid changes V292M and T294S respectively, and one *9/*1A individual carried the minor alleles of three SNPs, rs28399463 (5745A>G), rs8192730 (5750G>C) and rs6413474 (6573A>G), resulting in amino acid changes N418D, E419D and K476R respectively.
The 5023A>G SNP, results in an amino acid change tyrosine to histidine at position 351 (Y351H), predicted as ‘damaging’ by SIFT [28]and ‘probably damaging’ with a score of 1.0 by PolyPhen [29]. In the CYP2A6 crystal structure, the hydroxyl of Tyr351 interacts with a water molecule that bridges between this residue, Lys326 and Gln414. All three residues are on the surface of the protein, more than 25 angstroms away from the iron, and on the opposite side of the heme from the active site[30]. However, alteration of the residue at 351 might indirectly affect protein stability or heme coordination. The five amino acid changes in the other two individuals are predicted as ‘tolerated’ by SIFT and ‘benign’ by PolyPhen. However, two of these changes N418D and E419D, occur together in the CYP2A6*28 allele, reported to display significantly impaired enzymatic activity [31]. This allele has been previously reported only in subjects of African descent [31]. Eigenstrat analysis, however, confirmed that the individual in our study falls within the European cluster. The K476R change defines the CYP2A6*21 allele, reported in Europeans[32], and was previously reported to not significantly alter the activity of CYP2A6 in vivo [32].
Nicotine, Cotinine, and trans 3′-Hydroxycotinine measurements
Plasma concentrations are summarized in Table 2. In all subjects, the mean plasma concentration of D2-cotinine increases two-fold from 30 min to 150 min, but remains unchanged from 150 to 240 min. These data are consistent with the rapid conversion of nicotine to cotinine and the relatively long half-life of cotinine. Mean D2-cotinine and D2 trans 3′-hydroxycotinine concentrations of female subjects were significantly higher than those of male subjects at all time-points but only the difference in D2 trans 3′-hydroxycotinine remained statistically significant after controlling for weight (p=6.6×10⁻⁵, data not shown). D2-cotinine plasma concentrations 30 min following D2-nicotine oral administration were significantly higher in current smokers than in current non-smokers (p=0.0015). This difference also remained significant after excluding carriers of the *2, *4,*9 and *12 alleles (p=0.002). The difference was more pronounced among women (p=0.0005) than among men (p=0.15) and remained significant after correcting for weight. D2-nicotine, D2-cotinine, and D2-trans 3′-hydroxycotinine concentrations did not differ significantly between current smokers and non-current smokers after 150 or 240 minutes.
Relationship of nicotine metabolism to CYP2A6 diplotype
The administration of deuterated nicotine allows for direct measurement of the conversion of nicotine to its primary metabolites. Two metabolism metrics were initially calculated, the ratio of D2-cotinine: D2-nicotine and the ratio D2-cotinine: (D2-nicotine + D2-cotinine). The ratio of substrate to metabolite is conventionally normalized by log transformation for analysis. The latter metric has been previously suggested as more stable than the metabolite/substrate ratio [33, 34]and was pursued here for multiple reasons. Firstly, it does not require log-transformation for analysis. The distribution of D2-cotinine: D2-nicotine before log-transformation is skewed toward faster metabolism (Supplemental Fig.1), even after correcting for genotype (Supplemental Table 2 and Supplemental Fig.2). On the other hand, the distribution of D2-cotinine: (D2-nicotine + D2-cotinine) is skewed toward slow metabolism, typical of a phenotype influenced by a ‘gene of large effect’ (Tucker et al. 1998), consistent with the known dominance of one enzyme, CYP2A6, over nicotine’s conversion to cotinine. However, after correcting for CYP2A6 genotype, D2-cotinine: (D2-nicotine + D2-cotinine) is normally distributed for common diplotypes (Supplemental Table 2 and Supplemental Fig.2), indicating that the skew in this metric results from the allelic frequencies of the ‘gene of large effect’. In addition, because the ratio D2-cotinine: (D2-nicotine + D2-cotinine) ranges between 0 and 1 it has the advantage that it can be easily used to model possible non-additive effects of genotype (see below and methods). The ratio of 3′-trans-hydroxycotinine: cotinine is another validated probe of CYP2A6 activity and nicotine clearance, following oral nicotine administration [14]or during ad libitum smoking[13]. The distribution of D2-3′-trans-hydroxycotinine: D2-cotinine is skewed similarly to the distribution of D2-cotinine: D2-nicotine (Supplemental Fig.3). All three metrics are summarized in Table 3 for comparison in all diplotypes that occur in two or more subjects.
Table 3.
Comparison of Nicotine Metabolism Metrics by Diplotype
| Diplotype | n | D2cot/D2nicb (30 min) | log(D2cot / D2nic)c (30 min) | D2cot / (D2cot+ D2nic)d (30 min) | D23OH-cot / D2cote (240 min) |
|---|---|---|---|---|---|
| *1B/*1B | 20 | 12.0±6.0 | 2.4±0.5 | 91±4 | 0.16 ± 0.11 |
| *1H/*1B | 8 | 10.3±4.6 | 2.3±0.4 | 90±3 | 0.13 ± 0.04 |
| *14/Na | 13 | 9.3±2.7 | 2.2±0.3 | 90±3 | 0.12 ± 0.04 |
| N/Na | 97 | 10.5±6.1 | 2.2±0.3 | 89±4 | 0.13 ± 0.08 |
| *1D/*1D | 14 | 10.8±7.3 | 2.2±0.6 | 89±5 | 0.14 ± 0.09 |
| *1D/*1B | 30 | 10.8±7.6 | 2.2±0.5 | 89±5 | 0.12 ± 0.07 |
| *14/*1B | 9 | 9.0±2.4 | 2.2±0.3 | 89±3 | 0.12 ± 0.04 |
| *14/*1D | 3 | 8.6±2.3 | 2.1±0.3 | 89±3 | 0.14 ± 0.03 |
| *1H/*1D | 11 | 8.2±4.1 | 1.9±0.5 | 87±5 | 0.11 ± 0.06 |
| *1A/*1D | 11 | 6.9±1.6 | 1.9±0.2 | 87±2 | 0.18 ± 0.27 |
| *1A/*1B | 13 | 7.2±4.2 | 1.8±0.5 | 86±6 | 0.10 ± 0.04 |
| *9/*1D | 9 | 6.3±1.6 | 1.8±0.2 | 86±3 | 0.10 ± 0.02 |
| *9/*1B | 10 | 8.6±7.6 | 1.8±0.3 | 85±4 | 0.10 ± 0.05 |
| *9/Na | 20 | 7.3±5.6 | 1.8±0.3 | 85±4 | 0.10 ± 0.04 |
| *1A/Na | 33 | 6.8±3.4 | 1.8±0.4 | 85±5 | 0.12 ± 0.13 |
| *1A/*14 | 2 | 5.7±2.8 | 1.7±0.5 | 84±6 | 0.07 ± 0.04 |
| *1A/*1H | 7 | 6.2±4.4 | 1.7±0.6 | 83±7 | 0.09 ± 0.04 |
| *1A/*1A | 8 | 5.0±1.4 | 1.5±0.3 | 82±6 | 0.07 ± 0.03 |
| *12/*1D | 2 | 5.1±3.2 | 1.5±0.6 | 81±13 | 0.09 ± 0.05 |
| *4/*1B | 2 | 4.3±0.4 | 1.5±0.1 | 81±1 | 0.06 ± 0.04 |
| L/Na | 18 | 3.9±1.6 | 1.3±0.4 | 78±6 | 0.06 ± 0.03 |
| *2/*1D | 4 | 3.8±0.9 | 1.2±0.3 | 78±5 | 0.06 ± 0.03 |
| *2/*1B | 5 | 3.0±0.7 | 1.1±0.2 | 75±5 | 0.05 ± 0.01 |
| L/*1Aa | 4 | 2.4±0.2 | 0.9±0.1 | 70±2 | 0.03 ± 0.02 |
| *12/*1A | 3 | 2.3±0.3 | 0.8±0.1 | 69±2 | 0.03 ± 0.01 |
N = CYP2A6 normal metabolizer haplotypes (*1B,*1D,*1H,*14); *1A = CYP2A6*1A(51A); L = CYP2A6 putative loss-of-function haplotypes (*2, *4, *12).
Diplotypes are ordered from greatest to least by mean D2cotinine/(D2cotinine+D2nicotine) and log(D2cotinine/D2nicotine).
D2cot / D2nic = mean D2cotinine/D2nicotine ± the standard deviation 30 minutes after oral administration.
log(D2cot / D2nic) = mean log(D2cotinine/D2nicotine) ± the standard deviation 30 minutes after oral administration.
D2cot / (D2cot+D2nic) = mean percent D2cotinine/(D2cotinine+ D2nicotine) ± the standard deviation 30 minutes after oral administration.
D23OH-cot / D2cot = mean D2trans 3′-hydroxycotinine /D2cotinine ± the standard deviation 240 minutes after oral administration.
Comparison of subjects grouped by CYP2A6 diplotype using both metabolism metrics, log(D2-cotinine: D2-nicotine) and D2-cotinine: (D2-nicotine + D2-cotinine)), (Table 4) yields three primary novel findings: 1) the similarity between the CYP2A6*12 allele and the known null alleles *2 and *4; 2) the significant difference between the *1A(51A) allele and other presumed fully-functional alleles, including *1B; and 3) the similarity between the *1B allele and other alleles, notably *1D. The third finding suggests that the previously reported [27]influence of the *1B 3′ UTR conversion (Table 1) on nicotine metabolism is due overwhelmingly to the difference between *1B and *1A(51A), not the presence of the 3′ UTR conversion itself. The three slowest nicotine metabolizers measured among these 189 subjects were genotyped as *4/*12, *4/*2 and *12/*1D-Y351H (D2-cotinine: (D2-nicotine + D2-cotinine) = 28%, 34% and 44% respectively, compare to Table 3) leading to the hypothesis that the CYP2A6*12 allele might be equivalent to the two null alleles, *4 and *2 in respect to nicotine metabolism. ANOVA analysis provided no evidence of a difference between heterozygotes (excluding the three above-mentioned subjects) for the CYP2A6*12, *4 and *2 alleles (df=2, p=0.49), further evidence that CYP2A6*12 is a potential null allele. The two carriers for the novel amino-acid change, Y351H, display slow (*1H/*1D, 74%, compare to Table 3) and exceptionally slow (*12/*1D, 44%) metabolism respectively, also consistent with the amino acid change damaging enzyme efficiency, and the polymorphism occurring on the *1D rather than the *12 background.
Table 4.
Metabolism Phenotypes by CYP2A6 Diplotype
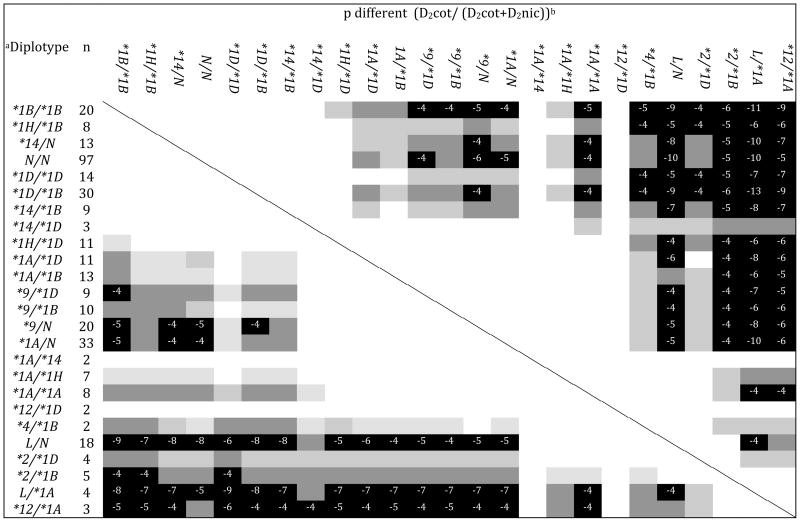
|
N = CYP2A6 normal metabolizer haplotypes (*1B,*1D,*1H, or *14); *1A = CYP2A6*1A(51A); L = CYP2A6 putative loss-of-function haplotypes (*2, *4, or *12). Diplotypes are ordered from greatest to least by mean D2cotinine/(D2cotinine+D2nicotine) and log(D2cotinine/D2nicotine) (Table 3).
p-values are for double-sided t-tests comparing D2cotinine/(D2cotinine+ D2nicotine) (lower left) or log(D2cotinine/D2nicotine) (upper right) for each pair of diplotypes. White squares are not significantly different (p>0.05). Light gray squares are significantly different with p≤0.05. Dark gray squares are significantly different with p<0.01. Black squares are significantly different with p<0.001. Numbers in black squares indicate the exponent of the p-value.
Pairwise t-tests comparing heterozygotes and homozygotes of the CYP2A6 alleles *1B, *1D, *1H and *14 provide no evidence for a significant difference between diplotypes composed of these haplotypes (Table 4, Fig. 1). Testing by ANOVA found no evidence that any of these diplotypes are different from one another (df=7, p=0.46). These four haplotypes are hence termed ‘normal metabolizer’ haplotypes. By comparison, carriers of the *1A(51A) or *9 haplotypes display significantly slower nicotine metabolism than carriers of normal metabolizer haplotypes, and significantly faster metabolism efficiency than diplotypes consisting of likely null alleles (*2, *4 and *12) (Table 4, Fig 2).
Figure 1.
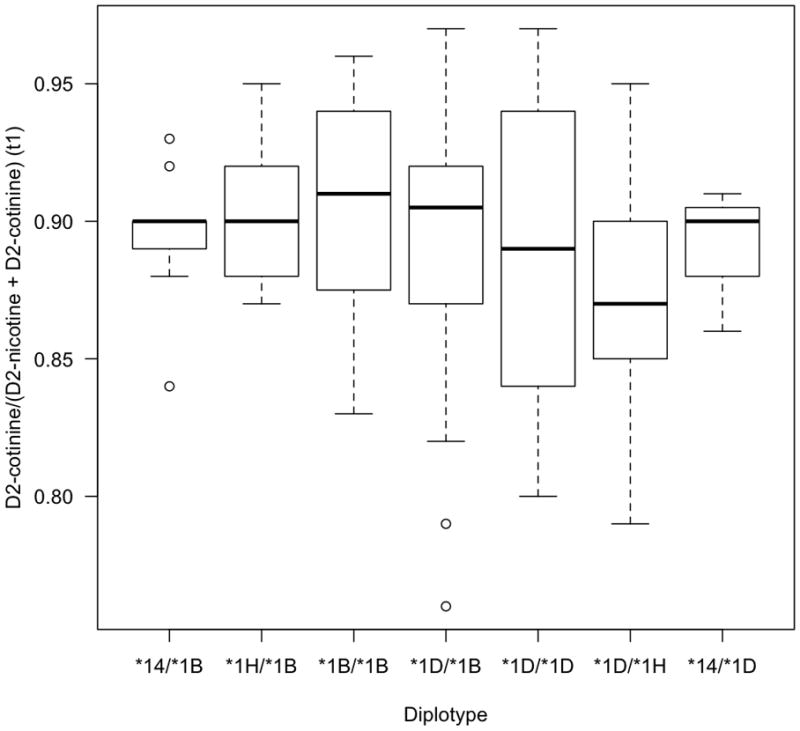
CYP2A6 diplotype/ phenotype association. Time 1 (t1) =30 min. The boxplot provides a summary of the data distribution. The box represents the interquartile range, which includes 50% of values. The line across the box indicates the median. The whisker lines extend to the highest and lowest values that are within 1.5x the interquartile range. Further outliers are marked with circles.
Figure 2.

CYP2A6 diplotype/ phenotype association among normal metabolizer alleles, CYP2A6*1B,*1D,*1H, and *14. Time 1 (t1) =30 min. The boxplot provides a summary of the data distribution. The box represents the interquartile range, which includes 50% of values. The line across the box indicates the median. The whisker lines extend to the highest and lowest values that are within 1.5x the interquartile range. Further outliers are marked with circles. N = CYP2A6 normal metabolizer haplotypes (*1B,*1D,*1H,*14); *1A = CYP2A6*1A(51A);*9 = CYP2A6*9; L = CYP2A6 putative loss-of-function haplotypes (*2, *4, *12). The N/N (n=95) group is significantly greater than the N/*1A (n=33, p=0.0001), N/*9 (n=20, p=6.1×10⁻⁵), and *1A/*1A (n=8, p=0.008) groups. The L/N (n=17) group is significantly greater than the L/*1A group (n=4, p=0.0002).
The 3′ UTR gene conversion defining the CYP2A6*1B allele is believed to stabilize the mRNA transcript, leading to higher CYP2A6 protein levels [35] and faster in vivo nicotine metabolism [27]. When we repeated the comparison based on the limited genotyping described by Mwenifumbo et al. [27](i.e. comparing *1B homozygotes to all other diplotypes excluding *1B,*2,*4,*7,*9,*10,*12 and *14 carriers) we also found a significant difference in metabolism efficiency (91% vs. 86%, p=0.0002)). However, this difference is due overwhelmingly to the *1A(51A) allele which constituted 34% (35/102) of alleles in our sample termed “*1A” by Mwenifumbo et al. according to their restricted genotyping and subject selection [27]. Based on our comparison of the *1B and *1D haplotypes (Table 4), which are identical except for the 3′ UTR conversion (Table 1 and [24]), we conclude that any effect of the 3′ UTR conversion on in vivo nicotine metabolism is negligible.
The majority of phenotypic variability following oral nicotine administration is accounted for by identified CYP2A6 polymorphisms
To determine the contributions of different CYP2A6 alleles, as well as gender and current smoking status, to variability in nicotine metabolism, linear regressions were performed to estimate the impact of different haplotypes upon both log (D2-cotinine: D2-nicotine) and D2-cotinine: (D2-nicotine + D2-cotinine) assuming an additive effect of haplotype. In addition, linear regression was performed with D2-cotinine: (D2-nicotine + D2-cotinine) treating the impact of haplotype as multiplicative. Because this metric ranges between 0 and 1 a multiplicative effect of haplotype can be easily be modeled according to the equation 1 – Phenotype = haplotype1 • haplotype2 (see methods). Non-additive effects of genotype upon metabolic ratios are well known [36] and also reflected in the distribution of the data described here (Fig. 3), i.e. the average difference in nicotine metabolism between null/normal heterozygotes and normal homozygotes is notably less than the difference between null homozygotes and null/normal heterozygotes. The multiplicative model attempts to account for this discrepancy by determining parameter estimate for each haplotype in the context of full diplotypes (see methods).
Figure 3.
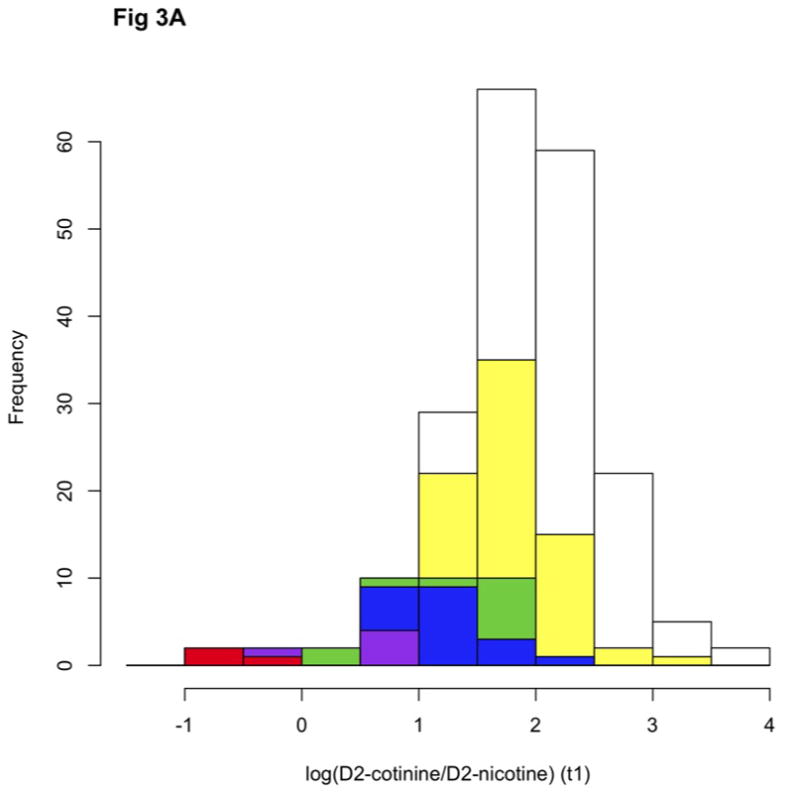

The Distribution of log(D2cotinine/D2nicotine)(A) and D2cotinine/(D2cotinine+D2nicotine) (B) measured at time1 (t1, 30 minutes) among 189 European American subjects displayed as a cumulative histogram color-coded by diplotype class. White = normal/normal, Yellow = normal/intermediate, Green = intermediate/intermediate, Blue = normal/null, Purple = intermediate/null, Red = null/null. Normal haplotypes are *1A(51G),*1B, *1D,*1H and *14. Intermediate haplotypes are *1A(51A) and *9. Null haplotypes are *1D-Y351H, *2, *4 and *12. Genotype is not further differentiated.
Optimum multivariate regression models for both metrics include the same variables, the CYP2A6 alleles *2,*4,*12,*1D-Y351H,*1A(51A), and *9, gender and current smoking status. Fitted values derived from the optimum model predicted log(D2-cotinine: D2-nicotine) in this sample with an R2 of 0.565. Fitted values derived from the optimum additive model predicted D2-cotinine: (D2-nicotine + D2-cotinine) in this sample with an adjusted R2 of 0.644, and fitted values derived from the optimum multiplicative model predicted the metric with an adjusted R2 of 0.715. Table 5 summarizes the associations with D2-cotinine: (D2-nicotine + D2-cotinine) of each variable taken individually and as part of the optimum multiplicative model. All variables included in this model were also significant predictors of D2-cotinine: (D2-nicotine + D2-cotinine) individually according to an additive model (results not shown) with the exceptions of gender and current smoking status. Current smoking status was also not a significant predictor of D2-cotinine: (D2-nicotine + D2-cotinine) according to any additive multiple regression model (results not shown), demonstrating the relative fragility of smoking status as a predictor. The *1H allele demonstrated borderline significance (p=0.054) when included in the multiplicative regression model, and was not significant as part of an additive regression model (p=0.13).
Table 5.
Adjusted R2 Values for Variables Predicting D2cotinine/(D2cotinine+ D2nicotine) Individually and when Included in the Optimum Multivariate Regression Model
| Variable | Individual Adjusted R2a | p (modeled individually)b | p (optimum model)c |
|---|---|---|---|
| *2 | 0.14 | 1.1×10⁻⁷ | 9.3×10⁻¹⁵ |
| *12 | 0.10 | 7.2×10⁻⁷ | 1.4×10⁻⁷ |
| *4 | 0.08 | 3.1×10⁻⁵ | 7.3×10⁻⁹ |
| *1A(51A) | 0.05 | 0.001 | 5.7×10⁻¹⁰ |
| *1D-Y351H | 0.03 | 0.004 | 9×10⁻⁴ |
| *9 | 0.03 | 0.01 | 4×10⁻⁷ |
| *14 | 0.006 | 0.14 | |
| *1H | 0.003 | 0.53 | |
| gender | 0.03 | 0.01 | 6×10⁻⁴ |
| smoking | 0.02 | 0.05 | 0.02 |
R2 values are provided for the association between the phenotype, D2cotinine/(D2cotinine+ D2nicotine), and each variable taken individually: eight common relatively low frequency CYP2A6 alleles, gender and smoking status.
p (modeled individually) is the probability that the variable is not a real predictor of phenotype when the variable is tested alone.
All variables that significantly predict phenotype individually (p≤0.05) are included in the optimum multivariate regression model. Fitted values derived from the optimum multiplicative model predict the phenotype with an adjusted R2 of 0.715. p (in optimum model) is the probability that the variable is not a real predictor of phenotype after taking into account the other variables in the multiplicative model. All 189 genotyped subjects were included in these initial regression analyses without distinguishing between different *1B alleles or excluding the two subjects with rare amino acid substitutions.
Comparison of nicotine metabolism phenotypes associated with CYP2A6 genotype
We took advantage of the known complete loss-of-function alleles, *2 and *4, to estimate parameters to build a model predicting phenotype by genotype. Parameter estimates for each haplotype, gender and smoking status are summarized in Table 6, as well as p-values comparing each variable to 0 (no activity) or the reference haplotype (*1B, the most common haplotype) in the multiplicative model. This model including all parameter estimates, describes the phenotype, D2-cotinine: (D2-nicotine + D2-cotinine), in the dataset with an adjusted R2 of 0.732.
D2-nicotine and its metabolites were measured 30, 150 and 240 min following oral administration. We had predicted that phenotypes would best correlate with CYP2A6 genotype at earlier time-points. To test this we repeated the above analysis with parameter estimates based on the ratio of D2-cotinine: (D2-nicotine + D2-cotinine) after 150 (R2 = 0.710 ) and 240 min (R2 = 0.417 ), as well as the ratio of (D2-trans-3′-hydroxycotinine+ D2-cotinine): (D2-nicotine + D2-cotinine + D2-trans-3′-hydroxycotinine)after 240 min (R2 = 0.554) which accounts for the metabolism of D2-cotinine to D2-trans-3′-hydroxycotinine.
The strong genotype/ phenotype correlation reported here led us to examine other validated probes of CYP2A6 activity, namely D2-trans-3′-hydroxycotinine : D2-cotinine following oral nicotine administration [14]and D0-trans-3′-hydroxycotinine : D0-cotinine during ad libitum smoking[13]. The trans-3′-hydroxycotinine: cotinine ratio was previously found significantly correlated with nicotine clearance 240 minutes following oral deuterated-nicotine administration [14]. Using the same variables as previously, the multivariate model predicts log(D2-trans-3′-hydroxycotinine : D2-cotinine) at 240 minutes with an R2 = 0.438. The ratio of D0-trans-3′-hydroxycotinine : D0-cotinine was determined in current smokers(table 2). In this sample, a multivariate model predicts log(D0-trans-3′-hydroxycotinine : D0-cotinine) with an R2 = 0.476.
A predictive model of nicotine to cotinine metabolism based on seven CYP2A6 polymorphisms
To confirm which haplotypes are different enough from one another to justify including them as separate parameters in a predictive model, all CYP2A6 haplotypes were considered in terms of their difference from zero activity, defined by the *2 and *4 alleles, and from the most common haplotype, *1B, which is assumed to represent full normal activity (Table 6). Only two haplotypes, *9 and *1A(51A), were significantly different from both zero and the reference haplotype. Therefore a minimal predictive model was constructed using the calculated parameter estimates for these two alleles based on measurements at 30 min, and setting all other alleles as equivalent to either full activity (*1B, *1D, *1H, *14, *1A(51G), *1X2 and *1B7), or no activity (*2, *4, *12 and *1D-Y351H, n=28), with the exception of *1B12 which is considered equivalent to *1A(51A) because these haplotypes are identical at all relevant nucleotides (Table 1). This model requires seven CYP2A6 polymorphisms including the deletion variant, and predicts phenotype in our sample with an R2 of 0.719. Inclusion of gender and smoking status as variables reduces the adjusted R2 marginally to 0.708, indicating the relative instability of gender and smoking status to predict metabolism in our sample. The phenotype can be predicted from the model by the equation, phenotype = 1 − (intercept • haplotype1 • haplotype2), using the parameter estimates summarized in Table 7. The estimate for the intercept is primarily driven by the three assumed null homozygotes, although the fitted parameter is based on the entire data set. The intercept represents the contribution of all other activities converting nicotine to cotinine following oral administration not accounted for by CYP2A6 (Table 7).
To validate the predictive model, subjects were stratified by gender and smoking status. Parameter estimates based on measurements at 30 min in only females predicted phenotype in male subjects (n=89) with an adjusted R2 of 0.617. Equivalent estimates based on only males predicted phenotype in female subjects (n=100) with an adjusted R2 of 0.758. Parameter estimates based on measurements at 30 min in only non-current smokers predicted phenotype in current smokers (n=102) with an adjusted R2 of 0.703, and equivalent estimates in current smokers (n=86) predicted phenotype in non-current smokers with an adjusted R2 of 0.690. The power of estimates based on each group to predict phenotype in the other also indicates that the relative influence of different CYP2A6 haplotypes do not differ between men and women or smokers and non-current smokers. To further test the stability of the model and determine whether the genotype/phenotype correlation is being dominated by outliers, the analysis was also repeated excluding the three slowest metabolizing subjects. Parameter estimates based on measurements at 30 min in all subjects predicted metabolism in the remaining subjects with an R2 of 0.550.
Discussion
Nicotine metabolism and clearance are endophenotypes associated with nicotine dependence [37, 38], and cigarette consumption [6, 16, 18]. The ability to genetically assess nicotine metabolism will allow for a more precise determination of the role of metabolism in smoking behaviors. We propose a predictive model of nicotine metabolism based on CYP2A6 genotype. The majority of variation in nicotine metabolism in the sample described was accounted for by seven polymorphisms. In addition, gender was associated with a modest induction of metabolism. Current smoking was also associated, albeit more weakly, with a modest induction of nicotine metabolism. Other unique outcomes of this study include the characterization of the CYP2A6/CYP2A7 gene conversion, CYP2A6*12, as a likely null allele statistically indistinguishable from CYP2A6*4 and *2(rs1801272 L160H), and the demonstration that the *1B 3′ UTR conversion has a negligible effect on in vivo CYP2A6 activity, once the polymorphism at position 51 (rs1137115) is taken into account.
The ratio of cotinine to 3′-trans-hydroxycotinine is a validated probe of CYP2A6 activity and nicotine clearance [14]. CYP2A6 is responsible for nearly all in vivo cotinine hydroxylation[39], while other enzymes contribute modestly to the conversion of nicotine to cotinine [40, 41]. The far longer half-lives of cotinine and 3′-trans-hydroxycotinine compared to nicotine also make their ratio a stable measure amenable to interpretation during ad libitum smoking[13]. However, neither the 3′-trans-hydroxycotinine/cotinine ratio following oral administration [14], nor the ad libitum 3′-trans-hydroxycotinine/(cotinine + nicotine) ratio [13] were previously reported to be strong enough predictors of CYP2A6 genotype to use in developing a predictive model of CYP2A6 activity. Furthermore, it is the metabolism of nicotine that is most relevant to models of smoking phenotypes. An important disadvantage of an oral nicotine administration experiment is that this is not a smoker’s typical route of absorption. However, oral nicotine metabolism has been demonstrated to be a worthwhile probe of CYP2A6 activity [14, 42] and it is not unreasonable to assert that the relative impact of different CYP2A6 alleles on first-pass metabolism is likely to translate well into their relative impact upon nicotine half-life during smoking. Indeed, the relative allele activities reported here do not substantially conflict with those determined by other in vivo protocols, and apparent differences are best explained by differences in genotyping and interpretation.
Our analyses demonstrate that the majority of variation in conversion of nicotine to cotinine in European Americans following oral administration can be predicted by relatively few CYP2A6 polymorphisms, most with obvious functional mechanisms. The survey of polymorphism presented here does not include non-coding or synonymous variants not previously indicated by the literature as relevant. Nevertheless, the strong genotype/ phenotype correlation reported indicates that most of the polymorphism significantly contributing to variation in these 189 European Americans has been identified, and further important SNPs in this ethnic population are likely to have low minor allele frequencies or small effect sizes. The polymorphism that primarily defines the *1H allele may represent such a variant with an effect size too small to be confirmed by this study.
Contrary to prior reports and in vitro evidence [27], the 3′ UTR conversion that defines the *1B allele is not a significant predictor of variation. However, a synonymous SNP in the first exon, rs1137115 (51A>G), previously reported as associated with gene expression [24], is a significant predictor. The minor allele of rs1137115 (51A) may have a direct effect on function, possibly by reducing gene expression or mRNA stability, or by altering CYP2A6 mRNA splicing. Alternatively, the minor allele may be in linkage disequilibrium with other non-coding polymorphisms that affect expression or splicing of CYP2A6; these could include rs4803381 (−1013A>G) and rs61663607 (−745A>G), although other results argue against them [22]. Lastly, rs1137115 (51A>G) may be in linkage disequilibrium with polymorphisms that affect the activity of adjacent nicotine metabolism genes, i.e. CYP2B6 and CYP2A7. Resolution of this question also has bearing on interpretation of the functional effect of the S29N polymorphism (rs28399435) that defines the *14 allele. As previously reported [24], and supported by our observations, this polymorphism is in complete linkage disequilibrium with the minor allele of rs1137115 (51A). Yet we find the activity of the *14 allele consistent with full enzymatic function, similar to previous reports [31], and significantly different from other rs1137115A (51A) haplotypes. This suggests that the minor allele of rs28399435 (86A) has lower linkage disequilibrium with the polymorphisms causing reduced efficiency of other rs1137115A (51A) alleles, or represents a compensatory change that cancels out otherwise reduced CYP2A6 activity.
Results from this study indicate that the previously reported association between the *1B allele and faster in vivo nicotine metabolism, mainly in subjects of European descent [27], is also primarily due to insufficient accounting for polymorphisms linked to rs1137115 (51A/G) rather than the impact of the *1B 3′ UTR conversion itself. When the analysis performed in that previous report is repeated, a significant difference is also found. However, this difference is overwhelmingly driven by the difference between the *1B and *1A(51A) alleles alone. Comparing only the *1B and *1D haplotypes, which are similar at all genotyped polymorphisms except the 3′ UTR [24], a statistically significant difference is not found. Another study, in African Canadians, also failed to confirm an association between *1B and faster metabolism[31]. This is likely due to a higher frequency of the *1D haplotype among African North Americans than among European North Americans ([31]and our unpublished observation).
CYP2A6*12 is a hybrid allele that consists of the 5′ flanking region and first two exons of CYP2A7, and the remaining seven exons and 3′ flanking region of CYP2A6. CYP2A7 mRNA is reported to be highly expressed, although the resulting protein has no identified enymatic activity [43]. CYP2A6*12 allele carriers were previously reported to display reduced in vivo coumarin 7-hydroxylation, and this was confirmed by cell culture experiments [19]. Although earlier publications have chosen to categorize *12 with intermediate function alleles, i.e. *9 [15, 44] regarding nicotine metabolism, they did not demonstrate a significant difference between *12 and the null alleles, *2 and *4. Our evidence suggests that *12 is more similar to *2 and *4 than to *9. These distinctions held true for all metabolism metrics tested at all time points, including the log ratios of deuterated and ad libitum 3′-trans-hydroxycotinine/cotinine. That is, parameter estimates for *12 were statistically significantly different from normal function alleles, but not from *2 and *4, whereas estimates for the *9 and *1A(51A) alleles were significantly different from both normal and *2/*4 alleles (data not shown). The designation of *12 is also consistent with recently reported evidence from at least one *12/*2 individual [45]. Our study also benefits from the fortuitous inclusion of two exceptionally slow metabolizing *12 heterozygotes, including one *12/*4 individual, and controls for genotype at rs1137115 (51A/G).
Faster nicotine clearance in women than in men has been reported previously [46–48] and our results support a modest contribution of gender to variation in nicotine metabolism. The effect of current smoking on nicotine metabolism is more controversial, with published evidence supporting both inductive [49, 50] and inhibitory effects[51]. We find an association between current smoking and faster metabolism of nicotine to cotinine (p=0.02 adjusting for CYP2A6 genotype), suggesting a slight induction of CYP2A6. Our study is the first to address this question in a relatively large sample, controlling for CYP2A6 genotype.
Nicotine clearance involves multiple enzymatic activities converting nicotine to its various metabolites, as well as renal clearance of unaltered nicotine. A genetic model of CYP2A6 function in first-pass metabolism is an important step toward also accurately predicting individual nicotine half-life by genotype. Inclusion of further polymorphisms, especially non-coding variants not yet identified as important for CYP2A6 expression or mRNA stability, will improve the model. Another source of genetic variability affecting CYP2A6 function may be regulation of CYP2A6 expression by products of other potentially polymorphic genes [52]. Other enzymes capable of converting nicotine to cotinine in vivo, including CYP2B6, may also explain a portion of the measured variation not accounted for by CYP2A6. Variability in these other genes will play a larger role in populations with a higher frequency of CYP2A6 loss-of-function alleles than in Europeans. Ethnic differences have been demonstrated in an alternate nicotine metabolism pathway, glucuronidation [53], and genetic variation in an associated enzyme impacts smoking behavior [54]. Our successful results modeling the relationship between polymorphism in a single gene and a specific metabolism endophenotype indicate that similar investigation into other genes and parallel pathways will lead to a complete predictive genetic model of nicotine metabolism.
Supplementary Material
Supplemental Table 1. Characteristics of Study Subjects
Supplemental Table 2. Normality of distributions of D2-cotinine/ (D2-nicotine + D2-cotinine) and D2-cotinine/ D2-nicotine for all diplotypes with n≥10
Supplemental Figure 1. Distribution of and D2-cotinine/ D2-nicotine in 189 Subjects
The distribution of D2-cotinine: D2-nicotine is skewed toward faster metabolism (W=0.795, p=2.4×10⁻¹⁵). t1= 30 minutes. Color-coded by diplotype class: White = normal/normal, Yellow = normal/intermediate, Green = intermediate/intermediate, Blue = normal/null, Purple = intermediate/null, Red = null/null. Normal haplotypes are *1A(51G),*1B, *1D,*1H and *14. Intermediate haplotypes are *1A(51A) and *9. Null haplotypes are *1D-Y351H, *2, *4 and *
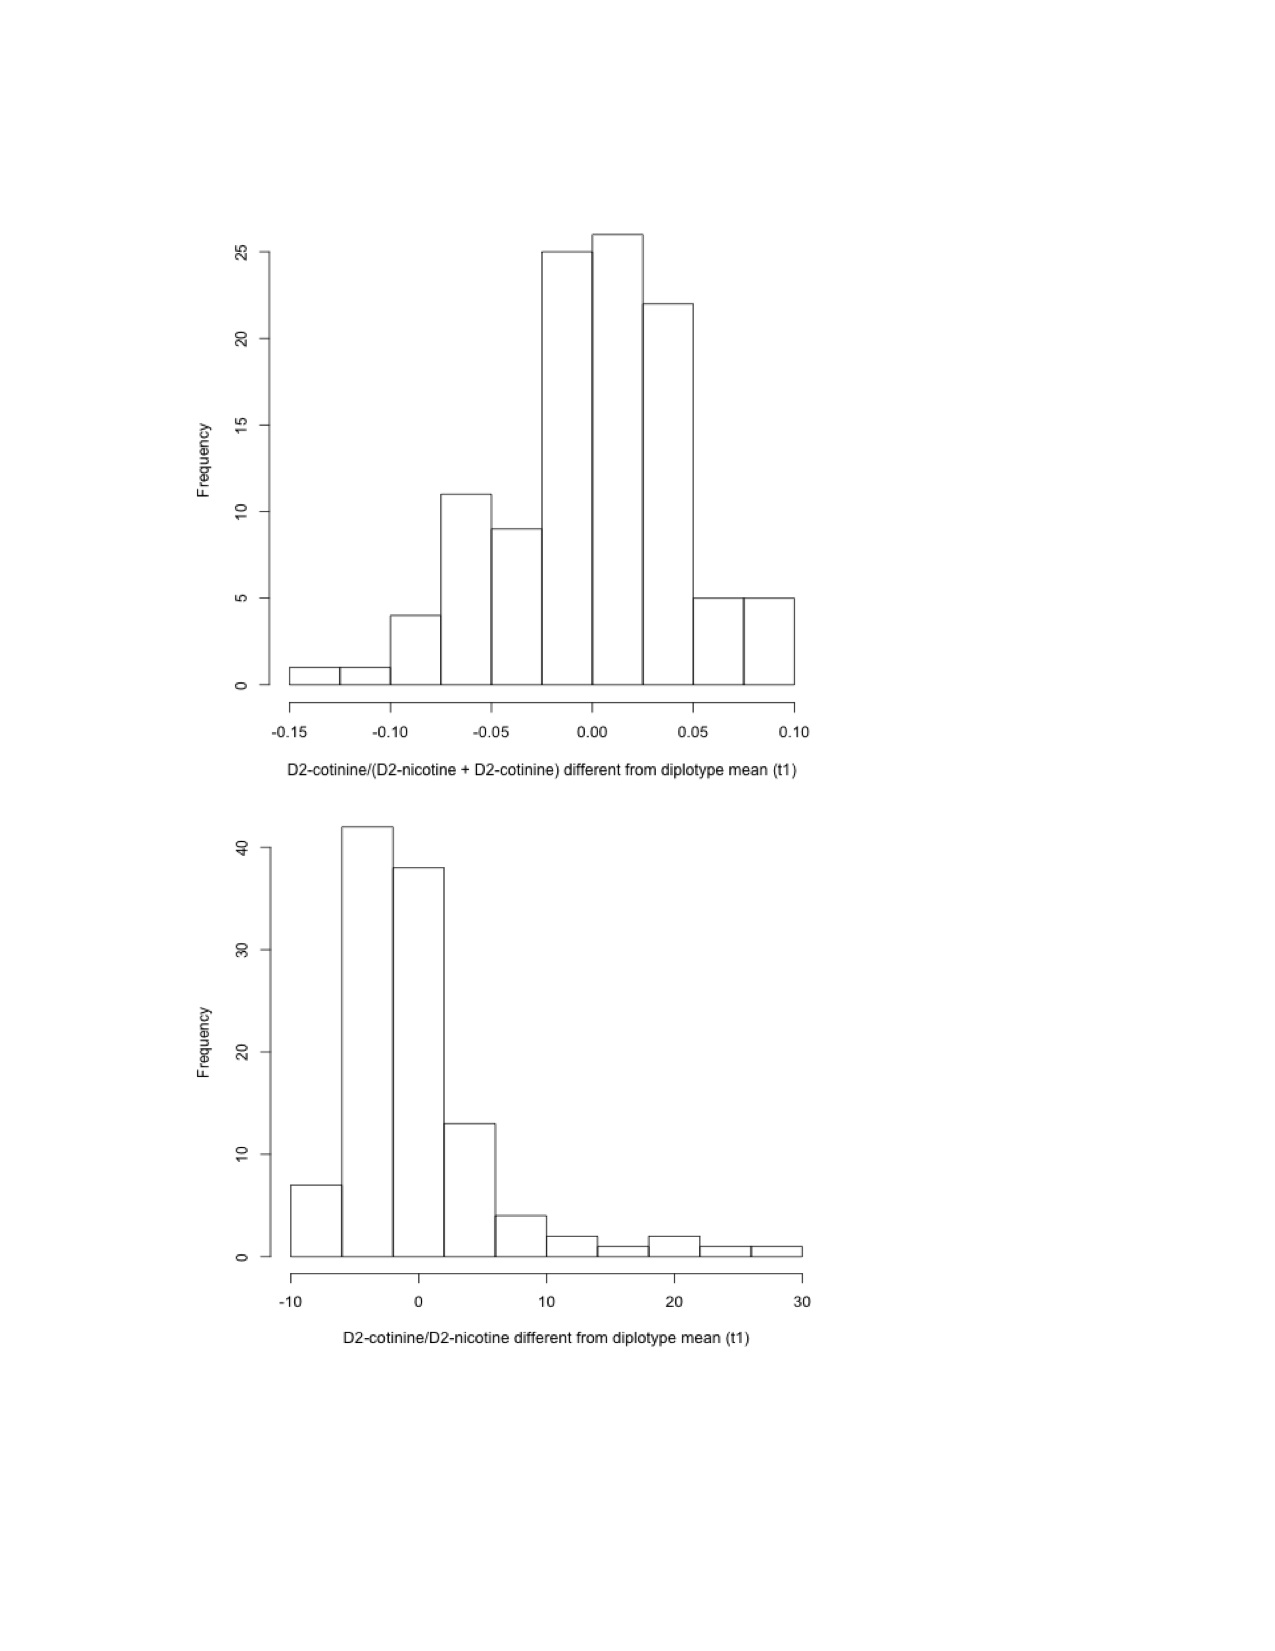
Distributions of difference from diplotype mean of D2-cotinine/ (D2-nicotine + D2-cotinine) and D2-cotinine/ D2-nicotine for all diplotypes with n≥10
Controlling for genotype by using the difference from the diplotype mean, the distribution of D2-cotinine: (D2-nicotine + D2-cotinine) among the seven most frequent diplotypes (n=109 subjects) ceases to be significantly skewed (W=0.99, p=0.29) while D2-cotinine: D2-nicotine remains skewed (W=0.77, p=7.1×10⁻¹²). This analysis suggests that the skewed distribution of D2-cotinine: (D2-nicotine + D2-cotinine) appropriately demonstrates the effect of diplotype on the phenotype, whereas the skewed distribution of D2-cotinine: D2-nicotine is an artifact of the ratio.
Distributions of D2-trans-3′-hydroxycotinine/ D2-cotinine at 240 minutes.
Color-coded by diplotype class: White = normal/normal, Yellow = normal/intermediate, Green = intermediate/intermediate, Blue = normal/null, Purple = intermediate/null, Red = null/null. Normal haplotypes are *1A(51G),*1B, *1D,*1H and *14. Intermediate haplotypes are *1A(51A) and *9. Null haplotypes are *1D-Y351H, *2, *4 and *12.
Acknowledgments
In memory of Theodore Reich, founding Principal Investigator of COGEND, we are indebted to his leadership in the establishment and nurturing of COGEND and acknowledge with great admiration his seminal scientific contributions to the field. Lead investigators directing data collection are Laura Bierut, Naomi Breslau, Dorothy Hatsukami, and Eric Johnson. The authors express their gratitude to Douglas Covey PhD for his feedback during the preparation of this manuscript. The authors thank Heidi Kromrei, Tracey Richmond, and Stephanie Afful for their assistance in data collection, John Budde, Oliver Reyes, Matthew Tyler and Lauren Westbay (Washington University) for genotyping technical assistance, and Katherine Wickham and Nicole Thomas (University of Minnesota) for assisting in the analysis of nicotine metabolites. This work was supported by the NIH grant 5 P01CA89392 from the National Cancer Institute. LC/MS/MS analysis was carried out in the Analytical Biochemistry Core of the University of Minnesota Cancer Center, supported in part by CA-77598.
Sources of support: NIH grants CA089392, CA77598, DA021237, 5T32MH014677-33, AA015572 and K24-DA00417.
Footnotes
Financial Disclosures: Drs. Hinrichs, Wang, Bierut and Goate are listed as inventors on a patent (US 20070258898) covering the use of certain SNPs in determining the diagnosis, prognosis, and treatment of addiction. Dr. Bierut has acted as a consultant for Pfizer, Inc. in 2008.
References
- 1.Bierut LJ, Madden PA, Breslau N, Johnson EO, Hatsukami D, Pomerleau OF, et al. Novel genes identified in a high-density genome wide association study for nicotine dependence. Hum Mol Genet. 2007;16:24–35. doi: 10.1093/hmg/ddl441. [DOI] [PMC free article] [PubMed] [Google Scholar]
- 2.Saccone NL, Wang JC, Breslau N, Johnson EO, Hatsukami D, Saccone SF, et al. The CHRNA5-CHRNA3-CHRNB4 nicotinic receptor subunit gene cluster affects risk for nicotine dependence in African-Americans and in European-Americans. Cancer Res. 2009;69:6848–56. doi: 10.1158/0008-5472.CAN-09-0786. [DOI] [PMC free article] [PubMed] [Google Scholar]
- 3.Jarvik ME, Madsen DC, Olmstead RE, Iwamoto-Schaap PN, Elins JL, Benowitz NL. Nicotine blood levels and subjective craving for cigarettes. Pharmacol Biochem Behav. 2000;66:553–8. doi: 10.1016/s0091-3057(00)00261-6. [DOI] [PubMed] [Google Scholar]
- 4.Strasser AA, Lerman C, Sanborn PM, Pickworth WB, Feldman EA. New lower nicotine cigarettes can produce compensatory smoking and increased carbon monoxide exposure. Drug Alcohol Depend. 2007;86:294–300. doi: 10.1016/j.drugalcdep.2006.06.017. [DOI] [PubMed] [Google Scholar]
- 5.Hatsukami DK, Lemmonds C, Zhang Y, Murphy SE, Le C, Carmella SG, et al. Evaluation of carcinogen exposure in people who used “reduced exposure” tobacco products. J Natl Cancer Inst. 2004;96:844–52. doi: 10.1093/jnci/djh163. [DOI] [PubMed] [Google Scholar]
- 6.Schoedel KA, Hoffmann EB, Rao Y, Sellers EM, Tyndale RF. Ethnic variation in CYP2A6 and association of genetically slow nicotine metabolism and smoking in adult Caucasians. Pharmacogenetics. 2004;14:615–26. doi: 10.1097/00008571-200409000-00006. [DOI] [PubMed] [Google Scholar]
- 7.Hukkanen J, Jacob P, 3rd, Benowitz NL. Metabolism and disposition kinetics of nicotine. Pharmacol Rev. 2005;57:79–115. doi: 10.1124/pr.57.1.3. [DOI] [PubMed] [Google Scholar]
- 8.von Weymarn LB, Brown KM, Murphy SE. Inactivation of CYP2A6 and CYP2A13 during nicotine metabolism. J Pharmacol Exp Ther. 2006;316:295–303. doi: 10.1124/jpet.105.091306. [DOI] [PubMed] [Google Scholar]
- 9.Nakajima M, Yamamoto T, Nunoya K, Yokoi T, Nagashima K, Inoue K, et al. Characterization of CYP2A6 involved in 3′-hydroxylation of cotinine in human liver microsomes. J Pharmacol Exp Ther. 1996;277:1010–5. [PubMed] [Google Scholar]
- 10.Brown KM, von Weymarn LB, Murphy SE. Identification of N-(hydroxymethyl) norcotinine as a major product of cytochrome P450 2A6, but not cytochrome P450 2A13-catalyzed cotinine metabolism. Chem Res Toxicol. 2005;18:1792–8. doi: 10.1021/tx0501381. [DOI] [PubMed] [Google Scholar]
- 11.Nakajima M, Yamagishi S, Yamamoto H, Yamamoto T, Kuroiwa Y, Yokoi T. Deficient cotinine formation from nicotine is attributed to the whole deletion of the CYP2A6 gene in humans. Clin Pharmacol Ther. 2000;67:57–69. doi: 10.1067/mcp.2000.103957. [DOI] [PubMed] [Google Scholar]
- 12.Zhang X, Ameno K, Ameno S, Kinoshita H, Kubota T, Kumihashi M, et al. Effects of whole deletion of CYP2A6 on nicotine metabolism in humans. Drug Chem Toxicol. 2002;25:203–13. doi: 10.1081/dct-120003260. [DOI] [PubMed] [Google Scholar]
- 13.Malaiyandi V, Goodz SD, Sellers EM, Tyndale RF. CYP2A6 genotype, phenotype, and the use of nicotine metabolites as biomarkers during ad libitum smoking. Cancer Epidemiol Biomarkers Prev. 2006;15:1812–9. doi: 10.1158/1055-9965.EPI-05-0723. [DOI] [PubMed] [Google Scholar]
- 14.Dempsey D, Tutka P, Jacob P, 3rd, Allen F, Schoedel K, Tyndale RF, et al. Nicotine metabolite ratio as an index of cytochrome P450 2A6 metabolic activity. Clin Pharmacol Ther. 2004;76:64–72. doi: 10.1016/j.clpt.2004.02.011. [DOI] [PubMed] [Google Scholar]
- 15.Benowitz NL, Swan GE, Jacob P, 3rd, Lessov-Schlaggar CN, Tyndale RF. CYP2A6 genotype and the metabolism and disposition kinetics of nicotine. Clin Pharmacol Ther. 2006;80:457–67. doi: 10.1016/j.clpt.2006.08.011. [DOI] [PubMed] [Google Scholar]
- 16.Malaiyandi V, Lerman C, Benowitz NL, Jepson C, Patterson F, Tyndale RF. Impact of CYP2A6 genotype on pretreatment smoking behaviour and nicotine levels from and usage of nicotine replacement therapy. Mol Psychiatry. 2006;11:400–9. doi: 10.1038/sj.mp.4001794. [DOI] [PubMed] [Google Scholar]
- 17.Ho MK, Tyndale RF. Overview of the pharmacogenomics of cigarette smoking. Pharmacogenomics J. 2007;7:81–98. doi: 10.1038/sj.tpj.6500436. [DOI] [PubMed] [Google Scholar]
- 18.Minematsu N, Nakamura H, Furuuchi M, Nakajima T, Takahashi S, Tateno H, et al. Limitation of cigarette consumption by CYP2A6*4, *7 and *9 polymorphisms. Eur Respir J. 2006;27:289–92. doi: 10.1183/09031936.06.00056305. [DOI] [PubMed] [Google Scholar]
- 19.Oscarson M, McLellan RA, Asp V, Ledesma M, Bernal Ruiz ML, Sinues B, et al. Characterization of a novel CYP2A7/CYP2A6 hybrid allele (CYP2A6*12) that causes reduced CYP2A6 activity. Hum Mutat. 2002;20:275–83. doi: 10.1002/humu.10126. [DOI] [PubMed] [Google Scholar]
- 20.Swan GE, Benowitz NL, Lessov CN, Jacob P, 3rd, Tyndale RF, Wilhelmsen K. Nicotine metabolism: the impact of CYP2A6 on estimates of additive genetic influence. Pharmacogenet Genomics. 2005;15:115–25. doi: 10.1097/01213011-200502000-00007. [DOI] [PubMed] [Google Scholar]
- 21.Murphy SE, Villalta P, Ho SW, von Weymarn LB. Analysis of [3′,3′-d(2)]-nicotine and [3′,3′-d(2)]-cotinine by capillary liquid chromatography-electrospray tandem mass spectrometry. J Chromatogr B Analyt Technol Biomed Life Sci. 2007;857:1–8. doi: 10.1016/j.jchromb.2007.06.018. [DOI] [PMC free article] [PubMed] [Google Scholar]
- 22.von Richter O, Pitarque M, Rodriguez-Antona C, Testa A, Mantovani R, Oscarson M, et al. Polymorphic NF-Y dependent regulation of human nicotine C-oxidase (CYP2A6) Pharmacogenetics. 2004;14:369–79. doi: 10.1097/00008571-200406000-00006. [DOI] [PubMed] [Google Scholar]
- 23.Yoshida R, Nakajima M, Nishimura K, Tokudome S, Kwon JT, Yokoi T. Effects of polymorphism in promoter region of human CYP2A6 gene (CYP2A6*9) on expression level of messenger ribonucleic acid and enzymatic activity in vivo and in vitro. Clin Pharmacol Ther. 2003;74:69–76. doi: 10.1016/S0009-9236(03)00090-0. [DOI] [PubMed] [Google Scholar]
- 24.Haberl M, Anwald B, Klein K, Weil R, Fuss C, Gepdiremen A, et al. Three haplotypes associated with CYP2A6 phenotypes in Caucasians. Pharmacogenet Genomics. 2005;15:609–24. doi: 10.1097/01.fpc.0000171517.22258.f1. [DOI] [PubMed] [Google Scholar]
- 25.Kiyotani K, Fujieda M, Yamazaki H, Shimada T, Guengerich FP, Parkinson A, et al. Twenty one novel single nucleotide polymorphisms (SNPs) of the CYP2A6 gene in Japanese and Caucasians. Drug Metab Pharmacokinet. 2002;17:482–7. doi: 10.2133/dmpk.17.482. [DOI] [PubMed] [Google Scholar]
- 26.Yamano S, Tatsuno J, Gonzalez FJ. The CYP2A3 gene product catalyzes coumarin 7-hydroxylation in human liver microsomes. Biochemistry. 1990;29:1322–9. doi: 10.1021/bi00457a031. [DOI] [PubMed] [Google Scholar]
- 27.Mwenifumbo JC, Lessov-Schlaggar CN, Zhou Q, Krasnow RE, Swan GE, Benowitz NL, et al. Identification of novel CYP2A6*1B variants: the CYP2A6*1B allele is associated with faster in vivo nicotine metabolism. Clin Pharmacol Ther. 2008;83:115–21. doi: 10.1038/sj.clpt.6100246. [DOI] [PMC free article] [PubMed] [Google Scholar]
- 28.Kumar P, Henikoff S, Ng PC. Predicting the effects of coding non-synonymous variants on protein function using the SIFT algorithm. Nat Protoc. 2009;4:1073–81. doi: 10.1038/nprot.2009.86. [DOI] [PubMed] [Google Scholar]
- 29.Sunyaev S, Ramensky V, Koch I, Lathe W, 3rd, Kondrashov AS, Bork P. Prediction of deleterious human alleles. Hum Mol Genet. 2001;10:591–7. doi: 10.1093/hmg/10.6.591. [DOI] [PubMed] [Google Scholar]
- 30.Yano JK, Hsu MH, Griffin KJ, Stout CD, Johnson EF. Structures of human microsomal cytochrome P450 2A6 complexed with coumarin and methoxsalen. Nat Struct Mol Biol. 2005;12:822–3. doi: 10.1038/nsmb971. [DOI] [PubMed] [Google Scholar]
- 31.Mwenifumbo JC, Al Koudsi N, Ho MK, Zhou Q, Hoffmann EB, Sellers EM, et al. Novel and established CYP2A6 alleles impair in vivo nicotine metabolism in a population of Black African descent. Hum Mutat. 2008;29:679–88. doi: 10.1002/humu.20698. [DOI] [PubMed] [Google Scholar]
- 32.Al Koudsi N, Mwenifumbo JC, Sellers EM, Benowitz NL, Swan GE, Tyndale RF. Characterization of the novel CYP2A6*21 allele using in vivo nicotine kinetics. Eur J Clin Pharmacol. 2006;62:481–4. doi: 10.1007/s00228-006-0113-3. [DOI] [PubMed] [Google Scholar]
- 33.Jackson PR, Tucker GT, Lennard MS, Woods HF. Polymorphic drug oxidation: pharmacokinetic basis and comparison of experimental indices. Br J Clin Pharmacol. 1986;22:541–50. doi: 10.1111/j.1365-2125.1986.tb02933.x. [DOI] [PMC free article] [PubMed] [Google Scholar]
- 34.Inaba T, Otton SV, Kalow W. Debrisoquine hydroxylation capacity: problems of assessment in two populations. Clin Pharmacol Ther. 1981;29:218–23. doi: 10.1038/clpt.1981.35. [DOI] [PubMed] [Google Scholar]
- 35.Wang J, Pitarque M, Ingelman-Sundberg M. 3′-UTR polymorphism in the human CYP2A6 gene affects mRNA stability and enzyme expression. Biochem Biophys Res Commun. 2006;340:491–7. doi: 10.1016/j.bbrc.2005.12.035. [DOI] [PubMed] [Google Scholar]
- 36.Tucker GT, Rostami-Hodjegan A, Jackson PR. Determination of drug-metabolizing enzyme activity in vivo: pharmacokinetic and statistical issues. Xenobiotica. 1998;28:1255–73. doi: 10.1080/004982598238895. [DOI] [PubMed] [Google Scholar]
- 37.Audrain-McGovern J, Al Koudsi N, Rodriguez D, Wileyto EP, Shields PG, Tyndale RF. The role of CYP2A6 in the emergence of nicotine dependence in adolescents. Pediatrics. 2007;119:e264–74. doi: 10.1542/peds.2006-1583. [DOI] [PubMed] [Google Scholar]
- 38.O’Loughlin J, Paradis G, Kim W, DiFranza J, Meshefedjian G, McMillan-Davey E, et al. Genetically decreased CYP2A6 and the risk of tobacco dependence: a prospective study of novice smokers. Tob Control. 2004;13:422–8. doi: 10.1136/tc.2003.007070. [DOI] [PMC free article] [PubMed] [Google Scholar]
- 39.Yamanaka H, Nakajima M, Nishimura K, Yoshida R, Fukami T, Katoh M, et al. Metabolic profile of nicotine in subjects whose CYP2A6 gene is deleted. Eur J Pharm Sci. 2004;22:419–25. doi: 10.1016/j.ejps.2004.04.012. [DOI] [PubMed] [Google Scholar]
- 40.Yamazaki H, Inoue K, Hashimoto M, Shimada T. Roles of CYP2A6 and CYP2B6 in nicotine C-oxidation by human liver microsomes. Arch Toxicol. 1999;73:65–70. doi: 10.1007/s002040050588. [DOI] [PubMed] [Google Scholar]
- 41.Dicke KE, Skrlin SM, Murphy SE. Nicotine and 4-(methylnitrosamino)-1-(3-pyridyl)-butanone metabolism by cytochrome P450 2B6. Drug Metab Dispos. 2005;33:1760–4. doi: 10.1124/dmd.105.006718. [DOI] [PubMed] [Google Scholar]
- 42.Nakajima M, Fukami T, Yamanaka H, Higashi E, Sakai H, Yoshida R, et al. Comprehensive evaluation of variability in nicotine metabolism and CYP2A6 polymorphic alleles in four ethnic populations. Clin Pharmacol Ther. 2006;80:282–97. doi: 10.1016/j.clpt.2006.05.012. [DOI] [PubMed] [Google Scholar]
- 43.Ding S, Lake BG, Friedberg T, Wolf CR. Expression and alternative splicing of the cytochrome P-450 CYP2A7. Biochem J. 1995;306 (Pt 1):161–6. doi: 10.1042/bj3060161. [DOI] [PMC free article] [PubMed] [Google Scholar]
- 44.Malaiyandi V, Sellers EM, Tyndale RF. Implications of CYP2A6 genetic variation for smoking behaviors and nicotine dependence. Clin Pharmacol Ther. 2005;77:145–58. doi: 10.1016/j.clpt.2004.10.011. [DOI] [PubMed] [Google Scholar]
- 45.Al Koudsi N, Hoffmann EB, Assadzadeh A, Tyndale RF. Hepatic CYP2A6 levels and nicotine metabolism: impact of genetic, physiological, environmental, and epigenetic factors. Eur J Clin Pharmacol. 2010;66:239–51. doi: 10.1007/s00228-009-0762-0. [DOI] [PMC free article] [PubMed] [Google Scholar]
- 46.Benowitz NL, Lessov-Schlaggar CN, Swan GE, Jacob P., 3rd Female sex and oral contraceptive use accelerate nicotine metabolism. Clin Pharmacol Ther. 2006;79:480–8. doi: 10.1016/j.clpt.2006.01.008. [DOI] [PubMed] [Google Scholar]
- 47.Johnstone E, Benowitz N, Cargill A, Jacob R, Hinks L, Day I, et al. Determinants of the rate of nicotine metabolism and effects on smoking behavior. Clin Pharmacol Ther. 2006;80:319–30. doi: 10.1016/j.clpt.2006.06.011. [DOI] [PubMed] [Google Scholar]
- 48.Kandel DB, Hu MC, Schaffran C, Udry JR, Benowitz NL. Urine nicotine metabolites and smoking behavior in a multiracial/multiethnic national sample of young adults. Am J Epidemiol. 2007;165:901–10. doi: 10.1093/aje/kwm010. [DOI] [PubMed] [Google Scholar]
- 49.Haley NJ, Sepkovic DW, Hoffmann D. Elimination of cotinine from body fluids: disposition in smokers and nonsmokers. Am J Public Health. 1989;79:1046–8. doi: 10.2105/ajph.79.8.1046. [DOI] [PMC free article] [PubMed] [Google Scholar]
- 50.Kyerematen GA, Morgan ML, Chattopadhyay B, deBethizy JD, Vesell ES. Disposition of nicotine and eight metabolites in smokers and nonsmokers: identification in smokers of two metabolites that are longer lived than cotinine. Clin Pharmacol Ther. 1990;48:641–51. doi: 10.1038/clpt.1990.208. [DOI] [PubMed] [Google Scholar]
- 51.Benowitz NL, Jacob P., 3rd Effects of cigarette smoking and carbon monoxide on nicotine and cotinine metabolism. Clin Pharmacol Ther. 2000;67:653–9. doi: 10.1067/mcp.2000.107086. [DOI] [PubMed] [Google Scholar]
- 52.Yokota SI, Higashi E, Fukami T, Yokoi T, Nakajima M. Human CYP2A6 is regulated by nuclear factor-erythroid 2 related factor 2. Biochem Pharmacol. 2010 doi: 10.1016/j.bcp.2010.09.020. [DOI] [PubMed] [Google Scholar]
- 53.Benowitz NL, Perez-Stable EJ, Fong I, Modin G, Herrera B, Jacob P., 3rd Ethnic differences in N-glucuronidation of nicotine and cotinine. J Pharmacol Exp Ther. 1999;291:1196–203. [PubMed] [Google Scholar]
- 54.Berg JZ, von Weymarn LB, Thompson EA, Wickham KM, Weisensel NA, Hatsukami DK, et al. UGT2B10 genotype influences nicotine glucuronidation, oxidation, and consumption. Cancer Epidemiol Biomarkers Prev. 2010;19:1423–31. doi: 10.1158/1055-9965.EPI-09-0959. [DOI] [PMC free article] [PubMed] [Google Scholar]
Associated Data
This section collects any data citations, data availability statements, or supplementary materials included in this article.
Supplementary Materials
Supplemental Table 1. Characteristics of Study Subjects
Supplemental Table 2. Normality of distributions of D2-cotinine/ (D2-nicotine + D2-cotinine) and D2-cotinine/ D2-nicotine for all diplotypes with n≥10
Supplemental Figure 1. Distribution of and D2-cotinine/ D2-nicotine in 189 Subjects
The distribution of D2-cotinine: D2-nicotine is skewed toward faster metabolism (W=0.795, p=2.4×10⁻¹⁵). t1= 30 minutes. Color-coded by diplotype class: White = normal/normal, Yellow = normal/intermediate, Green = intermediate/intermediate, Blue = normal/null, Purple = intermediate/null, Red = null/null. Normal haplotypes are *1A(51G),*1B, *1D,*1H and *14. Intermediate haplotypes are *1A(51A) and *9. Null haplotypes are *1D-Y351H, *2, *4 and *
Distributions of difference from diplotype mean of D2-cotinine/ (D2-nicotine + D2-cotinine) and D2-cotinine/ D2-nicotine for all diplotypes with n≥10
Controlling for genotype by using the difference from the diplotype mean, the distribution of D2-cotinine: (D2-nicotine + D2-cotinine) among the seven most frequent diplotypes (n=109 subjects) ceases to be significantly skewed (W=0.99, p=0.29) while D2-cotinine: D2-nicotine remains skewed (W=0.77, p=7.1×10⁻¹²). This analysis suggests that the skewed distribution of D2-cotinine: (D2-nicotine + D2-cotinine) appropriately demonstrates the effect of diplotype on the phenotype, whereas the skewed distribution of D2-cotinine: D2-nicotine is an artifact of the ratio.
Distributions of D2-trans-3′-hydroxycotinine/ D2-cotinine at 240 minutes.
Color-coded by diplotype class: White = normal/normal, Yellow = normal/intermediate, Green = intermediate/intermediate, Blue = normal/null, Purple = intermediate/null, Red = null/null. Normal haplotypes are *1A(51G),*1B, *1D,*1H and *14. Intermediate haplotypes are *1A(51A) and *9. Null haplotypes are *1D-Y351H, *2, *4 and *12.