Figure 3.

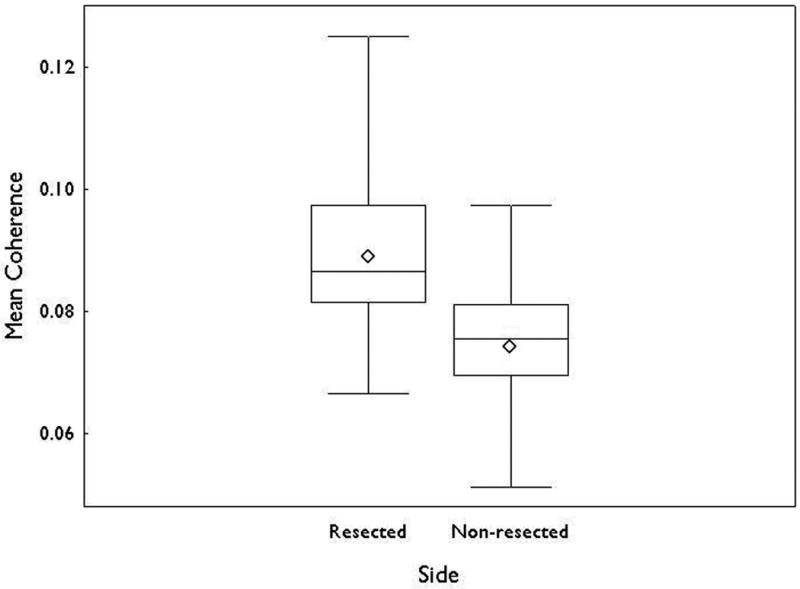
Box plots showing mean (◇), median, interquartile range and minimum and maximum values of coherence for the resected and nonresected hemispheres. The difference between the two sides was significant (p<0.001).

Box plots showing mean (◇), median, interquartile range and minimum and maximum values of coherence for the resected and nonresected hemispheres. The difference between the two sides was significant (p<0.001).