

Abstract
Background
The natural history of castration-resistant nonmetastatic prostate cancer is poorly defined.
Methods
We used data from 331 subjects in the placebo group of a randomized controlled trial to evaluate the relationships between disease and host characteristics with time to first bone metastases in men with prostate cancer, rising PSA despite androgen deprivation therapy, and no radiographic evidence of metastases. Relationships between baseline covariates and clinical outcomes were assessed by Cox proportional hazard analyses. Covariates in the model were age, body mass index, prior prostatectomy, prior orchiectomy, Gleason score, performance status, PSA, urinary N-telopeptide, bone alkaline phosphatase, albumin, lactate dehydrogenase, and hemoglobin.
Results
At 2 years, 46% of subjects had developed bone metastases and 20% had died. Median bone metastasis-free survival was 25 months. In multivariate analyses, baseline PSA ≥ 13.1 ng/mL was associated with shorter overall survival (relative risk 2.34; 95% CI 1.71, 3.21; p<0.0001), time to first bone metastasis (relative risk 1.98; 95% CI 1.43, 2.74; p<0.0001), and bone metastasis-free survival (relative risk 1.98; 95% CI 1.45, 2.70; p<0.0001). PSA velocity was significantly associated with overall and bone metastasis-free survival. Other covariates were not consistently associated with clinical outcomes.
Conclusions
In men with progressive castration-resistant prostate cancer and no detectable metastases, baseline PSA was significantly associated with time to first bone metastasis, bone metastasis-free survival, and overall survival. Other disease and host characteristics, including body mass index and bone turnover markers, were not consistently associated with clinical outcomes.
Keywords: prostate cancer, androgen deprivation therapy, bone metastases, prostate-specific antigen
Background
Men with metastatic prostate cancer and disease progression despite androgen deprivation therapy (ADT) have a poor prognosis. In contemporary clinical trials of men with progressive metastatic castration-resistant disease, for example, median survival was only 16-18 months.1,2
Changes in patterns of diagnosis and treatment have dramatically increased the number of men receiving ADT for nonmetastatic prostate cancer.3 Although nearly all of these men will eventually experience disease progression despite castrate levels of testosterone, little is known about the natural history for men with progressive castration-resistant nonmetastatic prostate cancer. In analyses of 201 men with progressive castration-resistant prostate cancer and no detectable metastases, only higher baseline PSA and PSA velocity were associated with time to first bone metastasis and death.4 Notably, these analyses were limited by the small number of covariates and lack of information about host characteristics including body mass index (BMI) and biochemical markers of bone turnover. Additionally, the study allowed other therapies, including secondary hormone therapy and chemotherapy, and study outcomes may have been influenced by these treatments.
Obesity has been implicated in worse prostate cancer outcomes for men with early stage disease. Greater BMI is associated with higher grade prostate cancer and higher rates of PSA recurrence following prostatectomy.5,6 Greater BMI is associated with higher rates of PSA failure after radiation therapy7 and shorter survival after combined modality therapy for locally advanced prostate cancer.8 The relationships between BMI and clinical outcomes in men with castration-resistant nonmetastatic disease are undefined.
Biochemical markers of osteoblast and osteoclast activity are markedly elevated in men with metastatic prostate cancer and levels correspond to extent of skeletal involvement.9,10 In men with metastatic disease, elevated serum levels of total or bone-specific alkaline phosphatase are independently associated with shorter survival.11-13 In men without bone metastases, ADT significantly increases biochemical markers of osteoblast and osteoclast activity including serum bone-specific alkaline phosphatase (BAP) and urinary excretion of N-telopeptide (NTx).14 Preclinical studies suggest that the microenvironment of actively remodeling bone contributes to the preferential spread of prostate cancer to bone15 although the relationship between biochemical markers of bone turnover and risk for bone metastases is undefined in man.
We used data from the placebo group of a previously reported international randomized controlled trial of atrasentan16 to investigate the relationships between disease and host characteristics, including BMI and biochemical markers of bone turnover, and time to first bone metastases and death in men with castration-resistant prostate cancer and no radiographically detectable metastases.
Methods
As previously reported, Abbott M00-244 was a randomized, double-blind, placebo controlled study to evaluate the effects of atrasentan on time to disease progression in men with progressive castration-resistant prostate cancer and no radiographic evidence of bone metastases.16 A total 941 subjects were enrolled in the study between July 2001 and April 2003; 467 subjects were assigned to atrasentan and 474 subjects were assigned to placebo. The current analyses evaluate the 331 subjects from the placebo group with complete baseline data.
Subjects
All subjects had prostate cancer and had undergone ADT (bilateral orchiectomy or medical castration) at least 3 months before randomization, and had castrate testosterone levels at screening. Before randomization, PSA levels were at least 20 ng/mL within 12 months, or had increased by 50% within 6 months (minimum PSA 1 ng/mL at screening), or were rising (2 sequential increases with third confirmatory rise; minimum PSA 1 ng/mL at screening) within 12 months. No subject had radiographic evidence of metastases at study entry. Subjects were also excluded if they had received prior chemotherapy, bisphosphonates, radiopharmaceuticals, or an endothelin receptor antagonist. Subjects with current cardiovascular disability (New York Heart Association class 2 or greater) were also excluded. The institutional review board or independent ethics committee at each participating site approved the protocol. Each subject gave written informed consent.
Study Design
Prior to randomization, subjects underwent screening evaluations for eligibility including bone scan and chest, abdomen, and pelvic computed tomography scans or magnetic resonance imaging scans. Absence of metastatic disease was confirmed by central independent review.
Eligible subjects were assigned randomly in a 1:1 ratio to atrasentan (10 mg by mouth daily) or matching placebo. Subjects continued ADT throughout the study. Other therapies (except for continued ADT with a gonadotropin-releasing hormone agonist) were prohibited on study. During double-blind treatment, subjects were evaluated at day 14; weeks 4, 8, and 12; and every 6 weeks thereafter. PSA and bone turnover markers were measured at weeks 4, 8 and 12, and every 12 weeks thereafter. Bone scans were performed every 12 weeks and underwent centralized independent review to assess disease progression. Study treatment continued until confirmed disease progression, unacceptable adverse effects, subject withdrawal, or study completion.
Outcomes
The main outcomes considered in these analyses were time from first dose following randomization to first documentation of bone metastasis, overall survival, and bone metastasis-free survival.
Statistical Analyses
The time to first bone metastasis was defined as the time from first dose after randomization to first positive bone scan. Subjects not observed to develop bone metastases were censored at the last available evaluation or last date of an unconfirmed report of disease progression. Univariate cause-specific Cox regression models were fit for the time to first bone metastasis using each covariate as a single explanatory variable.17 Next, multivariate models were fit using all explanatory variables to identify those that were independently predictive. Stepwise backward elimination was performed to determine the simplest multivariate model. Tests for the validity of the proportional hazards assumption were also performed.18 If there was evidence of violations to this assumption, models were expanded to allow relative risks to vary with time.
Cox regression analyses were also conducted for the survival time, defined the number of days from first dose following randomization to death, or the time from first dose following randomization to last contact for those not observed to die, with the latter again being treated as right censoring times. Cox models for bone metastases-free survival were fit in a similar way. Here, however, the censoring time was the minimum censoring time for bone metastases (end of the double-blind follow-up phase) and the censoring time for death (last contact). Cumulative incidence plots were created to characterize the proportion of subjects having experienced at least one new bone metastasis, while Kaplan-Meier estimates were plotted for the survival distribution and for the bone-metastases free survival analyses.
The covariates considered in Cox regression analyses included baseline age, body mass index (<25 kg/m2, 25-29.9 kg/m2, vs ≥30 kg/m2), prior prostatectomy (yes vs no), prior orchiectomy (yes vs no), Gleason sum (≥7 vs. <7), ECOG performance status (≤ 80 vs. 90-100), PSA (≥ 13.1 ng/mL vs. < 13.1 ng/mL), NTx (≥ 13.6 nmol BCE/L vs. < 13.6 nmol BCE/L), BAP (≥ 13.2 ng/mL vs. < 13.2 ng/mL), albumin, LDH, and hemoglobin.
PSA velocity was defined as the slope of regression line of natural log PSA by time over the first 12 weeks of follow-up. Specifically, a linear model was fit to log PSA values at baseline assessment, 4 weeks, 8 weeks, and 12 weeks versus time. Subjects without at least two PSA assessments were excluded from analyses involving PSA velocity. If a baseline assessment was not available, PSA value at screening assessment was used.
In Cox regression analyses described above, some clinical events (development of bone metastases, for example) may have occurred during the assessment of PSA velocity. To account for temporal ordering of PSA data and clinical events, additional Cox regression analyses were conducted. In this second set of analyses, subjects were not considered at risk for clinical events until week 12. Data from the first 12 weeks were used to compute the PSA velocity but no events were counted in this period. While this excludes some clinical events, it ensures a temporal ordering of the PSA data and the subsequent clinical events.
Results
Baseline Characteristics
Baseline prostate cancer and subject characteristics are summarized in Table 1. Mean age was 73 ± 8 years. Ninety-five percent of men were white. Median BMI was 27.8 kg/m2. By National Institutes of Health classification, 20.8% men were normal (BMI<25 kg/m2), 47.6% were overweight (BMI 25-29.9 kg/m2), and 31.6% were obese (BMI ≥ 30 kg/m2). Seventy-one percent of men had Gleason sum ≥ 7. Seventeen percent had a prior prostatectomy; 30.2% had prior orchiectomy. Median serum PSA at study entry was 13.1 ng/mL.
TABLE 1. Baseline Characteristics.
| Characteristic | Domain | Placebo Subjects with Complete Baseline Data (n = 331) |
|---|---|---|
| Age (yr) | ||
| Mean ± SD | 73 ± 8 | |
| Median [min, max] | 74 [48, 88] | |
| Time since initial diagnosis (yr) | ||
| Mean ± SD | 7.0 ± 3.7 | |
| Median [min, max] | 6.7 [0.9, 23.4] | |
| Race | White | 312 (94.3%) |
| Black | 18 (5.4%) | |
| Other | 1 (0.3%) | |
| Karnofsky performance score | ≤ 80 | 18 (5.4%) |
| 90 – 100 | 313 (94.6%) | |
| Body Mass Index (kg/m2 | 0 ≤ BMI < 25 | 65 (19.6%) |
| 25 ≤ BMI < 30 | 159 (48.0%) | |
| 30 ≤ BMI | 107 (32.3%) | |
| Mean ± SD | 28.7 ± 4.9 | |
| Median [min, max] | 27.8 [19.0, 52.1] | |
| Total Gleason Score | < 7 | 97 (29.3%) |
| ≥ 7 | 234 (70.7%) | |
| Prior prostatectomy | No | 274 (82.8%) |
| Yes | 57 (17.2%) | |
| Prior orchiectomy | No | 237 (71.6%) |
| Yes | 94 (28.4%) | |
| PSA (ng/mL) | ||
| Mean ± SD | 31.2 ± 65.7 | |
| Median [min, max] | 13.3 [0.8, 672.2] | |
| PSA velocity log(ng/mL)/yr | ||
| Mean ± SD | 1.4 ± 2.3 | |
| Median [min, max] | 1.2 [-20.3, 13.3] | |
| Ntx (nmol BCE/L) | ||
| Mean ± SD | 14.6 ± 6.9 | |
| Median [min, max] | 13.6 [5.0, 85.0] | |
| BAP (ng/mL) | ||
| Mean ± SD | 14.2 ± 8.4 | |
| Median [min, max] | 13.1 [2.1, 79.0] | |
| Albumin (g/dL) | ||
| Mean ± SD | 4.1 ± 0.3 | |
| Median [min, max] | 4.1 [3.1, 4.9] | |
| LDH | ||
| Mean ± SD | 175.2 ± 34.5 | |
| Median [min, max] | 169 [90.0, 353.0] | |
| Hemoglobin | ||
| Mean ± SD | 13.6 ± 1.1 | |
| Median [min, max] | 13.5 [10.6, 17.4] | |
Time to First Bone Metastasis and Survival
Figure 1A provides cumulative incidence plot for proportion of subjects with at least one bone metastasis and Kaplan-Meier plots for proportion of subjects who have died (Figure 1B) and proportion of subjects experiencing bone metastasis or death (Figure 1C). At 2 years, 46% of subjects had developed at least one bone metastasis and 20% had died. Median bone metastasis-free survival was 25 months.
Figure 1.


Time to first bone metastasis (Panel A), Kaplan-Meier Time to Death (Panel B), and bone metastasis-free survival (Panel C)
Cox Regression Analyses
Time to First Bone Metastasis
In univariate analyses (Table 2), baseline PSA ≥ median value of 13.1 ng/mL was associated with shorter time to first bone metastases (relative risk 2.02 [95% CI: 1.46,2.80], p<0.001). Prior prostatectomy was also associated with shorter time to first bone metastasis (relative risk 1.51 [95% CI: 1.00,2.28], p=0.048). Older age was associated with longer time to first bone metastasis (relative risk 0.95 for each additional year of age [95% CI: 0.93, 0.97; p<0.001]. Other host covariates including BMI and biochemical markers of bone turnover were not associated with time to first bone metastasis.
TABLE 2. Cox Proportional Hazard Estimates for Time to First Bone Metastasis.
| Univariate Model | Multivariate Model | |||||
|---|---|---|---|---|---|---|
| Full Model | Reduced Model | Reduced Model + TD Covariate | ||||
| Variable | RR (95% CI) p | pH | RR (95% CI) p | pH | RR (95% CI) p | RR (95% CI) p |
| Age (1 yr increase) | 0.95 (0.93,0.97) < 0.001 | 0.95 (0.93,0.98) < 0.001 | 0.95 (0.93,0.97) < 0.001 | 0.95 (0.93,0.97) < 0.001 | ||
| 0 kg/m2 ≤ BMI < 25 kg/m2 | ||||||
| 25 kg/m2 ≤ BMI < 30 kg/m2 | 0.93 (0.59,1.48) 0.766 | 0.111 | 0.87 (0.54,1.41) 0.575 | 0.185 | ||
| 30 kg/m2 ≤ BMI | 1.35 (0.84,2.17) 0.222 | 1.23 (0.75,2.02) 0.404 | ||||
| Prior Prostatectomy | 1.51 (1.00,2.28) 0.048 | 1.45 (0.93,2.26) 0.104 | ||||
| Prior Orchiectomy | 1.24 (0.88,1.75) 0.228 | 1.33 (0.92,1.92) 0.127 | ||||
| Gleason Score < 7 | ||||||
| Gleason Score ≥ 7 | 0.80 (0.57,1.13) 0.211 | 0.77 (0.54,1.09) 0.145 | ||||
| KPS 90 – 100 | ||||||
| KPS ≤ 80 | 0.84 (0.35,2.06) 0.710 | 0.72 (0.29,1.82) 0.490 | ||||
| PSA < 13.1 ng/mL | ||||||
| PSA ≥ 13.1 ng/mL | 2.02 (1.46,2.80) < 0.001 | 2.11 (1.49,2.97) < 0.001 | 1.98 (1.43,2.74) < 0.001 | |||
| ≤ 1 yr from study entry | 2.96 (1.80,4.87) < 0.001 | |||||
| > 1 yr from study entry | 1.36 (0.85,2.16) 0.196 | |||||
| Ntx < 13.6 nmol BCE/L | ||||||
| Ntx ≥ 13.6 nmol BCE/L | 1.20 (0.87,1.65) 0.277 | 1.26 (0.90,1.76) 0.182 | ||||
| BAP < 13.2 ng/mL | ||||||
| BAP ≥ 13.2 ng/mL | 1.20 (0.87,1.66) 0.261 | 1.01 (0.71,1.43) 0.952 | ||||
| Albumin (1 g/dL increase) | 1.15 (0.67,1.97) 0.614 | 1.08 (0.62,1.89) 0.789 | ||||
| LDH (1 IU/L increase) | 0.998 (0.993,1.003) 0.405 | 0.999 (0.993,1.004) 0.628 | ||||
| HGB (1 g/dL increase) | 1.01 (0.87,1.16) 0.920 | 0.92 (0.79,1.07) 0.281 | ||||
Note: All models stratified by cancer duration < 7 yrs or ≥ 7 yrs.
pH: Test of homogeneity, p-value
BMI: Body mass index; KPS: Karnofsky performance score
PSA: Prostate specific antigen; Ntx: Serum N-telopeptides; BAP: Bone alkaline phosphatase; LDH: Lactic dehydrogenase; HGB: hemoglobin
Baseline PSA and age remained statistically significant in full and reduced multivariate Cox regression model with relative risks of 1.98 [95% CI: 1.43, 2.74; p<0.001] and 0.95 [95% CI: 0.93, 0.97; p<0.001], respectively (Table 2). Prior prostatectomy was not statistically significant in multivariate models. In Cox regression models that were expanded to allow relative risks to vary with time, the relative risk for elevated baseline PSA (≥ 13.1 ng/mL) over the first year was 2.96 (95% CI: 1.80, 4.87; p < 0.001) and it was 1.36 ([95% CI: 0.85, 2.16; p = 0.196) during the second and subsequent years.
Overall Survival
In univariate analyses (Table 3), baseline PSA ≥ median value (relative risk 2.36 [95% CI: 1.72,3.23], p<0.001) and baseline NTx ≥ median value (relative risk 1.39; [95% CI: 1.03, 1.88]; p=0.031]) were significantly associated with shorter survival (Table 3). Baseline serum albumin (relative risk 0.46 for each 1 g/dL increase; [95% CI: 0.28, 0.77]; p=0.003]) and hemoglobin (relative risk 0.86 for each 1 g/dL increase; [95% CI: 0.75, 0.99]; p=0.042]) were significantly associated with longer survival.
TABLE 3. Cox Proportional Hazard Estimates for Overall Survival.
| Univariate Model | Multivariate Model | |||||
|---|---|---|---|---|---|---|
| Full Model | Reduced Model | Reduced Model + TD Covariate | ||||
| Variable | RR (95% CI) p | pH | RR (95% CI) p | pH | RR (95% CI) p | RR (95% CI) p |
| Age (1 yr increase) | 1.01 (0.99,1.03) 0.566 | 1.01 (0.98,1.03) 0.585 | ||||
| 0 kg/m2 ≤ BMI < 25 kg/m2 | ||||||
| 25 kg/m2 ≤ BMI < 30 kg/m2 | 0.71 (0.48,1.06) 0.097 | 0.245 | 0.75 (0.50,1.14) 0.175 | 0.375 | ||
| 30 kg/m2 ≤ BMI | 0.83 (0.54,1.26) 0.371 | 0.87 (0.56,1.35) 0.531 | ||||
| Prior Prostatectomy | 1.13 (0.76,1.69) 0.548 | 1.46 (0.94,2.26) 0.094 | ||||
| Prior Orchiectomy | 1.13 (0.81,1.58) 0.464 | 1.00 (0.70,1.41) 0.977 | ||||
| Gleason Score < 7 | ||||||
| Gleason Score ≥ 7 | 1.02 (0.73,1.43) 0.894 | 0.95 (0.67,1.35) 0.780 | ||||
| KPS 90 – 100 | ||||||
| KPS ≤ 80 | 1.80 (0.97,3.31) 0.061 | 1.16 (0.61,2.23) 0.654 | ||||
| PSA < 13.1 ng/mL | ||||||
| PSA ≥ 13.1 ng/mL | 2.36 (1.72,3.23) < 0.001 | 2.43 (1.75,3.37) < 0.001 | 2.34 (1.71,3.21) <0.001 | |||
| ≤ 3 yrs from study entry | 3.17 (2.09,4.82) <0.001 | |||||
| > 3 yrs from study entry | 1.44 (0.87,2.39) 0.156 | |||||
| Ntx < 13.6 nmol BCE/L | ||||||
| Ntx ≥ 13.6 nmol BCE/L | 1.39 (1.03,1.88) 0.031 | 1.44 (1.05,1.98) 0.026 | 1.41 (1.05,1.91) 0.025 | 1.40 (1.04,1.90) 0.028 | ||
| BAP < 13.2 ng/mL | ||||||
| BAP ≥ 13.2 ng/mL | 0.95 (0.70,1.28) 0.719 | 0.92 (0.66,1.28) 0.605 | ||||
| Albumin (1 g/dL increase) | 0.46 (0.28,0.77) 0.003 | 0.59 (0.35,1.01) 0.054 | 0.50 (0.30,0.83) 0.007 | 0.50 (0.30,0.83) 0.007 | ||
| LDH (1 IU/L increase) | 1.002 (0.998,1.007) 0.294 | 1.003 (0.998,1.007) 0.244 | ||||
| HGB (1 g/dL increase) | 0.86 (0.75,0.99) 0.042 | 0.91 (0.78,1.07) 0.265 | ||||
Note: All models stratified by cancer duration < 7 yrs or ≥ 7 yrs.
pH: Test of homogeneity, p-value
BMI: Body mass index; KPS: Karnofsky performance score
PSA: Prostate specific antigen; Ntx: Serum N-telopeptides; BAP: Bone alkaline phosphatase; LDH: Lactic dehydrogenase; HGB: hemoglobin
In multivariate Cox regression analyses, PSA, NTx, and albumin were significantly associated with overall survival (Table 3). In the reduced model, relative risks for PSA, NTx, and albumin were 2.34 [95% CI: 1.71, 3.21; p<0.001], 1.41 [95% CI: 1.05, 1.91; p=0.025], and 0.50 for each 1 g/dL increase [95% CI: 0.30, 0.83; p=0.007], respectively. In Cox regression models that were expanded to allow relative risks to vary with time, relative risk for elevated baseline PSA was 3.17 (95% CI: 2.09, 4.82; p < 0.001) for the first three years and 1.44 (95%CI: 0.87, 2.39; p = 0.156) for subsequent years.
Bone Metastases-Free Survival
In univariate analyses (Table 4), baseline PSA ≥ median value (relative risk 2.02 [95% CI: 1.48,2.76], p<0.001) and prior prostatectomy (relative risk 1.49 [95% CI: 1.01,2.19], p=0.046) were associated with shorter bone metastasis-free survival. Older age was associated with longer bone metastasis-free survival (relative risk 0.96 for each additional year of age [95% CI: 0.94, 0.98; p<0.001].
TABLE 4. Cox Proportional Hazard Estimates for Bone Metastasis-Free Survival.
| Univariate Model | Multivariate Model | |||||
|---|---|---|---|---|---|---|
| Full Model | Reduced Model | Reduced Model + TD Covariate | ||||
| Variable | RR (95% CI) p | pH | RR (95% CI) p | pH | RR (95% CI) p | RR (95% CI) p |
| Age (1 yr increase) | 0.96 (0.94,0.98) < 0.001 | 0.97 (0.94,0.99) 0.007 | 0.96 (0.94,0.99) < 0.001 | 0.96 (0.94,0.98) < 0.001 | ||
| 0 kg/m2 ≤ BMI < 25 kg/m2 | ||||||
| 25 kg/m2 ≤ BMI < 30 kg/m2 | 0.97 (0.62,1.51) 0.890 | 0.077 | 0.96 (0.61,1.51) 0.854 | 0.120 | ||
| 30 kg/m2 ≤ BMI | 1.40 (0.89,2.21) 0.147 | 1.37 (0.85,2.19) 0.195 | ||||
| Prior Prostatectomy | 1.49 (1.01,2.19) 0.046 | 1.49 (0.98,2.28) 0.064 | ||||
| Prior Orchiectomy | 1.16 (0.83,1.61) 0.390 | 1.17 (0.83,1.66) 0.376 | ||||
| Gleason Score < 7 | ||||||
| Gleason Score ≥ 7 | 0.81 (0.59,1.12) 0.210 | 0.79 (0.57,1.10) 0.163 | ||||
| KPS 90 – 100 | ||||||
| KPS ≤ 80 | 1.37 (0.70,2.69) 0.359 | 1.21 (0.60,2.45) 0.594 | ||||
| PSA < 13.1 ng/mL | ||||||
| PSA ≥ 13.1 ng/mL | 2.02 (1.48,2.76) < 0.001 | 2.08 (1.51,2.89) < 0.001 | 1.98 (1.45,2.70) < 0.001 | |||
| ≤ 1 yr from study entry | 3.11 (1.92,5.04) < 0.001 | |||||
| > 1 yr from study entry | 1.33 (0.86,2.06) 0.196 | |||||
| Ntx < 13.6 nmol BCE/L | ||||||
| Ntx ≥ 13.6 nmol BCE/L | 1.24 (0.92,1.68) 0.165 | 1.28 (0.93,1.77) 0.125 | ||||
| BAP < 13.2 ng/mL | ||||||
| BAP ≥ 13.2 ng/mL | 1.23 (0.91,1.67) 0.177 | 1.06 (0.76,1.47) 0.748 | ||||
| Albumin (1 g/dL increase) | 0.99 (0.60,1.65) 0.974 | 0.98 (0.58,1.67) 0.940 | ||||
| LDH (1 IU/L increase) | 0.999 (0.994,1.004) 0.606 | 0.999 (0.994,1.004) 0.784 | ||||
| HGB (1 g/dL increase) | 1.01 (0.88,1.16) 0.857 | 0.94 (0.81,1.09) 0.390 | ||||
Note: All models stratified by cancer duration < 7 yrs or ≥ 7 yrs.
pH: Test of homogeneity, p-value
BMI: Body mass index; KPS: Karnofsky performance score
PSA: Prostate specific antigen; Ntx: Serum N-telopeptides; BAP: Bone alkaline phosphatase; LDH: Lactic dehydrogenase; HGB: hemoglobin
Baseline PSA and age remained statistically significant in full and reduced multivariate Cox regression model with relative risks of 1.98 [95% CI: 1.45, 2.70; p<0.001] and 0.96 [95% CI: 0.94, 0.99; p<0.001], respectively. Similar to multivariate analyses for other outcomes, prior prostatectomy was not significantly associated with bone metastasis-free survival. Again, however there was evidence of a time-varying effect of elevated baseline PSA. The relative risk for elevated baseline PSA was 3.11 (95% CI: 1.92, 5.04; p < 0.001) during the first year and 1.33 (95% CI: 0.86, 2.06; p = 0.196) for subsequent years.
Additional analyses were conducted including covariates reflecting changes in PSA and bone metabolism markers from baseline to week 12. After controlling for other covariates, higher PSA velocity was significantly associated with shorter overall survival (relative risk 1.15 for each 1 log(ng/mL)/year increase [95% CI 1.05, 1.26], p=0.002) but not time to first bone metastasis or bone metastasis-free survival. Higher baseline PSA was significantly associated with shorter time to first bone metastasis (relative risk 1.39 for each 1 log(ng/mL) increase; [95% CI: 1.19, 1.62; p<0.001]) and bone metastasis-free survival (relative risk 1.44 for each 1 log(ng/mL) increase [95% CI: 1.24, 1.67], p<0.001). Changes in BAP and NTx were not significantly associated with any clinical outcome.
Figure 2 illustrates the Kaplan-Meier estimates of the distribution of time to bone metastases or death by baseline PSA quartiles (Panel A), NTx quartiles (Panel C), and BMI category (Panel D). Figure 2B illustrates the estimated survival distribution for bone metastases or death by tertiles of PSA velocity.
Figure 2.


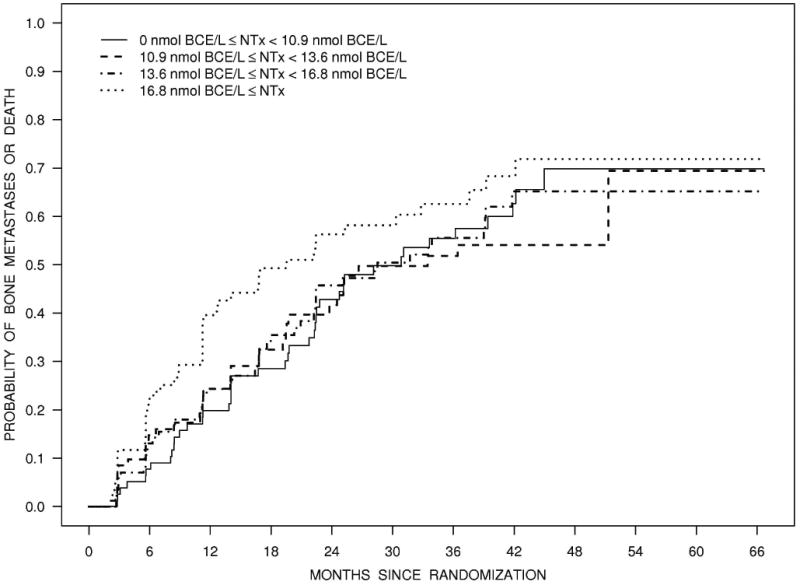

Bone metastasis-free survival according to quartiles of PSA (Panel A), tertiles of PSA velocity (Panel B), quartiles of NTx (Panel C), and BMI (Panel D).
Discussion
Using data from an international randomized controlled trial, we observed that men with progressive castration-resistant nonmetastatic prostate cancer have a relatively indolent clinical course. Forty-six percent of men developed bone metastases at two years and median metastasis-free survival was 25 months. Higher baseline PSA was significantly associated with shorter time to first bone metastasis, overall survival, and bone metastasis-free survival. PSA velocity was associated with shorter overall and bone metastasis-free survival. No other cancer covariate and none of the host covariates, including BMI and bone turnover markers, were consistently associated with clinical outcomes.
Our results are consistent with an earlier report of an aborted randomized controlled trial of zoledronic acid to prevent bone metastases in men with progressive castration-resistant nonmetastatic prostate cancer. In analyses of 201 subjects assigned to placebo group, one-third of men developed bone metastases after two years and median bone metastasis-free survival was 30 months.4 Higher baseline PSA and PSA velocity were associated with time to first bone metastasis and survival. Other covariates were not associated with clinical outcomes. Notably, the study lacked information about host characteristics including BMI and biochemical markers of bone turnover.
These results extend the evidence linking PSA kinetics to clinical outcomes. In men with rising PSA after surgery or radiation therapy for early-stage disease, greater PSA velocity is associated with shorter time to metastases19-22 and survival23-25. PSA velocity is also associated with survival in men with castration-resistant metastatic prostate cancer.26
Prevention of bone metastases remains a major unmet medical need in men with prostate cancer. Failure of prior metastasis prevention studies in men with castration-resistant nonmetastatic prostate cancer may reflect, at least in part, the lower than expected event rates in this disease state. The consistent observations that PSA and PSA velocity were associated with shorter time to first bone metastasis, however, may inform the design of clinical trials to prevent bone metastases in men with castration-resistant disease. The predictive value of PSA and PSA velocity suggests that PSA and PSA kinetics might provide a convenient and effective strategy to identify men at high risk for bone metastases or death. An ongoing global phase 3 study of denosumab to prevent bone metastases in men with castration-resistant prostate cancer (NCT00286091) includes only subjects with PSA ≥8 ng/mL or PSA doubling time ≤ 10 months. Event rates of subjects in the placebo group of this study may validate use of PSA and PSA kinetics for selection of high-risk subjects in this setting.
To the best of our knowledge, these analyses are the first to evaluate the relationship between bone turnover markers and subsequent bone metastases using a large prospective database. In men with metastatic prostate cancer, biochemical markers of osteoblast and osteoclast activity are elevated and levels correspond to extent of skeletal involvement.9,10 In cross-sectional studies, a variety of bone-specific markers, including BAP and urinary NTx, are associated with radiographically detectable bone metastases.27 Despite careful prospective ascertainment of new bone metastases, absence of potentially confounding effects of other systemic therapies, and large number of informative events, we found no significant association between baseline BAP or urinary NTx and time to first bone metastases or bone metastasis-free survival. Addition studies of other markers and/or higher risk patients are needed.
Greater body mass index (BMI) is associated with higher rates of PSA failure following surgery or radiation therapy for early stage prostate cancer.5-7 Greater BMI is also associated shorter survival after combined modality therapy for locally advanced disease.8 Several mechanisms have been proposed to explain worse clinical outcomes for obese men following primary treatment for local-regional disease. These putative mechanisms include changes in gonadal steroids, increased insulin and insulin-like growth factors, alterations in adipocytokines, understaging, decreased local control, and decreased effectiveness of ADT.28 In contrast to reports in earlier stage disease, obesity was not associated with clinical outcomes in our subjects. If confirmed in other studies, the absence of a relationship between BMI and clinical outcomes in castration-resistant disease may help define mechanisms responsible for higher rates of failure in overweight and obese men following primary treatment for early stage prostate cancer.
These analyses have several strengths. The study was a large and included subjects from 183 sites in the United States and Europe. Bone scans were performed every 12 weeks and all imaging studies underwent independent central review. Any potential ascertainment bias for new bone metastases (including possible bias introduced by rising PSA) was minimized by the frequent schedule for bone scans. In contrast to the study of zoledronic acid in this setting, treatment with secondary hormonal therapy or chemotherapy was not allowed. This part of the study design eliminates the potential confounding effects of other therapies on clinical outcomes.
In summary, men with progressive castration-resistant prostate cancer and no detectable metastatic disease have a relatively indolent clinical course with a median metastasis-free survival of 25 months. Higher baseline PSA was consistently associated with shorter time to first bone metastasis, overall survival, and metastasis-free survival. Additional research is needed to understand the disease and host factors associated with disease progression.
Acknowledgments
Funding: The clinical trial was supported by Abbott Laboratories (Abbot Park, Illinois). The analyses for this report were supported by the University of Pittsburgh Department of Urology Prostate Cancer Research Program and National Institutes of Health (5K24CA121990 to Dr Smith).
Footnotes
Presented at the Annual Meeting of the American Society of Clinical Oncology (June 2010).
References
- 1.Petrylak DP, Tangen CM, Hussain MH, et al. Docetaxel and estramustine compared with mitoxantrone and prednisone for advanced refractory prostate cancer. N Engl J Med. 2004;351:1513–20. doi: 10.1056/NEJMoa041318. [DOI] [PubMed] [Google Scholar]
- 2.Tannock IF, de Wit R, Berry WR, et al. Docetaxel plus prednisone or mitoxantrone plus prednisone for advanced prostate cancer. N Engl J Med. 2004;351:1502–12. doi: 10.1056/NEJMoa040720. [DOI] [PubMed] [Google Scholar]
- 3.Sharifi N, Gulley JL, Dahut WL. Androgen deprivation therapy for prostate cancer. Jama. 2005;294:238–44. doi: 10.1001/jama.294.2.238. [DOI] [PubMed] [Google Scholar]
- 4.Smith MR, Kabbinavar F, Saad F, et al. Natural history of rising serum prostate-specific antigen in men with castrate nonmetastatic prostate cancer. J Clin Oncol. 2005;23:2918–25. doi: 10.1200/JCO.2005.01.529. [DOI] [PubMed] [Google Scholar]
- 5.Amling CL, Riffenburgh RH, Sun L, et al. Pathologic variables and recurrence rates as related to obesity and race in men with prostate cancer undergoing radical prostatectomy. J Clin Oncol. 2004;22:439–45. doi: 10.1200/JCO.2004.03.132. [DOI] [PubMed] [Google Scholar]
- 6.Freedland SJ, Aronson WJ, Kane CJ, et al. Impact of obesity on biochemical control after radical prostatectomy for clinically localized prostate cancer: a report by the Shared Equal Access Regional Cancer Hospital database study group. J Clin Oncol. 2004;22:446–53. doi: 10.1200/JCO.2004.04.181. [DOI] [PubMed] [Google Scholar]
- 7.Strom SS, Kamat AM, Gruschkus SK, et al. Influence of obesity on biochemical and clinical failure after external-beam radiotherapy for localized prostate cancer. Cancer. 2006;107:631–9. doi: 10.1002/cncr.22025. [DOI] [PubMed] [Google Scholar]
- 8.Efstathiou JA, Bae K, Shipley WU, et al. Obesity and mortality in men with locally advanced prostate cancer: analysis of RTOG 85-31. Cancer. 2007;110:2691–9. doi: 10.1002/cncr.23093. [DOI] [PMC free article] [PubMed] [Google Scholar]
- 9.Fontana A, Delmas PD. Markers of bone turnover in bone metastases. Cancer. 2000;88:2952–60. doi: 10.1002/1097-0142(20000615)88:12+<2952::aid-cncr11>3.0.co;2-m. [DOI] [PubMed] [Google Scholar]
- 10.Garnero P. Markers of bone turnover in prostate cancer. Cancer Treat Rev. 2001;27:187–92. doi: 10.1053/ctrv.2000.0213. discussion 193-6. [DOI] [PubMed] [Google Scholar]
- 11.Smaletz O, Scher HI, Small EJ, et al. Nomogram for overall survival of patients with progressive metastatic prostate cancer after castration. J Clin Oncol. 2002;20:3972–82. doi: 10.1200/JCO.2002.11.021. [DOI] [PubMed] [Google Scholar]
- 12.Halabi S, Small EJ, Kantoff PW, et al. Prognostic model for predicting survival in men with hormone-refractory metastatic prostate cancer. J Clin Oncol. 2003;21:1232–7. doi: 10.1200/JCO.2003.06.100. [DOI] [PubMed] [Google Scholar]
- 13.Cook RJ, Coleman R, Brown J, et al. Markers of bone metabolism and survival in men with hormone-refractory metastatic prostate cancer. Clin Cancer Res. 2006;12:3361–7. doi: 10.1158/1078-0432.CCR-06-0269. [DOI] [PubMed] [Google Scholar]
- 14.Smith MR, Egerdie B, Hernandez Toriz N, et al. Denosumab in men receiving androgen-deprivation therapy for prostate cancer. N Engl J Med. 2009;361:745–55. doi: 10.1056/NEJMoa0809003. [DOI] [PMC free article] [PubMed] [Google Scholar]
- 15.Casimiro S, Guise TA, Chirgwin J. The critical role of the bone microenvironment in cancer metastases. Mol Cell Endocrinol. 2009;310:71–81. doi: 10.1016/j.mce.2009.07.004. [DOI] [PubMed] [Google Scholar]
- 16.Nelson JB, Love W, Chin JL, et al. Phase 3, randomized, controlled trial of atrasentan in patients with nonmetastatic, hormone-refractory prostate cancer. Cancer. 2008;113:2478–87. doi: 10.1002/cncr.23864. [DOI] [PMC free article] [PubMed] [Google Scholar]
- 17.Kalbfleisch J, Prentice R. The Statistical Analysis of Failure Time Data. Second. John Wiley and Sons; 2002. [Google Scholar]
- 18.Therneau RM, Grambsch PM. Modeling survival data: extending the Cox model. New York: Springer-Verlag; 2000. [Google Scholar]
- 19.Lee WR, Hanks GE, Hanlon A. Increasing prostate-specific antigen profile following definitive radiation therapy for localized prostate cancer: clinical observations. J Clin Oncol. 1997;15:230–8. doi: 10.1200/JCO.1997.15.1.230. [DOI] [PubMed] [Google Scholar]
- 20.Patel A, Dorey F, Franklin J, et al. Recurrence patterns after radical retropubic prostatectomy: clinical usefulness of prostate specific antigen doubling times and log slope prostate specific antigen. J Urol. 1997;158:1441–5. doi: 10.1016/s0022-5347(01)64238-1. [DOI] [PubMed] [Google Scholar]
- 21.Sartor CI, Strawderman MH, Lin XH, et al. Rate of PSA rise predicts metastatic versus local recurrence after definitive radiotherapy. Int J Radiat Oncol Biol Phys. 1997;38:941–7. doi: 10.1016/s0360-3016(97)00082-5. [DOI] [PubMed] [Google Scholar]
- 22.Pound CR, Partin AW, Eisenberger MA, et al. Natural history of progression after PSA elevation following radical prostatectomy [see comments] Jama. 1999;281:1591–7. doi: 10.1001/jama.281.17.1591. [DOI] [PubMed] [Google Scholar]
- 23.Sandler HM, Dunn RL, McLaughlin PW, et al. Overall survival after prostate-specific-antigen-detected recurrence following conformal radiation therapy. Int J Radiat Oncol Biol Phys. 2000;48:629–33. doi: 10.1016/s0360-3016(00)00717-3. [DOI] [PubMed] [Google Scholar]
- 24.D'Amico AV, Cote K, Loffredo M, et al. Determinants of prostate cancer-specific survival after radiation therapy for patients with clinically localized prostate cancer. J Clin Oncol. 2002;20:4567–73. doi: 10.1200/JCO.2002.03.061. [DOI] [PubMed] [Google Scholar]
- 25.D'Amico AV, Moul JW, Carroll PR, et al. Surrogate end point for prostate cancer-specific mortality after radical prostatectomy or radiation therapy. J Natl Cancer Inst. 2003;95:1376–83. doi: 10.1093/jnci/djg043. [DOI] [PubMed] [Google Scholar]
- 26.Vollmer RT, Dawson NA, Vogelzang NJ. The dynamics of prostate specific antigen in hormone refractory prostate carcinoma: an analysis of cancer and leukemia group B study 9181 of megestrol acetate. Cancer. 1998;83:1989–94. doi: 10.1002/(sici)1097-0142(19981101)83:9<1989::aid-cncr15>3.0.co;2-v. [DOI] [PubMed] [Google Scholar]
- 27.Smith MR. Markers of bone metabolism in prostate cancer. Cancer Treat Rev. 2006;32(1):23–6. doi: 10.1016/s0305-7372(06)80006-x. [DOI] [PubMed] [Google Scholar]
- 28.Freedland SJ. Obesity and prostate cancer: a growing problem. Clin Cancer Res. 2005;11:6763–6. doi: 10.1158/1078-0432.CCR-05-1305. [DOI] [PubMed] [Google Scholar]