

Abstract
Background
Chronic ethanol self-administration induces oxidative stress and exacerbates lipid peroxidation. α-Tocopherol is a potent lipid antioxidant and vitamin that is dependent upon lipoprotein transport for tissue delivery.
Methods
To evaluate the extent to which vitamin E status is deranged by excessive alcohol consumption, monkeys voluntarily drinking ethanol (1.36 to 3.98 g/kg/day for 19 months, n=11) were compared with non-drinkers (n=5, control)
Results
Three alcohol drinking animals developed hyperlipidemia with plasma triglyceride levels (1.8 ± 0.9 mmol/L) double those of normolipidemic (NL) drinkers (0.6 ± 0.2) and controls (0.6 ± 0.3, p<0.05); elevated plasma cholesterol (3.6 ± 0.5 mmol/L) compared with NL drinkers (2.3 ± 0.2, p<0.05) and controls (2.9 ± 0.3); and lower plasma α-tocopherol per triglycerides (14 ± 6 mmol/mol) than controls (27 ± 8) and NL drinkers (23 ± 6 p<0.05). Hyperlipidemic monkey liver α-tocopherol (47 ± 15 nmol/g) was lower than NL drinkers (65 ± 13) and controls (70 ± 15, p=0.080), as was adipose α-tocopherol (84 ± 37nmol/g) compared with controls (224 ± 118) and NL drinkers (285 ± 234, p<0.05). Plasma apolipoprotein (apo) CIII increased compared to baseline at both 12 and 19 months in the normolipidemic (P=0.0016 and P=0.0028, respectively) and in the hyperlipidemic drinkers (P<0.05 and P<0.05, respectively). Plasma apo H concentrations at 19 months were elevated hyperlipidemics (P<0.05) relative to concentrations in control animals. C-reactive protein (CRP), a marker of inflammation, was increased compared to baseline at both the 12- and 19-month time points in the normolipidemic (P=0.005 and P=0.0153, respectively) and hyperlipidemic drinkers (P=0.016 and P=0.0201, respectively).
Conclusion
A subset of alcohol drinking monkeys showed a predisposition to alcohol-induced hyperlipidemia. The defect in lipid metabolism resulted in lower plasma α-tocopherol per triglycerides and depleted adipose tissue α-tocopherol, and thus, decreased vitamin E status.
Keywords: α-tocopherol, apolipoproteins, chronic ethanol consumption, lipids, liver, oxidative stress, cynomolgus monkeys
Introduction
Vitamin E is a term encompassing eight different lipid soluble, chain-breaking antioxidants including α-, β-, γ-, δ-tocopherols and α-, β-, γ-, δ-tocotrienols, of which only α-tocopherol is preferentially maintained in human plasma and tissues (Traber, 2005). Vitamin E is absorbed by the intestine and is secreted and transported to the liver by chylomicrons. The liver α-tocopherol transfer protein (αTTP) facilitates enrichment of plasma lipoproteins with α-tocopherol (Qian et al., 2006). During lipoprotein catabolism, α-tocopherol is delivered to tissues via mechanisms of lipid and lipoprotein metabolism (Traber, 2007; Traber et al., 2004). Excess vitamin E is metabolized and excreted by the liver as carboxy ethyl hydroxy chromanols (CEHCs) (Traber, 2007).
Chronic alcohol consumption is a known oxidative stress that impacts a multitude of cellular processes. The causation of ethanol-induced oxidative stress includes generation of reactive oxygen species due to its own metabolism while ethanol calories devoid of key antioxidant nutrients replace other calorie sources (Cederbaum, 2001). Multiple studies have documented increases in lipid peroxidation and oxidative stress biomarkers with chronic ethanol consumption (Barden et al., 2007; Hartman et al., 2005; Ivester et al., 2007; Lecomte et al., 1994; Situnayake et al., 1990; Teare et al., 1994). Ethanol is metabolized via alcohol dehyrogenase as well as by cytochrome P450 enzymes that are part of the microsomal ethanol-oxidizing system (MEOS) (McDonough, 2003). The induction of the MEOS by chronic ethanol consumption can also effect lipoprotein levels as the enzymes involved in lipoprotein production are affected by MEOS activity (Lieber, 1999). Altered lipoprotein metabolism is a notable side-effect of chronic ethanol consumption with concominant increases in plasma triglycerides and cholesterol, alterations in hepatocyte lipoprotein receptors (Seitz et al., 1994), cholesterol efflux capacity of HDL (Marmillot et al., 2007), plasma apolipoprotein content and concentrations (Lecomte et al., 1996), hepatic P450 enzyme activity (Ivester et al., 2007; McDonough, 2003), and hepatic lipogenesis via interactions with peroxisome proliferator activated receptor-α (PPARα), AMP-activated protein kinase (AMPK), and sterol response element binding protein 1 (SREBP-1) (Sozio and Crabb, 2008; You et al., 2002).
The fate of antioxidants in an environment of oxidative stress resulting from chronic ethanol consumption is well documented. The vast majority of previous studies found a reduction in vitamin E levels associated with ethanol consumption (Bjorneboe and Bjorneboe, 1993; Bjorneboe et al., 1987a; Bjorneboe et al., 1987b; Bjorneboe et al., 1988a; Bjorneboe et al., 1988b; Grattagliano et al., 1997; Hartman et al., 2005; Johansson et al., 1986; Lecomte et al., 1994; Odeleye et al., 1991; Valls-Belles et al., 2008), concluding the reduction resulted from either increased oxidative stress, differences in ethanol consumption or diet, altered lipoprotein status, or enzymatic changes in the liver. However, no one study has measured multiple indicators of vitamin E status. Previously, cynomolgus monkeys consuming the same range of ethanol as seen in this study had documented increases in lipid peroxidation, oxidative stress biomarkers, and tissue damage (Ivester et al., 2007). Thus in the presence of this increased oxidative stress and lipid peroxidation, our aim was to elucidate the effect of chronic alcohol consumption on vitamin E status in relation to plasma and tissue α-tocopherol concentrations, plasma lipoproteins concentrations, as well as vitamin E metabolism.
Materials and Methods
Reagents
HPLC-grade methanol, ethanol, hexane, and glacial acetic acid were obtained from Fisher (Fair Lawn, NJ). Diethyl ether was obtained from Mallinckrodt Baker, Inc. (Phillipsburg, NJ). B-Glucuronidase (type H-1; contains minimum 300,000 U/g β-glucuronidase activity and minimum 10,000 U/g sulfatase activity) and 6-hydroxy-2,5,7,8-tetramethylchroman-2-carboxylic acid (trolox, 98% purity) were from Sigma-Aldrich (St. Louis, MO). All other chemicals were obtained at reagent grade quality from suppliers.
Animal studies
A population of 12 adult female monkeys was induced to self-administer 4% (w/v in water) ethanol as previously described (Grant et al., 2008; Vivian et al., 2001). One monkey post-induction chose not to drink ethanol voluntarily (mean 15 month intake 0.1 g/kg/day, mean 12 month blood alcohol content =0.00 mg/dl) and was classified as a non-drinking control. All monkeys (drinkers n=11, control n=5) were fed the same diets with 51 IU vitamin E (dl α-tocopheryl acetate) per kg diet (TestDiet 5045, 3.36 kcal/g, Richmond, IN). During the course of the experiments food intakes and body weights were documented for each individual. Dual energy x-ray absorptiometry (DXA) scans were carried out to assess changes in body composition using a Hologic scanner (Hologic, Inc., Bedford, MA). Animals were sedated intramuscularly with 10 mg/kg Ketamine (100 mg/ml) and positioned supine on the bed. Two total body scans were performed per monkey in February 2007 (4 months, see blood draw schedule below) and April 2008 (18 months) and both body fat and lean mass were calculated as a percentage of total tissue mass using Hologic software version 12.6.1 (Hologic, Inc., Bedford, MA).
Monkeys were acquired in June 2005 with the first blood draw performed in March 2006 (data not shown). Ethanol induction studies were performed beginning October 2006, when the monkeys were 6.4-6.9 years old and a baseline blood draw was taken (shown as 0 months on time-course graphs). During the induction period, ethanol consumption incrementally increased from 0.5 to 1.5 g/kg ethanol consumed per day over 3 months. After an additional month of 1.5 g/kg/day consumption, 22-hour self-administration began in February 2007 with blood draws in April 2007 (6 months), October 2007 (12 months), and a final draw for both control (n=5) and experimental (n=11) animals at necropsy in May 2008 (19 months) (Grant et al., 2008). It should be noted that one animal, who underwent the induction procedure, did not voluntarily consume ethanol and we therefore have included her in the control group. Ethanol (4% in water) and pure water were separately and continuously available during the self-administration daily 22-hr sessions. During the course of the experiments, daily ethanol intake was documented for each individual.
Measurement of tocopherols
Plasma and tissue α- and γ-tocopherol concentrations were determined by high-performance liquid chromatography with electrochemical detection (HPLC-ECD) as previously described (Podda et al., 1996). Tocopherols were quantitated by comparison to peak areas of authentic compounds.
Measurement of cholesterol and triglycerides
Plasma cholesterol and triglyceride levels were determined using Infinity™ Cholesterol and Infinity™ Triglycerides, respectively, Liquid Stable Reagent per manufacturer instructions (Thermo Electron Corporation, Pittsburg, PA). Briefly, 5 μL plasma was diluted 1:100 with kit reagent, incubated according to directions, and read at 500nm using a Beckman DU-640 Spectrophotometer (Brea, CA). A five-point standard curve using either total cholesterol or total triglycerides (Thermo Electron, Pittsburg, PA) was prepared alongside samples to calculate sample concentrations. Three alcohol-drinking animals were identified at necropsy by analysis of plasma cholesterol and triglyceride concentrations as having high total lipids (plasma cholesterol plus plasma triglycerides) and are therefore grouped together and called “hyperlipidemic” drinkers.
Extraction and measurement of liver α-CEHC by LC/MS
α-CEHC was extracted using a modified method of Leonard et al. (Leonard et al., 2005). Briefly, liver tissue (∼50mg) was homogenized with a Polytron homogenizer (Brinkmann, Westbury, NY) using a 7 mm foam reducing generator in a 10 ml screw-cap tube containing 2 ml Milli-Q® water and 100 μL 1% ascorbic acid solution. Homogenization was followed by the addition of 100 μL enzyme solution (1 mg of β-glucuronidase in 100 μL of 10mM acetate buffer, pH 6.8) and a 1 hour incubation at 37°C. α-CEHC was extracted twice with 3 mL diethyl ether and an aliquot of the ether fraction was collected and dried under nitrogen. The sample was resuspended in 1:1 (v/v) water:methanol containing trolox (internal standard). Samples were then transferred to microcentrifuge tubes and spun at 16,000 g for 5 min at 10°C and the supernatant transferred to an injection vial.
α-CEHC was analyzed according to a modified method of Leonard et al. (Leonard et al., 2005) using liquid chromatography-mass spectrometry (LC-MS) with a Waters (Milford, MA) 2695 Separations Module. Single-ion recording mass-to-charge ratio (m/z) data were obtained for α-CEHC (m/z 277) and trolox (m/z 249). Typical retention times were 14.2 and 15.4 min for trolox and α-CEHC, respectively. Sample α-CEHC concentrations were calculated from the peak area of the corresponding ion to that of the trolox (internal standard) peak.
Primers, RNA extraction, and RT-qPCR
Primers used for Ttpa: forward 5′GCCAAGAAGATTGCTGCTGT3′ and reverse 5′TTCCTGACAAATGTCCTCCA3′ (Invitrogen, Carlsbad, CA). Primers designed to human β-actin mRNA (actb, Accession # NM_001101.3) were used for expression normalization: forward 5′TCTTCCAGCCTTCCTTCCTGGGCATG3′ reverse 5′GCTCAGGAGGAGCAATGATCTTGATC3′ (primers a gift from Dr. Emily Ho, Oregon State University). RNA was extracted from liver samples (∼50 mg) using TRIzol® Reagent per the manufacturer (Invitrogen) and homogenized using the Bullet Blender™ according to manufacturer protocol (Next Advance, Inc., Averill Park, New York). cDNA synthesis was completed using an Eppendorf Mastergradient™ thermocycler and SuperScript™ III First-Strand Synthesis System (Invitrogen) per manufacturer instructions. qPCR was performed for ttpa and actb using Platinum® SYBR® Green SuperMix (Invitrogen) on a DNA Engine Opticon® 2 (Bio-Rad, Philadelphia, PA) per the manufacturer.
Plasma Protein Analyses
Plasma protein profiling was performed as previously described (Freeman et al., 2010) at Rules-Based Medicine, Inc. (Austin, Texas) using standard Luminex technology (Vignali, 2000). Plasma samples (in triplicate) were subjected to Human Antigen MAP antigen analysis for 90 different circulating proteins. Plasma and capture microspheres were thoroughly mixed and incubated at room temperature for 1 hour. Multiplexed cocktails of biotinylated reporter antibodies were then added and incubated for 1 hour. Multiplexes were developed using an excess of streptavidin-phycoerythrin solution. Analysis was performed in a Luminex 100 instrument. Unknown values for each of the analytes localized in a specific multiplex were determined using 4 and 5 parameter, weighted and non-weighted curve fitting algorithms.
Statistics
Data are expressed as mean ± SD, results were considered to be statistically significant at P<0.05. MANOVA was performed to evaluate repeated effects attributed to alcohol over time. If a statistically significant two-way interaction or an ANOVA for comparisons between groups, was found, then a Tukey's HSD (Honestly Significant Differences) Test was performed.
Results
Monkeys and diets
All monkeys (drinkers n=11, control n=5) were fed the same diets containing 51 IU vitamin E per kg diet. The drinkers voluntarily consumed a range of ethanol (individual daily averages from 1.4 to 4.0 g/kg/day for the self-administration period of 15 months). Three alcohol-drinking animals were identified at necropsy by analysis of plasma cholesterol and triglyceride concentrations as having high lipids and are therefore grouped together and called “hyperlipidemic” drinkers (Table 2). The average daily alcohol consumption values over the total 19 months (induction [4 months] plus self-administration [15 months] period) of ethanol exposure by the normolipidemic drinkers (n=8, 3.1 ± 0.8 g/kg) and the hyperlipidemic drinkers (n=3, 3.5±0.6) were not statistically different and categorically considered “heavy” intakes (Vivian et al., 2001).
Table 2. Circulating Lipid Levels at Necropsy.
| Total Cholesterol (mmol/L) | Triglycerides (mmol/L) | Lipids* | α-tocopherol/lipids (mmol/mol) | |
|---|---|---|---|---|
| Control (n=5) | 2.7 ± 0.2a | 0.62 ± 0.3a | 3.3 ± 0.4a | 4.5 ± 0.4 |
| Normolipidemic Drinkers (n=5#) | 2.3 ± 0.2b | 0.67 ± 0.2a | 3.0 ± 0.2a | 5.1 ± 0.2 |
| Hyperlipidemic Drinkers (n=3) | 3.2 ± 0.4c | 1.9 ± 0.9b | 5.1 ± 0.5b | 4.3 ± 0.5 |
Lipids are calculated as the sum of the triglycerides and total cholesterol.
Three animals had insufficient plasma for analysis.
Values in a column not sharing the same letter are significantly different
Monkeys' body weights increased over the course of the study for control and ethanol-drinking monkeys, but neither the amount of food consumed nor the body weights were significantly different between groups (Table 1). The amount of diet (in grams) fed to each monkey was determined on an individual basis and in quantities sufficient for an average weight gain of 20% (± 12%) over the 15 months of 22 h/day ethanol self-administration. The three hyperlipidemic animals, gained 19, 24 and 29% body weight over this 15-month self-administration phase, very close to the average weight gain of 20% for the group.
Table 1. Monkey characteristics.
| Body Weight (kg) | Food Intake (g/kg body weight) | |||||
|---|---|---|---|---|---|---|
| Study Month | Hyperlipidemic Drinkers (n=3) | Normolipidemic Drinkers (n=8) | Control (n=5) | Hyperlipidemic Drinkers (n=3) | Normolipidemic Drinkers (n=8) | Control (n=5) |
| 0 | 3.3±0.3 | 2.9±0.2 | 3.6±0.7 | 17.4±0.5 | 19.7±1.7 | 16.2±4.5 |
| 6 | 3.5±0.2 | 3.1±0.2 | 3.8±0.7 | 16.4±0.1 | 18.5±1.7 | 15.3±3.7 |
| 12 | 4.0±0.5 | 3.4±0.3 | 4.4±1.2 | 13.9±1.2 | 16.9±2.2 | 13.6±4.2 |
| 18 | 4.6±0.5 | 3.5±0.5 | 4.8±1.5 | 12.3±0.7 | 16.1±2.7 | 13.2±4.6 |
For both body weights and food intake, there was a significant (p<0.001) effect of time, but no effect of alcohol drinking, or lipid status
Body composition was assessed by DXA at the end of the induction period prior to alcohol self-administration (4 months) and a second DXA scan was performed one month prior to necropsy (18 months). Although body weights (P<0.0001) and percentage body fat (P=0.0005) increased, and percentage lean body mass decreased (P=0.0006) over the 14 months, no statistically significant differences were observed between groups (FIGURE 1).
Figure 1. Body weights, percentage fat and lean body mass.
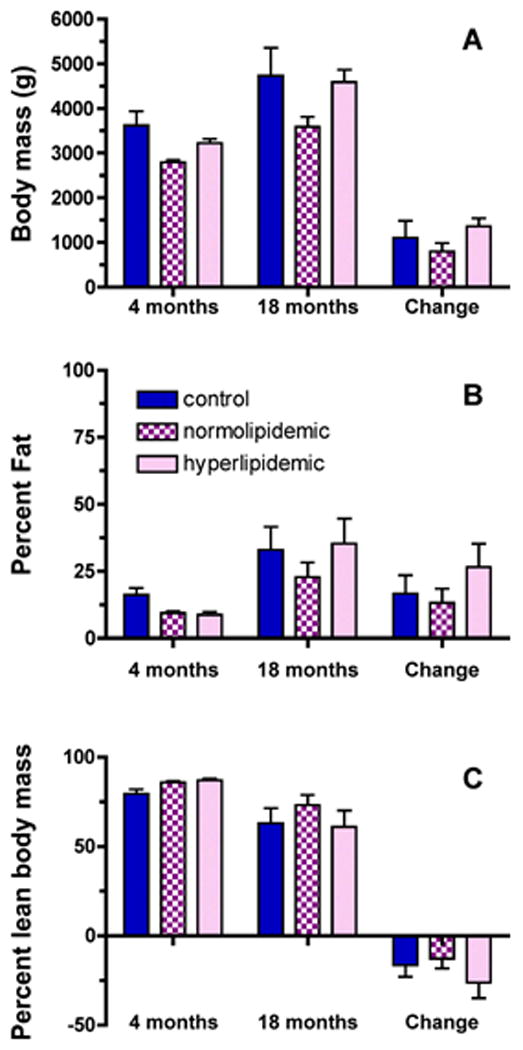
Body composition was assessed by DXA at the end of the induction period prior to self-administration (4 months) and at one month prior to necropsy (18 months) [(A) body weights, (B) percentage fat, (C) percentage lean body mass]. No statistically differences were found between groups, or for the changes in percent fat or lean mass over time.
Plasma cholesterol, triglycerides and α-tocopherol concentrations
Plasma lipid concentrations over the course of the study were determined to confirm the development of hyperlipidemia observed at necropsy. Prior to alcohol exposure (0 months) plasma triglycerides in ethanol-induced hyperlipidemic drinkers (0.4 ± 0.2) were not different from monkeys that maintained a normal lipid range in response to drinking ethanol (0.4 ± 0.1 mmol/L, FIGURE 2A); nor were cholesterol concentrations statistically different (2.4 ± 0.6 and 2.6 ± 0.6 mmol/L, respectively, FIGURE 2B). However, over the course of ethanol self-administration, plasma triglyceride concentrations varied differently between the groups over time (time × group interaction, P=0.0236), such that the hyperlipidemic alcohol-drinking monkeys had significant elevations in plasma triglycerides by 12 months (P=0.0133). After 19 months of alcohol consumption, plasma triglyceride concentrations in hyperlipidemic alcohol drinkers (1.8 ± 0.9 mmol/L) were double those of normolipidemic drinkers or controls (P<0.05, FIGURE 2A). Plasma cholesterol concentrations also varied differently between the groups over time (time × group interaction P=0.0488) and at 19 months cholesterol concentrations in all groups were significantly different from each other (P<0.05, FIGURE 2B). Plasma total lipids (sum of cholesterol and triglycerides) also varied differently between groups over time (time × group interaction P=0.0091) with increased plasma lipids apparent by 12 months (p<0.0196) and remaining elevated at 19 months (P<0.0003, FIGURE 2 C).
Figure 2. Plasma triglyceride and cholesterol concentrations.
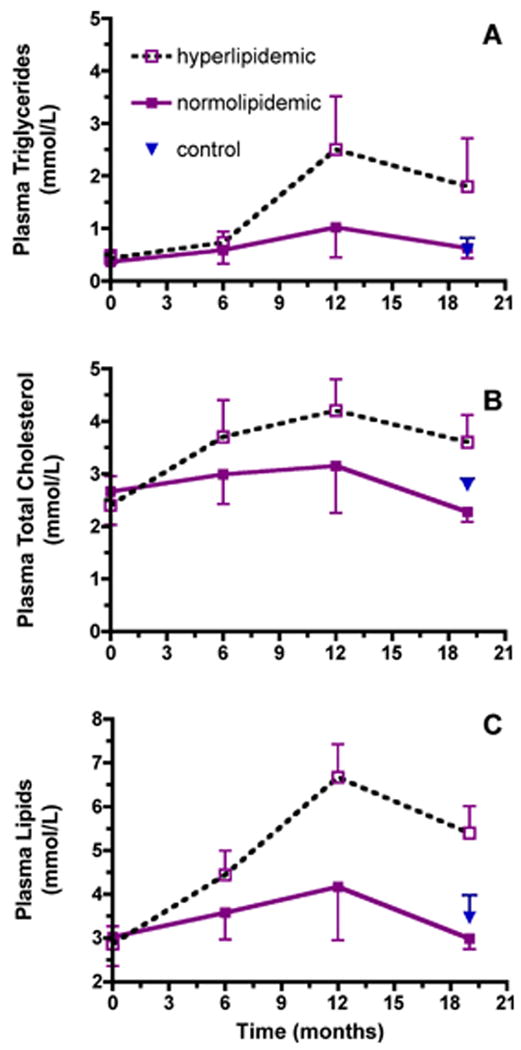
Time-course plasma triglyceride (A), total cholesterol (B) and total lipid (C) concentrations (mean ± SD) in normolipidemic (n=8 filled square, solid line) and hyperlipidemic drinkers (n=3, open square, dotted line) beginning prior to and ending at 19 months of alcohol consumption (normolipidemic (n=5 at 19 months). Plasma triglyceride concentrations varied differently between the groups over time (time × group interaction, P=0.0236); hyperlipidemic and normolipidemic drinkers were significantly different at 12 (P= 0.0133) months of alcohol consumption. At 19 months, plasma triglyceride concentrations in hyperlipidemics were significantly different from those in normolipidemic drinkers or controls (n=5, P<0.05). Plasma cholesterol concentrations varied differently between the groups over time (time × group interaction, P=0.0488); at 19 months the groups were significantly different from each other (P<0.05). Plasma total lipids (sum of cholesterol and triglycerides) also varied differently between groups over time (time × group interaction P=0.0091) with increased plasma lipids apparent by 12 months (p<0.0196) and remaining elevated at 19 months (P<0.0003).
Plasma α-tocopherol concentrations did not change over time and were not significantly different between groups (FIGURE 3A). However, α-tocopherol concentrations were positively correlated with plasma triglycerides (R=0.492, P<0.0001, FIGURE 4A) and plasma cholesterol concentrations (R=0.504, P<0.0001 FIGURE 4B). Since plasma α-tocopherol levels are dependent on lipoproteins for transport to peripheral tissues (Traber, 2007), plasma α-tocopherol concentrations were normalized to plasma triglyceride levels. Plasma α-tocopherol per triglyceride ratios were not statistically different between hyperlipidemic and normolipidemic drinkers at the onset of the experiment (FIGURE 3B). However, these ratios varied differently between groups (time × group interaction, P=0.0418), such that with alcohol exposure hyperlipidemic monkeys had nearly half the plasma α-tocopherol per triglyceride at necropsy compared with the normolipidemic drinkers or the controls (P<0.05, FIGURE 3B). It should be noted that plasma α-tocopherol per lipids or per cholesterol was not different between groups (Table 2).
Figure 3. Plasma α-tocopherol concentrations.
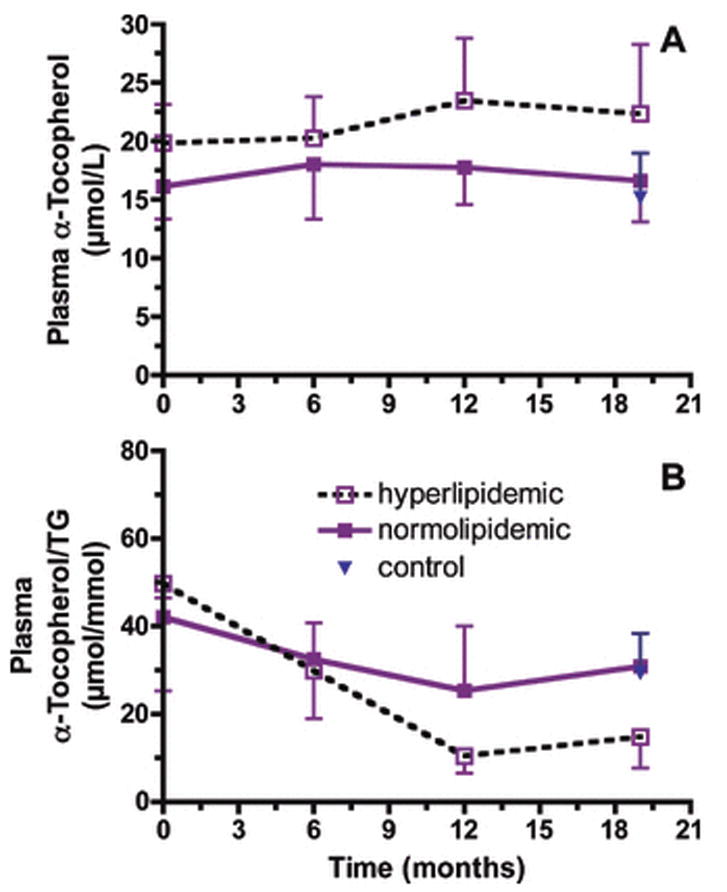
Plasma α-tocopherol concentrations (μmol/L, mean ± SD) did not change over time and were not significantly different between groups (A). Plasma α-tocopherol per triglyceride ratios (μmol/mmol, mean ± SD) varied differently between groups (time × group interaction, P=0.0418). Ratios at 19 months in hyperlipidemic animals were significantly less than those in the normolipidemic drinker (P<0.05) or control (P<0.05) monkeys.
Figure 4. Correlations between plasma α-tocopherol and triglycerides and cholesterol.
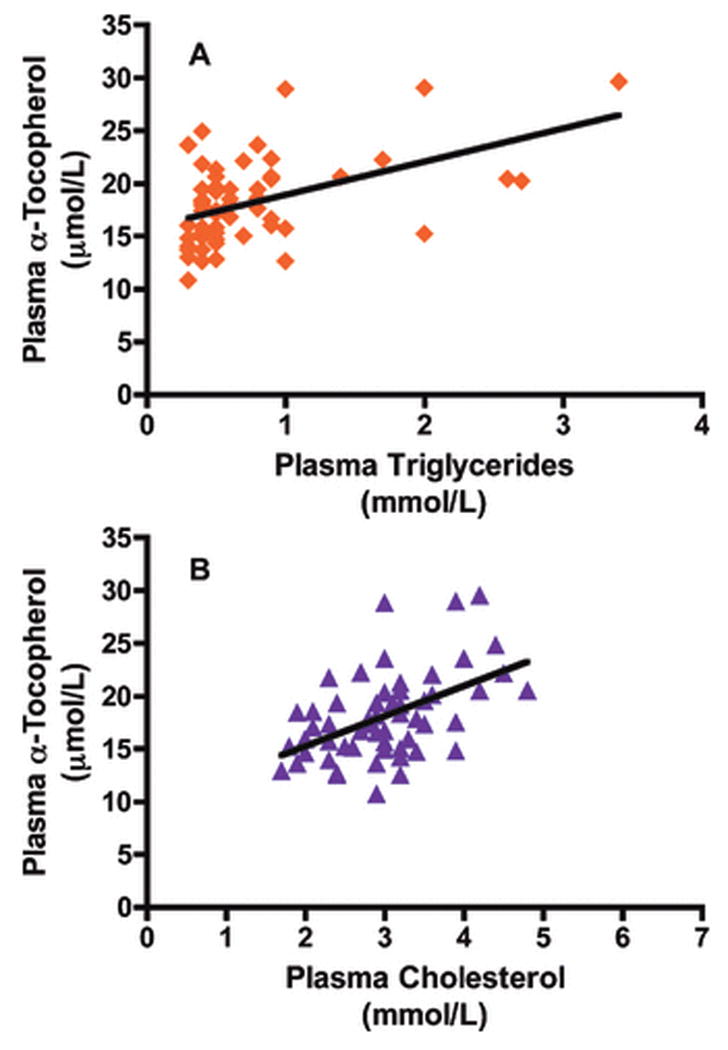
Correlations between plasma α-tocopherol and triglycerides (A) for all alcohol consuming monkeys and each sampled time point (R=0.492, P<0.0001). Correlation between plasma α-tocopherol and cholesterol (B) for all alcohol consuming monkeys and each sampled time point (R=0.502, P<0.0001).
Tissue α-tocopherol levels
Tissue α-tocopherol levels were evaluated in the normolipidemic, hyperlipidemic, and control monkeys. No statistically different α-tocopherol concentrations were found between groups for most of the evaluated tissues (such as small intestine, spleen, kidney, lung, adrenal, spinal cord, sciatic nerve, Table 3). However, important differences were detected in the liver (discussed below) and the adipose tissue. Adipose tissue α-tocopherol concentrations have been used to assess vitamin E status in humans, serving as indicators of vitamin E depletion (Traber et al., 1987). Hyperlipidemic animals had adipose tissue α-tocopherol concentrations less than half of those in either the controls or the normolipidemic drinkers (P<0.05, FIGURE 5A). In the control animals, the adipose tissue α-tocopherol concentrations were linearly related to body weights with higher body weights associated with lower α-tocopherol concentrations (P<0.0269, r2=0.8463, FIGURE 5B). Except for the two alcohol drinkers with the lowest body weights, all of the alcohol drinking monkeys' adipose tissue α-tocopherol concentrations were less than predicted and fell outside the 95% confidence interval of the relationship observed in the control non-drinking monkeys, suggesting that the adipose tissue α-tocopherol concentrations were becoming depleted. This suggestion is also supported by the body composition data that show that the percentage of fat mass increased similarly in all groups over time (FIGURE 1B).
Table 3. Tissue α-tocopherol concentrations (nmol/g).
| N= | Liver | Small intestine | Spleen | Kidney | Lung | Adrenal | Spinal cord | Sciatic nerve | |
|---|---|---|---|---|---|---|---|---|---|
| Hyperlipidemic Drinkers | 3 | 47±15* | 15±1 | 25±7 | 26±1 | 24±4 | 351±227 | 45±3 | 24±16 |
| Normolipidemic Drinkers | 8 | 65±13 | 17±11 | 27±8 | 22±5 | 28±12 | 280±157 | 44±9 | 17±6 |
| Controls | 5 | 70±15 | 14±5 | 28±9 | 21±4 | 19±15 | 227±69 | 42±10 | 25±21 |
P= 0.080
Figure 5. Adipose tissue α-tocopherol.
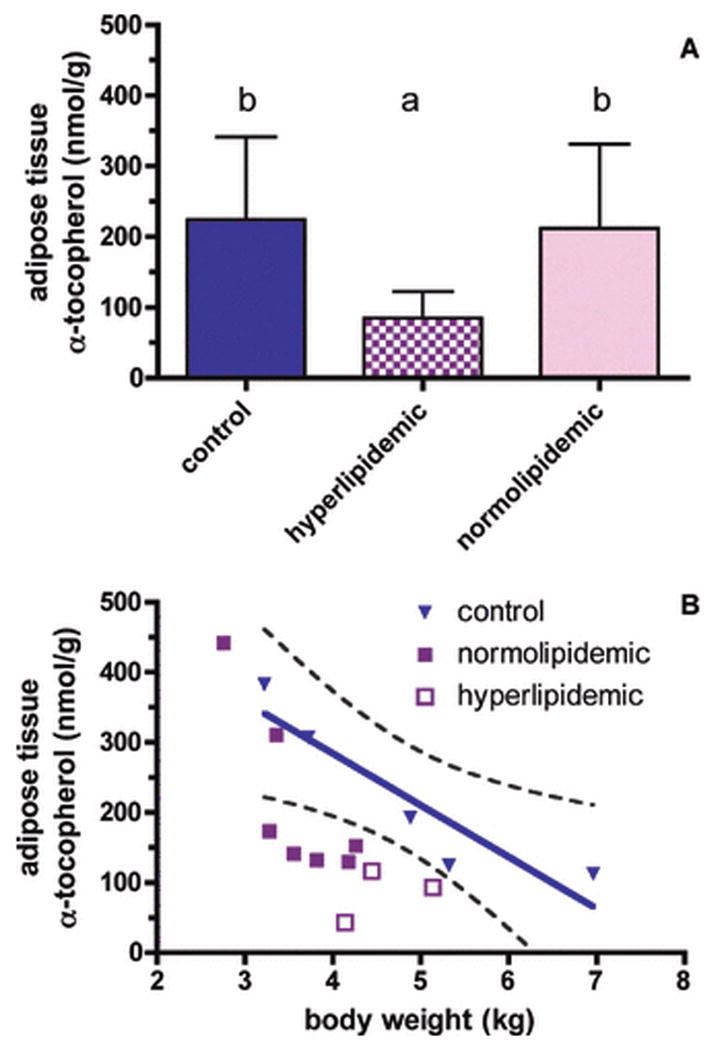
A. Adipose tissue α-tocopherol concentrations (nmol/g, mean ± SD) of control (open bars), normolipidemic (filled bars), and hyperlipidemic drinking (hashed bars) monkeys after 19 months of chronic ethanol consumption were significantly different (ANOVA, P=0.0497), with hyperlipidemics less than either controls or normolipidemic monkeys (paired comparisons, P<0.05).
B. Relationship between body weight and adipose tissue α-tocopherol concentrations in control animals after 19 months of chronic ethanol consumption (p<0.0269, r2=0.8463, 95% confidence interval is shown as a dotted line).
Liver α-tocopherol concentrations, α-tocopherol transfer protein mRNA expression levels and α-CEHC concentrations
The hyperlipidemic alcohol drinkers' liver α-tocopherol concentrations were about two thirds of those in either the normolipidemic drinkers or control animals (P=0.080, Table 3). Liver α-tocopherol concentrations are regulated both by secretion into plasma and by metabolism (Traber, 2007). To evaluate whether α-TTP was up-regulated to increase secretion into the plasma, α-TTP mRNA expression levels were assessed, but there were no statistically significant differences between groups (data not shown). Moreover, α-TTP expression levels were not correlated with liver or plasma α-tocopherol concentrations. Thus, the lower liver α-tocopherol concentrations observed were not associated with changes in α-TTP gene expression.
To assess vitamin E metabolism, liver α-CEHC concentrations were measured. α-CEHC excretion increases with excess vitamin E intake (Schultz et al., 1995); consequently, there has been interest in using α-CEHC concentrations as a measure of vitamin E excess. There was an insufficent sample amount for α-CEHC measurement in one hyperlipidemic animal, so the data from the remaining two hyperlipidemic and the normolipidemic alcohol drinkers have been averaged. Liver α-CEHC concentrations in the alcohol drinking monkeys (0.07 ± 0.05) were half of those in the control group (0.13 ± 0.06 nmol/g, P<0.05). The relationship between alcohol consumption and liver α-CEHC production was evaulated for all alcohol consuming animals. Higher alcohol intake corresponded with lower liver α-CEHC concentrations (P=0.0027, r2=0.7468, FIGURE 6).
Figure 6. Correlation between liver α-CEHC concentrations and alcohol intake.
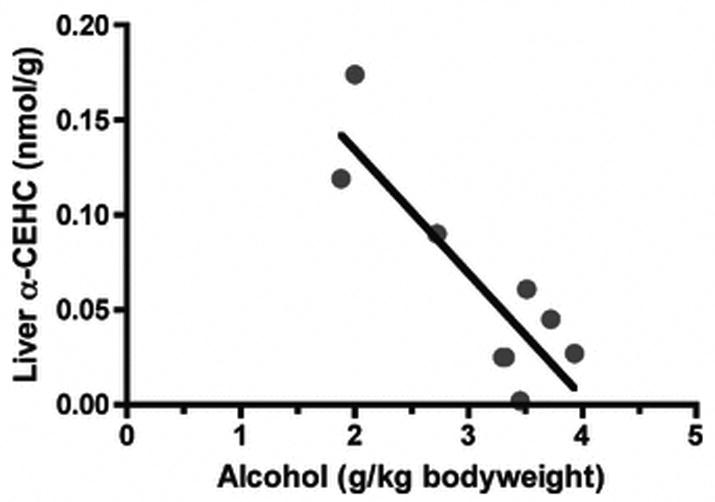
Alcohol consuming monkeys liver α-CEHC concentrations correlated with ethanol intake at 19 months of alcohol drinking (R=-0.9377, P<0.005).
Biomarker Analysis
Multiplex analysis of 90 known plasma cytokines, growth factors, and other proteins was carried out for the purpose of identifying biochemical markers of ethanol intake (Freeman et al., 2010) as well as to further discern the underlying differences between normolipidemic and hyperlipidemic animals. Sixty-one of the 90 proteins were present at detectable levels. We selected proteins for analysis that are involved in lipoprotein metabolism, inflammation and liver function. We found that apolipoprotein A-I (apo A-I), apolipoprotein(a) (Lp(a)), interleukin-6 (IL-6), macrophage inflammatory protein-1 alpha (MIP-1 alpha), serum glutamic oxaloacetic transaminase (SGOT) were unchanged over time or between any of the groups (Table 4).
Table 4. Plasma protein analysis.
| Apolipoprotein A-I (Apo A-I) | Apolipoprotein(a) (Lp(a)) | Interleukin-6 (IL-6) | Macrophage Inflammatory Protein-1 alpha (MIP-1 alpha) | Serum Glutamic Oxaloacetic Transaminase (SGOT) | ||
|---|---|---|---|---|---|---|
| Samples | time | mg/mL | μg/mL | pg/mL | pg/mL | μg/mL |
| Control (n=5) | 0 | 0.19 ± 0.03 | 86 ± 32 | 3.3 ± 1.2 | 136 ± 13 | 7.5 ± 1.7 |
| 12 | 0.18 ± 0.05 | 88 ± 34 | 3.3 ± 1.6 | 119 ± 24 | 5.8 ± 1.2 | |
| 18 | 0.19 ± 0.03 | 95 ± 30 | 2.8 ± 1.2 | 116 ± 20 | 6.5 ± 1.3 | |
| Normolipidemic drinkers (n=8) | 0 | 0.19 ± 0.06 | 72 ± 31 | 4.2 ± 1.7 | 182 ± 52 | 5.2 ± 0.8 |
| 12 | 0.20 ± 0.05 | 70 ± 25 | 3.6 ± 1.9 | 145 ± 41 | 6.2 ± 1.6 | |
| 18 | 0.20 ± 0.03 | 67 ± 25 | 2.5 ± 0.7 | 138 ± 59 | 6.5 ± 1.7 | |
| Hyperlipidemic drinkers (n=3) | 0 | 0.18 ± 0.05 | 97 ± 35 | 4.7 ± 5.7 | 168 ± 45 | 5.5 ± 1.1 |
| 12 | 0.18 ± 0.05 | 81 ± 21 | 2.9 ± 0.7 | 149 ± 37 | 5.1 ± 1.6 | |
| 18 | 0.16 ± 0.03 | 74 ± 22 | 2.8 ± 0.7 | 139 ± 40 | 6.9 ± 1.6 |
Plasma apolipoprotein CIII (apo CIII) concentrations were evaluated since apo CIII is thought to have a role in the metabolic defects leading to hypertriglyceridemia (Zheng et al., 2010). Plasma apo CIII concentrations changed differently over time in the three groups (time × group interaction, P=0.0007, FIGURE 7A). While there were no changes in apo CIII concentrations in the controls over time, apo CIII increased compared to baseline at both the 12 and 19 month time points in the normolipidemic (P=0.0016 and P=0.0028, respectively) and in the hyperlipidemic drinkers (P<0.05 and P<0.05, respectively).
Figure 7. Plasma apolipoprotein CIII, apolipoprotein H and C-reactive protein concentrations.
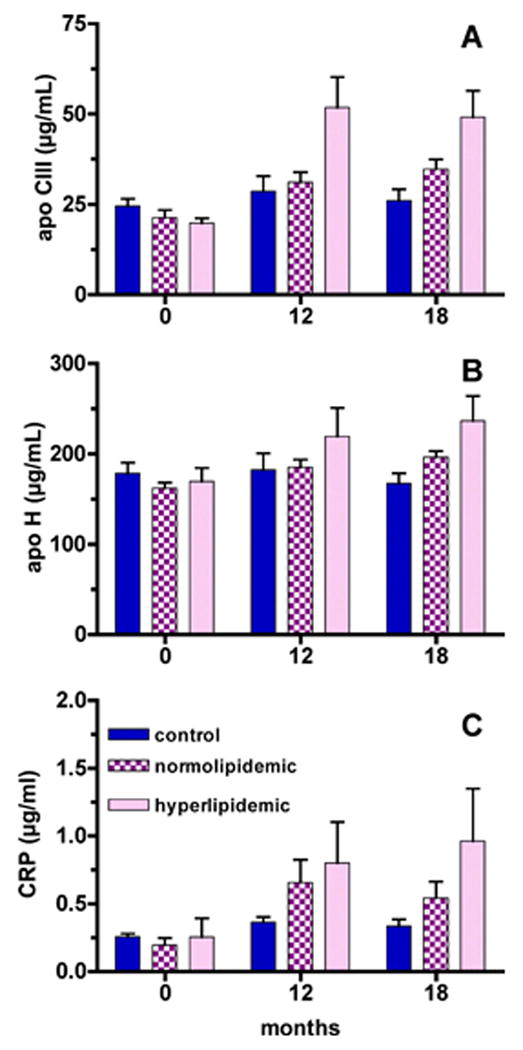
A. Plasma apo CIII concentrations changed differently over time in the three groups (time × group interaction, P=0.0007). Apo CIII was increased compared to baseline at both the 12 and 19 month time points in the normolipidemic (P=0.0016 and P=0.0028, respectively) and hyperlipidemic drinkers (P<0.05 and P<0.05, respectively).
B. Plasma apo H concentrations changed differently over time in the three groups (time × group interaction, P=0.0001). At 19 months both hyperlipidemics and normolipidemic drinkers had elevated apo H concentrations, but only hyperlipidemics (P<0.05) had significantly greater apo H concentrations than control animals.
C. CRP was increased compared to baseline at both the 12 and 19 month time points in the normolipidemic (P=0.005 and P=0.0153, respectively) and hyperlipidemic drinkers (P=0.016 and P=0201, respectively).
Plasma apolipoprotein H (apo H) concentrations have also been found to change with hyperlipidemia (Takada et al., 2003). Plasma apo H concentrations changed differently over time in the three groups (time × group interaction, P=0.0001, Figure 7B). At 19 months both hyperlipidemic and normolipidemic drinkers had elevated apo H concentrations, but only hyperlipidemics (P<0.05) had significantly greater apo H concentrations than control animals.
C-reactive protein (CRP), a marker of inflammation, also increased with time in the alcohol drinkers. CRP was increased compared to baseline at both the 12- and 19-month time points in the normolipidemic (P=0.005 and P=0.0153, respectively) and hyperlipidemic drinkers (P=0.016 and P=0.0201, respectively).
Discussion
The aim of our study was to determine the effect of chronic alcohol consumption on vitamin E status. Vitamin E is transported throughout the body incorporated in lipoproteins and is dependent upon changes in lipoprotein status. Plasma α-tocopherol concentrations for all time points from all monkeys were positively correlated with plasma cholesterol and triglycerides concentrations, confirming the dependence of plasma α-tocopherol concentrations on circulating lipid levels (Figure 3). Three monkeys, after consuming alcohol for 19 months, demonstrated a significant ethanol-induced increase in plasma cholesterol and triglycerides, a decrease in plasma α-tocopherol relative to triglycerides (Figure 3B), depleted adipose tissue α-tocopherol concentrations (Figure 5), and a trend toward decreased liver α-tocopherol concentrations (Table 2). Taken together these data support the notion that chronic alcohol consumption depletes vitamin E stores. Specifically, the liver continues to supply α-tocopherol to the plasma, a suggestion supported by the lack of response of liver α-TTP mRNA expression to alcohol exposure, while defective triglyceride metabolism results in the depletion of adipose tissue α-tocopherol. The apo CIII concentrations support the idea that continued alcohol consumption causes an altered triglyceride catabolism since apo CIII is a lipoprotein lipase inhibitor, has been found to be elevated in metabolic syndrome (Onat et al., 2003) and increases with alcohol intake in humans (Lecomte et al., 1996).
Alternatively, vitamin E is released from the adipose tissue to support plasma and liver concentrations, but with the continued input of alcohol and alterations in plasma lipids and lipoproteins, vitamin E becomes depleted from the liver. In support of the concept of disordered lipid metabolism affecting vitamin E status, high plasma cholesterol was associated with both low adipose tissue α-tocopherol concentrations (R=-0.669, P=0.009) and low liver tissue α-tocopherol (R=0.488, P=0.055). It is noteable that apo A-I was not different between the groups, suggesting that HDL cholesterol also was not different. HDL might be expected in increase with alcohol intake; however, chronic excessive alcohol consumption in humans decreases HDL concentrations (Johansen et al., 2003). Notably, no other tissues, including the nervous tissue, were found to be α-tocopherol depleted (Table 3). Previously, Nelson et al (Nelson et al., 1981) showed in rhesus monkeys fed a vitamin E deficient diet that vitamin E deficiency symptoms, especially neurologic abnormalities, were present after 30 to 33 months of vitamin E deficiency. Thus, the 19 months of alcohol exposure may be insufficient to cause detectable vitamin E deficiency symptoms in monkeys on a diet containing vitamin E. It should be noted that there were no significant differences in food intake, and therefore vitamin E intake, between groups (Table 1).
Chronic ethanol consumption also affected hepatic vitamin E metabolism. Unlike other fat-soluble vitamins, α-tocopherol is not accumulated to toxic levels in tissue and any excess is metabolized by the liver to α-CEHC (Traber, 2007). Liver α-CEHC concentrations were lower in alcohol consuming monkeys compared to controls. Moreover, as more ethanol was consumed, the liver produced less α-CEHC (Figure 6), suggesting α-tocopherol and ethanol have interconnected metabolic pathways. Alternatively, less vitamin E was available for metabolism, therefore, less metabolite was produced; a suggestion that is consistent with a reduction in vitamin E status seen in this study.
CRP is an acute-phase response protein used as a marker of inflammation and tissue damage that has been shown to increase with high levels of alcohol consumption (Imhof et al., 2001). Thus, the marked increase in CRP for all alcohol-consuming monkeys likely resulted from an inflammatory response to alcohol exposure or alcoholic liver damage. However, in this study we did not see an increase in plasma IL-6, which has been shown to increase with chronic ethanol consumption and is a transcriptional regulator of CRP (Achur et al., 2010; Pepys and Hirschfield, 2003). We also did not see an increase in SGOT, a sign of acute liver injury that has been shown to increase with 24 months of chronic ethanol consumption in cynomolgus monkeys (Ivester et al., 2007). Thus, it is difficult to conclude that the rise in CRP values resulted from either inflammation or tissue damage. Alternatively, one of the proposed biological functions of CRP is to bind oxidized lipoproteins by recognizing oxidized phosphatidylcholine on the surface of lipoprotein particles (Chang et al., 2002). It is possible, although equally difficult to conclude, that the increase in CRP resulted from an increase in oxidized lipoproteins due to the vitamin E depleted nature of the plasma. Interestingly, Pepys and Hirschfield (Pepys and Hirschfield, 2003) noted that the type of ligands bound by CRP overlap those of anti-phospholipid auto-antibodies associated with autoimmune disorders. Apo H is a well-documented binding co-factor of anti-phospholipid antibodies to oxidized phospholipids; apo H is also found to be abnormally elevated during hyperlipidemia and is thought to act as a lipoprotein lipase activator (Crook, 2010). All of the alcohol consuming animals demonstrated an increase in apo H, hyperlipidemics more so than normolipidemics, but whether that increase is a result of a counter effect to the increase in apo CIII (as a lipoprotein lipase inhibitor), a secondary effect to the ethanol-induced hyperlipidemia, or a response to oxidized lipoproteins, is beyond the scope of this paper.
A limitation of this study is the relatively small sample size of 11 alcohol drinking monkeys, of which three became hyperlipidemic. The data on adipose tissue vitamin E concentrations (Figure 5) suggest that alcohol drinking monkeys are on a continuum of increasing abnormalities in lipoprotein metabolism along with vitamin E depletion and that over time further abnormalities will accumulate. It also should be emphasized that the human literature also shows individual differences in ethanol's ability to increase triglycerides and in this manner the monkey model may help identify who is at risk for oxidative stress due to altered fat metabolism and vitamin E status. Unlike humans, the monkeys were given a balanced diet with adequate vitamin E intakes. Based on daily food intake of approximately 55 g/day/kg and 51 IU all rac α-tocopherol/kg diet with the conversion factor of 0.45 mg 2R-α-tocopherol/IU (Food and Nutrition Board and Institute of Medicine, 2000), the approximate intake is 1.3 mg 2R-α-tocopherol or about 0.3 mg/kg body weight. More than 90% of Americans do not consume the estimated average recommended (EAR) vitamin E intake of 12 mg 2R-α-tocopherol daily (Ahuja et al., 2004; Maras et al., 2004). Based on a 70 kg person, then the EAR is 0.2 mg/kg body weight. Thus, the significance to humans may even be greater than this manuscript indicates because of the relatively lower vitamin E intakes in humans.
In conclusion, the amount of ethanol self-administered by the monkeys in this study did not deplete plasma and tissue α-tocopherol concentrations directly. However, once normalized to plasma triglyceride concentrations, the α-tocopherol depleted state of the plasma is apparent. Importantly, the alterations in lipid metabolism resulted in diminished α-tocopherol in the adipose and liver tissue potentially increasing the susceptiblity of these tissues to oxidative stress and damage.
Acknowledgments
The excellent technical expertise of the following individuals is gratefully acknowledged: Andrew Rau and Misa Odagiri for technical expertise in the self-administration studies and Dimitri Boss and Dr. Lois Colgin for technical expertise at necropsy. This study was supported in part by funds from the Linus Pauling Institute and from NIH grants AA13510 and AA016613.
References
- Achur RN, Freeman WM, Vrana KE. Circulating cytokines as biomarkers of alcohol abuse and alcoholism. J Neuroimmune Pharmacol. 2010;5:83–91. doi: 10.1007/s11481-009-9185-z. [DOI] [PMC free article] [PubMed] [Google Scholar]
- Ahuja JK, Goldman JD, Moshfegh AJ. Current status of vitamin E nutriture. Ann N Y Acad Sci. 2004;1031:387–390. doi: 10.1196/annals.1331.052. [DOI] [PubMed] [Google Scholar]
- Barden A, Zilkens RR, Croft K, Mori T, Burke V, Beilin LJ, Puddey IB. A reduction in alcohol consumption is associated with reduced plasma F2-isoprostanes and urinary 20-HETE excretion in men. Free Radic Biol Med. 2007;42:1730–1735. doi: 10.1016/j.freeradbiomed.2007.03.004. [DOI] [PubMed] [Google Scholar]
- Bjorneboe A, Bjorneboe GE. Antioxidant status and alcohol-related diseases. Alcohol Alcohol. 1993;28:111–116. [PubMed] [Google Scholar]
- Bjorneboe GA, Johnsen J, Bjorneboe A, Morland J, Drevon CA. Effect of heavy alcohol consumption on serum concentrations of fat-soluble vitamins and selenium. Alcohol Alcohol Suppl. 1987a 1:533–537. [PubMed] [Google Scholar]
- Bjorneboe GE, Bjorneboe A, Hagen BF, Morland J, Drevon CA. Reduced hepatic alpha-tocopherol content after long-term administration of ethanol to rats. Biochim Biophys Acta. 1987b;918:236–241. doi: 10.1016/0005-2760(87)90226-8. [DOI] [PubMed] [Google Scholar]
- Bjorneboe GE, Johnsen J, Bjorneboe A, Bache-Wiig JE, Morland J, Drevon CA. Diminished serum concentration of vitamin E in alcoholics. Ann Nutr Metab. 1988a;32:56–61. doi: 10.1159/000177408. [DOI] [PubMed] [Google Scholar]
- Bjorneboe GE, Johnsen J, Bjorneboe A, Marklund SL, Skylv N, Hoiseth A, Bache-Wiig JE, Morland J, Drevon CA. Some aspects of antioxidant status in blood from alcoholics. Alcohol Clin Exp Res. 1988b;12:806–810. doi: 10.1111/j.1530-0277.1988.tb01350.x. [DOI] [PubMed] [Google Scholar]
- Cederbaum AI. Introduction-serial review: alcohol, oxidative stress and cell injury. Free Radic Biol Med. 2001;31:1524–1526. doi: 10.1016/s0891-5849(01)00741-9. [DOI] [PubMed] [Google Scholar]
- Chang MK, Binder CJ, Torzewski M, Witztum JL. C-reactive protein binds to both oxidized LDL and apoptotic cells through recognition of a common ligand: Phosphorylcholine of oxidized phospholipids. Proc Natl Acad Sci U S A. 2002;99:13043–13048. doi: 10.1073/pnas.192399699. [DOI] [PMC free article] [PubMed] [Google Scholar]
- Crook MA. Apolipoprotein H: its relevance to cardiovascular disease. Atherosclerosis. 2010;209:32–34. doi: 10.1016/j.atherosclerosis.2009.11.022. [DOI] [PubMed] [Google Scholar]
- Food and Nutrition Board Institute of Medicine . Dietary Reference Intakes for Vitamin C, Vitamin E, Selenium, and Carotenoids. National Academy Press; Washington: 2000. [PubMed] [Google Scholar]
- Freeman WM, Salzberg AC, Gonzales SW, Grant KA, Vrana KE. Classification of alcohol abuse by plasma protein biomarkers. Biological Psychiatry. 2010 doi: 10.1016/j.biopsych.2010.01.028. in press. [DOI] [PMC free article] [PubMed] [Google Scholar]
- Grant KA, Leng X, Green HL, Szeliga KT, Rogers LS, Gonzales SW. Drinking typography established by scheduled induction predicts chronic heavy drinking in a monkey model of ethanol self-administration. Alcohol Clin Exp Res. 2008;32:1824–1838. doi: 10.1111/j.1530-0277.2008.00765.x. [DOI] [PMC free article] [PubMed] [Google Scholar]
- Grattagliano I, Vendemiale G, Errico F, Bolognino AE, Lillo F, Salerno MT, Altomare E. Chronic ethanol intake induces oxidative alterations in rat testis. J Appl Toxicol. 1997;17:307–311. doi: 10.1002/(sici)1099-1263(199709)17:5<307::aid-jat446>3.0.co;2-q. [DOI] [PubMed] [Google Scholar]
- Hartman TJ, Baer DJ, Graham LB, Stone WL, Gunter EW, Parker CE, Albert PS, Dorgan JF, Clevidence BA, Campbell WS, Tomer KB, Judd JT, Taylor PR. Moderate alcohol consumption and levels of antioxidant vitamins and isoprostanes in postmenopausal women. Eur J Clin Nutr. 2005;59:161–168. doi: 10.1038/sj.ejcn.1602051. [DOI] [PubMed] [Google Scholar]
- Imhof A, Froehlich M, Brenner H, Boeing H, Pepys MB, Koenig W. Effect of alcohol consumption on systemic markers of inflammation. Lancet. 2001;357:763–767. doi: 10.1016/S0140-6736(00)04170-2. [DOI] [PubMed] [Google Scholar]
- Ivester P, Roberts LJ, 2nd, Young T, Stafforini D, Vivian J, Lees C, Young J, Daunais J, Friedman D, Rippe RA, Parsons CJ, Grant KA, Cunningham C. Ethanol self-administration and alterations in the livers of the cynomolgus monkey, Macaca fascicularis. Alcohol Clin Exp Res. 2007;31:144–155. doi: 10.1111/j.1530-0277.2006.00276.x. [DOI] [PubMed] [Google Scholar]
- Johansen D, Andersen PK, Jensen MK, Schnohr P, Gronbaek M. Nonlinear relation between alcohol intake and high-density lipoprotein cholesterol level: results from the Copenhagen City Heart Study. Alcohol Clin Exp Res. 2003;27:1305–1309. doi: 10.1097/01.ALC.0000081642.14093.C6. [DOI] [PubMed] [Google Scholar]
- Johansson U, Johnsson F, Joelsson B, Berglund M, Akesson B. Selenium status in patients with liver cirrhosis and alcoholism. Br J Nutr. 1986;55:227–233. doi: 10.1079/bjn19860029. [DOI] [PubMed] [Google Scholar]
- Lecomte E, Herbeth B, Paille F, Steinmetz J, Artur Y, Siest G. Changes in serum apolipoprotein and lipoprotein profile induced by chronic alcohol consumption and withdrawal: determinant effect on heart disease? Clin Chem. 1996;42:1666–1675. [PubMed] [Google Scholar]
- Lecomte E, Herbeth B, Pirollet P, Chancerelle Y, Arnaud J, Musse N, Paille F, Siest G, Artur Y. Effect of alcohol consumption on blood antioxidant nutrients and oxidative stress indicators. Am J Clin Nutr. 1994;60:255–261. doi: 10.1093/ajcn/60.2.255. [DOI] [PubMed] [Google Scholar]
- Leonard SW, Gumpricht E, Devereaux MW, Sokol RJ, Traber MG. Quantitation of rat liver vitamin E metabolites by LC-MS during high-dose vitamin E administration. J Lipid Res. 2005;46:1068–1075. doi: 10.1194/jlr.D400044-JLR200. [DOI] [PubMed] [Google Scholar]
- Lieber CS. Microsomal ethanol-oxidizing system (MEOS): the first 30 years (1968-1998)—a review. Alcohol Clin Exp Res. 1999;23:991–1007. [PubMed] [Google Scholar]
- Maras JE, Bermudez OI, Qiao N, Bakun PJ, Boody-Alter EL, Tucker KL. Intake of alpha-tocopherol is limited among US adults. J Am Diet Assoc. 2004;104:567–575. doi: 10.1016/j.jada.2004.01.004. [DOI] [PubMed] [Google Scholar]
- Marmillot P, Munoz J, Patel S, Garige M, Rosse RB, Lakshman MR. Long-term ethanol consumption impairs reverse cholesterol transport function of high-density lipoproteins by depleting high-density lipoprotein sphingomyelin both in rats and in humans. Metabolism. 2007;56:947–953. doi: 10.1016/j.metabol.2007.03.003. [DOI] [PMC free article] [PubMed] [Google Scholar]
- McDonough KH. Antioxidant nutrients and alcohol. Toxicology. 2003;189:89–97. doi: 10.1016/s0300-483x(03)00155-0. [DOI] [PubMed] [Google Scholar]
- Nelson JS, Fitch CD, Fischer VW, Brown GO, Jr, Chou AC. Progressive neuropathologic lesions in vitamin E deficient rhesus monkeys. J Neuropathol Exp Neurol. 1981;40:166–185. doi: 10.1097/00005072-198103000-00008. [DOI] [PubMed] [Google Scholar]
- Odeleye OE, Eskelson CD, Watson RR, Mufti SI, Chvapil M. Vitamin E reduction of lipid peroxidation products in rats fed cod liver oil and ethanol. Alcohol. 1991;8:273–277. doi: 10.1016/0741-8329(91)90353-x. [DOI] [PubMed] [Google Scholar]
- Onat A, Hergenc G, Sansoy V, Fobker M, Ceyhan K, Toprak S, Assmann G. Apolipoprotein C-III, a strong discriminant of coronary risk in men and a determinant of the metabolic syndrome in both genders. Atherosclerosis. 2003;168:81–89. doi: 10.1016/s0021-9150(03)00025-x. [DOI] [PubMed] [Google Scholar]
- Pepys MB, Hirschfield GM. C-reactive protein: a critical update. J Clin Invest. 2003;111:1805–1812. doi: 10.1172/JCI18921. [DOI] [PMC free article] [PubMed] [Google Scholar]
- Podda M, Weber C, Traber MG, Packer L. Simultaneous determination of tissue tocopherols, tocotrienols, ubiquinols, and ubiquinones. J Lipid Res. 1996;37:893–901. [PubMed] [Google Scholar]
- Qian J, Atkinson J, Manor D. Biochemical consequences of heritable mutations in the alpha-tocopherol transfer protein. Biochemistry. 2006;45:8236–8242. doi: 10.1021/bi060522c. [DOI] [PubMed] [Google Scholar]
- Schultz M, Leist M, Petrzika M, Gassmann B, Brigelius-Flohé R. Novel urinary metabolite of alpha-tocopherol, 2,5,7,8-tetramethyl-2(2′-carboxyethyl)-6-hydroxychroman, as an indicator of an adequate vitamin E supply? Am J Clin Nutr. 1995;62:1527S–1534S. doi: 10.1093/ajcn/62.6.1527S. [DOI] [PubMed] [Google Scholar]
- Seitz HK, Kuhn B, von Hodenberg E, Fiehn W, Conradt C, Simanowski UA. Increased messenger RNA levels for low-density lipoprotein receptor and 3-hydroxy-3-methylglutaryl coenzyme A reductase in rat liver after long-term ethanol ingestion. Hepatology. 1994;20:487–493. [PubMed] [Google Scholar]
- Situnayake RD, Crump BJ, Thurnham DI, Davies JA, Gearty J, Davis M. Lipid peroxidation and hepatic antioxidants in alcoholic liver disease. Gut. 1990;31:1311–137. doi: 10.1136/gut.31.11.1311. [DOI] [PMC free article] [PubMed] [Google Scholar]
- Sozio M, Crabb DW. Alcohol and lipid metabolism. Am J Physiol Endocrinol Metab. 2008;295:E10–16. doi: 10.1152/ajpendo.00011.2008. [DOI] [PMC free article] [PubMed] [Google Scholar]
- Takada D, Ezura Y, Ono S, Iino Y, Katayama Y, Xin Y, Wu LL, Larringa-Shum S, Stephenson SH, Hunt SC, Hopkins PN, Emi M. Apolipoprotein H variant modifies plasma triglyceride phenotype in familial hypercholesterolemia: a molecular study in an eight-generation hyperlipidemic family. J Atheroscler Thromb. 2003;10:79–84. doi: 10.5551/jat.10.79. [DOI] [PubMed] [Google Scholar]
- Teare JP, Greenfield SM, Watson D, Punchard NA, Miller N, Rice-Evans CA, Thompson RP. Lipid peroxidation in rats chronically fed ethanol. Gut. 1994;35:1644–1647. doi: 10.1136/gut.35.11.1644. [DOI] [PMC free article] [PubMed] [Google Scholar]
- Traber MG. Vitamin E regulatory mechanisms. Annu Rev Nutr. 2007;27:347–362. doi: 10.1146/annurev.nutr.27.061406.093819. [DOI] [PubMed] [Google Scholar]
- Traber MG, Burton GW, Hamilton RL. Vitamin E trafficking. Ann N Y Acad Sci. 2004;1031:1–12. doi: 10.1196/annals.1331.001. [DOI] [PubMed] [Google Scholar]
- Traber MG, Sokol RJ, Ringel SP, Neville HE, Thellman CA, Kayden HJ. Lack of tocopherol in peripheral nerves of vitamin E-deficient patients with peripheral neuropathy. N Engl J Med. 1987;317:262–265. doi: 10.1056/NEJM198707303170502. [DOI] [PubMed] [Google Scholar]
- Valls-Belles V, Torres Mdel C, Boix L, Muniz P, Gonzalez-Sanjose ML, Codoner-Franch P. alpha-Tocopherol, MDA-HNE and 8-OHdG levels in liver and heart mitochondria of adriamycin-treated rats fed with alcohol-free beer. Toxicology. 2008;249:97–101. doi: 10.1016/j.tox.2008.04.010. [DOI] [PubMed] [Google Scholar]
- Vignali DA. Multiplexed particle-based flow cytometric assays. J Immunol Methods. 2000;243:243–255. doi: 10.1016/s0022-1759(00)00238-6. [DOI] [PubMed] [Google Scholar]
- Vivian JA, Green HL, Young JE, Majerksy LS, Thomas BW, Shively CA, Tobin JR, Nader MA, Grant KA. Induction and maintenance of ethanol self-administration in cynomolgus monkeys (Macaca fascicularis): long-term characterization of sex and individual differences. Alcohol Clin Exp Res. 2001;25:1087–1097. [PubMed] [Google Scholar]
- You M, Fischer M, Deeg MA, Crabb DW. Ethanol induces fatty acid synthesis pathways by activation of sterol regulatory element-binding protein (SREBP) J Biol Chem. 2002;277:29342–29347. doi: 10.1074/jbc.M202411200. [DOI] [PubMed] [Google Scholar]
- Zheng C, Khoo C, Furtado J, Sacks FM. Apolipoprotein C-III and the metabolic basis for hypertriglyceridemia and the dense low-density lipoprotein phenotype. Circulation. 2010;121:1722–1734. doi: 10.1161/CIRCULATIONAHA.109.875807. [DOI] [PMC free article] [PubMed] [Google Scholar]