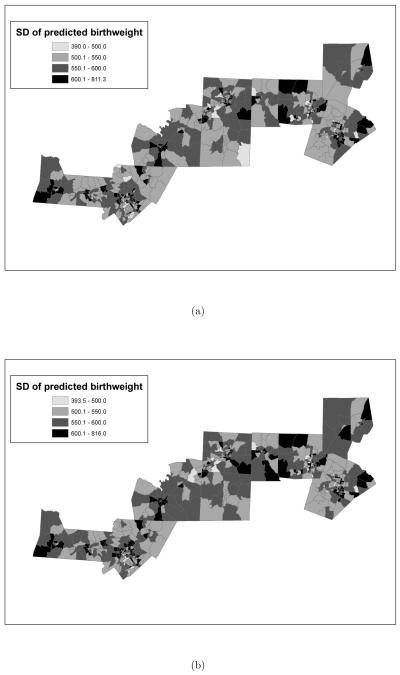
Figure 10.
Posterior predictive standard deviation of average birth weight (in grams) by census tract as obtained from the model where the exposure metric is: (a) “normalized area ambient exposure curve was above 15μg/m3 versus (b) “normalized area personal exposure curve was above 15μg/m3. Time window of exposure is the course of the entire pregnancy. Additionally, both posterior predictive standard deviations are reported in grams.

