Abstract
The tyrosine kinase c-Met promotes the formation and malignant progression of multiple cancers. It is well known that c-Met hyperactivation increases tumorigenicity and tumor cell resistance to DNA damaging agents, properties associated with tumor-initiating stem cells. However, a link between c-Met signaling and the formation and/or maintenance of neoplastic stem cells has not been previously identified. Here, we show that c-Met is activated and functional in glioblastoma (GBM) neurospheres enriched for glioblastoma tumor-initiating stem cells and that c-Met expression/function correlates with stem cell marker expression and the neoplastic stem cell phenotype in glioblastoma neurospheres and clinical glioblastoma specimens. c-Met activation was found to induce the expression of reprogramming transcription factors (RFs) known to support embryonic stem cells and induce differentiated cells to form pluripotent stem (iPS) cells, and c-Met activation counteracted the effects of forced differentiation in glioblastoma neurospheres. Expression of the reprogramming transcription factor Nanog by glioblastoma cells is shown to mediate the ability of c-Met to induce the stem cell characteristics of neurosphere formation and neurosphere cell self-renewal. These findings show that c-Met enhances the population of glioblastoma stem cells (GBM SCs) via a mechanism requiring Nanog and potentially other c-Met–responsive reprogramming transcription factors.
Keywords: cancer stem cell, hepatocyte growth factor, Sox2, Oct4, Klf4
Glioblastomas (GBMs) are heterogeneous aggressive neoplasms containing neoplastic stem-like cells (1). These cells commonly referred to as glioblastoma stem cells (GBM SCs), exhibit the capacity for unlimited growth as multicellular spheres in defined medium, multilineage differentiation, and efficient tumor initiation in immune-deficient animals. GBM SCs are currently believed to play a leading role in therapeutic resistance and tumor recurrence (2). Defining the origin(s) of GBM SCs and the biochemical/molecular pathways that support the stem-like tumor-initiating phenotype is of major importance.
Transcription factors such as Sox2, c-Myc, Klf4, Oct4, and Nanog have an essential role in sustaining the growth and self-renewal of embryonic stem (ES) cells. Introducing these transcription factors into mouse and human differentiated somatic cells results in their reprogramming into pluripotent ES-like cells called induced pluripotent stem (iPS) cells (3). Remarkable similarities exist between stem cell reprogramming and oncogenesis. Both processes are supported by alterations in the expression/function of similar collaborating genes perpetuating subpopulations of cells capable of indefinite self-renewal (4). Reprogramming transcription factors (RFs) display varying degrees of oncogenic potential, are overexpressed in human cancers, and their expression levels have been correlated with malignant progression and poor prognosis (5, 6). Loss of tumor suppressors such as p53 enhances the efficiency of iPS cell generation by RFs (7). These similarities implicate mechanisms by which the expression/function of endogenous RFs influences the malignant phenotype by supporting the formation and/or maintenance of neoplastic stem-like cells. However, the dynamic regulation of RFs and their influence on the neoplastic stem cell phenotype remain relatively unknown.
Signaling initiated by the receptor tyrosine kinase c-Met promotes the formation and malignant progression of multiple cancers including gliomas through autocrine/paracrine mechanisms activated by c-Met overexpression and/or expression of the c-Met ligand hepatocyte growth factor (HGF) (8). We and others have shown that c-Met activation enhances tumor cell resistance to DNA damage and enhances the tumor-initiating capacity of transformed cell lines, properties that have been attributed to the neoplastic stem cell phenotype (9–11). In this study, we specifically examine the influence of c-Met signaling on GBM-derived neurospheres that are enriched for GBM SCs. We show that c-Met is expressed and activated in GBM neurospheres and establish a unique functional relationship between c-Met signaling, RF expression, and the neoplastic SC phenotype. Our results suggest that the capacity for c-Met to support the GBM SC phenotype involves an endogenous dynamic mechanism analogous to cellular reprogramming.
Results
c-Met Signaling Is Activated in GBM-Derived Neurospheres.
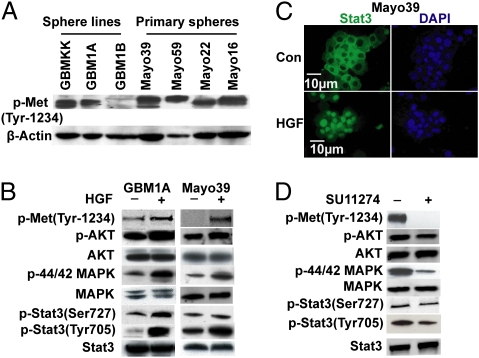
As a first step to determine whether c-Met regulates GBM SCs, we examined c-Met receptor expression, activation, and downstream signaling in human GBM-derived neurosphere lines shown previously by ourselves and others to be enriched in tumor-initiating neoplastic stem cells (12, 13), and in low-passage (<5) primary neurospheres derived directly from human GBM xenograft lines (developed and kindly provided by C. David James, University of California, San Francisco, CA) (14). As shown previously for established neurosphere lines, the primary neurospheres used in this study express the stem/progenitor cell markers Sox2, Nestin, and CD133 when maintained in serum-free neurosphere medium containing epidermal growth factor/fibroblast growth factor (EGF/FGF) and express the lineage-specific markers GFAP, Tuj1, and O4 when transferred to serum-containing medium after growth factor withdrawal (Fig. S1), consistent with their stem-like phenotype (1, 15). All of the GBM-derived neurospheres examined expressed various levels of activated (phospho-Tyr1234/35) c-Met (Fig. 1A). Stimulating neurospheres with the c-Met ligand HGF increased c-Met phosphorylation and activated known components of the c-Met signaling cascade, AKT, MAPK, and Stat3 (Fig. 1B). HGF also induced Stat3 translocation from cytosol to nucleus, consistent with its transcription factor function (Fig. 1C) (16). Conversely, treating neurospheres with the c-Met kinase inhibitors SU11274 or PF2341066 inhibited c-Met phosphorylation (Fig. 1D and Fig. S2). Inhibiting neurosphere c-Met kinase also reduced AKT, MAPK, and Stat3 phosphorylation (Fig. 1D). Thus, the c-Met pathway is functional and activated under basal growth conditions and subject to further activation in response to paracrine signals in GBM neurospheres.
Fig. 1.
c-Met is expressed and functional in GBM-derived neurospheres. (A) Immunoblots showing activated (phosphorylated) c-Met in multiple human GBM-derived neurospheres. (B) Neurosphere cells were cultured overnight without EGF/FGF and then ± (with or without) HGF for 15 min. HGF induces c-Met, AKT, MAPK, and Stat3 activation (phosphorylation). (C) Neurospheres were treated ± HGF for 3 h. Immunofluorescent micrographs of neurosphere cytospins show HGF-induced translocation of Stat3 (green) to DAPI-stained nuclei (blue). (D) Mayo39 neurosphere cells grown in neurosphere medium containing EGF/FGF were treated ± the c-Met inhibitor SU11274 for 1 h. Immunoblots show that SU11274 inhibits basal c-Met, AKT, MAPK, and Stat3 activation (phosphorylation).
c-Met Expression and Function Associates with Stem/Progenitor Cell Marker Expression in GBM-Derived Neurospheres.
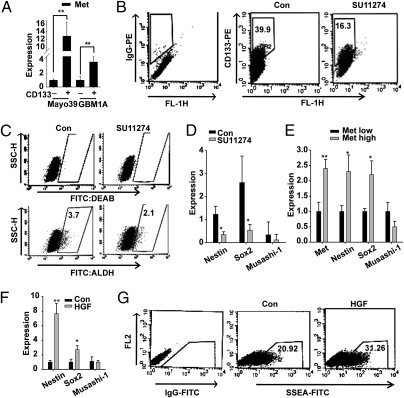
Numerous reports show that several markers including Sox2, Nestin, Musashi, aldehyde dehydrogenase (ALDH), CD133, and SSEA-1 are associated with and partially define the GBM SC (17–20). We asked whether these markers associate with c-Met expression and signaling. A comparison of neurosphere cell subpopulations revealed that CD133+ cells expressed substantially higher (up to 10-fold) levels of c-Met relative to CD133− cells (Fig. 2A). Treating neurospheres with the c-Met inhibitor SU11274 significantly reduced their proportions of CD133+ and ALDH+ cells by 59 ± 4% and 43 ± 6%, respectively (Fig. 2 B and C). qRT-PCR results also show that c-Met inhibition by SU11274 reduced neurosphere expression of Sox2 and Nestin (Fig. 2D). Similar effects on the percentage of CD133+ cells and on Sox2 and Nestin expression levels were observed in response to another specific c-Met inhibitor PF2341066 (Fig. S3). Neurosphere cells expressing high levels of c-Met (Met++) and low levels of c-Met (Met+) were isolated by flow cytometry (Fig. S4) and examined for stem cell marker expression. Met++ subpopulations expressed higher levels of Sox2 and Nestin relative to the Met+ cells (Fig. 2E). Moreover, c-Met activation by HGF in cells maintained in EGF/FGF-free medium induced Sox2 and Nestin (Fig. 2F) and increased the fraction of SSEA-1+ cells by 33% as determined by flow cytometry (Fig. 2G). Taken together, these results link c-Met function to subsets of stem-like cells within GBM neurospheres.
Fig. 2.
c-Met expression and function correlates with stem cell markers. (A) CD133+ and CD133− cells were isolated from GBM neurospheres using microbead-conjugated CD133 antibodies and magnetic columns (Miltenyi Biotec). CD133+ cells expressed higher levels of c-Met as determined by qRT-PCR. (B and C) GBM1A neurospheres, treated ± SU11274 for 7 d, were analyzed for CD133 expression (B) and ALDH expression (C) by flow cytometry. SU11274 reduced the CD133+ cell pool from 40% to 16% of total cells (P < 0.01) and reduced the ALDH+ pool from 3.7% to 2.1% (P < 0.05). (D) Treating Mayo39 neurospheres with SU11274 inhibits Nestin and Sox2 expression as determined by qRT-PCR. (E) Primary Mayo39 neurosphere cells expressing high and low levels of c-Met (Met++, Met+, respectively) were separated by flow cytometry (Fig. S4). qRT-PCR analysis shows that c-Met++ cells are enriched for Sox2 and Nestin expression. (F) GBM1A cells were treated ± HGF for 7 d in neurosphere medium lacking EGF/FGF. qRT-PCR analysis shows that HGF maintains high levels of Sox2 and Nestin. (G) GBM1A neurospheres were subjected to forced differentiation (1% FBS) and treated ± HGF for 5 d. HGF increased SSEA-1+ cells from 21% to 31% (P < 0.05) as determined by flow cytometry. *P < 0.05, **P < 0.01.
c-Met Signaling Supports the GBM SC Phenotype.
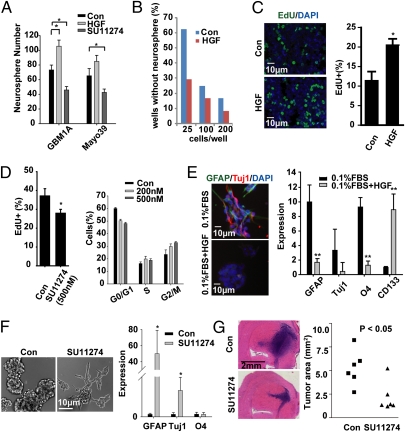
The capacity to form neurospheres is a biomarker of GBM cell stemness and correlates with tumor-initiating capacity (20). We evaluated the capacity of c-Met to regulate neurosphere formation, neurosphere cell proliferation and differentiation, and the formation of neurosphere-derived tumor xenografts. Neurospheres were dissociated to single cells and cultured ± (with or without) HGF or ± SU11274 in medium lacking EGF/FGF. HGF significantly enhanced the neurosphere forming capacity of GBM1A-derived cells by 31 ± 6%. There was a trend toward increased sphere formation in primary Mayo39-derived cells, which was not significant (Fig. 3A). Conversely, SU11274 significantly diminished the formation of neurospheres by both GBM1A and Mayo39-derived cells by 37% and 35%, respectively (Fig. 3A). Neurosphere formation was also inhibited by the chemically distinct c-Met inhibitor PF2341066 (Fig. S5A).
Fig. 3.
c-Met signaling supports the GBM SC phenotype. (A) Equal numbers of GBM-derived neurosphere cells were cultured ± HGF or the c-Met inhibitor SU11274 for 7 d and neurospheres (>100 μm diameter) were quantified. (B) GBM1A neurosphere cells were forced to differentiate and then incubated ± HGF and evaluated for neurosphere-forming capacity by limited dilution assay. Wells containing neurospheres >50 μm diameter were counted. Also see Fig. S5B. (C) GBM1A neurosphere cells were treated ± HGF for 24 h followed by EdU incorporation for 18 h. Fluorescence images and quantification show that HGF enhances neurosphere cell proliferation. (D) GBM1A neurospheres were treated ± SU11274 for 24 h followed by EdU incorporation (Left) or cell cycle analysis performed by flow cytometry (Right) (Fig. S5D). SU11274 inhibited cell proliferation and induced G2M arrest. (E) GBM1A neurospheres were treated ± HGF for 3 d and then subjected to induced differentiation conditions (0.1% FBS) ± HGF. HGF inhibited induction of lineage-specific markers as shown by immunofluorescence (Left) and qRT-PCR (Right). (F) Treating GBM1A neurospheres with SU11274 for 7 d induced cells to transition to an adherent growth pattern (Left) and express lineage-specific markers as determined by qRT-PCR (Right). (G) GBM1A neurospheres were treated ± SU11274 for 7 d and equal numbers of viable cells (5,000) were implanted to mouse brains (n = 6). Tumor sizes at postimplantation week 11 were quantified by computer-assisted analysis of H&E stained histological sections. SU11274 pretreatment inhibited xenograft growth. *P < 0.05, **P < 0.01.
Growth factor withdrawal in the presence of serum is a widely used method to force GBM SC differentiation (1, 15). To evaluate the capacity of c-Met activation to regulate the neurosphere-forming stem cell phenotype under more stringent conditions, neurosphere cells were first subjected to conditions of transient forced differentiation in serum-containing medium as shown in Fig. S1A. HGF induced these transiently predifferentiated cells to form neurospheres as determined by limited dilution assay (Fig. 3B and Fig. S5B). Consistent with its effect on neurosphere forming capacity, HGF significantly induced neurosphere cell proliferation as evidenced by a near doubling of EdU incorporation (Fig. 3C) and cell number (Fig. S5C). Conversely, treating neurospheres with SU11274 decreased EdU incorporation by 33 ± 5% (Fig. 3D) and promoted cell cycle changes consistent with arrest in the G2M phase (Fig. 3D and Fig. S5D). c-Met signaling also suppressed the capacity of neurosphere cells to respond to differentiation signals. HGF decreased the capacity of differentiating culture conditions to induce neurosphere cell adhesion, morphology change, and expression of the lineage-specific markers GFAP, Tuj1, and O4 (Fig. 3E). Conversely, neurosphere cells, grown in normal neurosphere medium, were induced to attach, form cell processes, and express lineage-specific differentiation markers in response to SU11274 (Fig. 3F). Finally, pretreating neurosphere cells with SU11274 before cell implantation to brain generated tumor xenografts that were 70% smaller than controls (Fig. 3G).
c-Met Induces Stem Cell Reprogramming Factors.
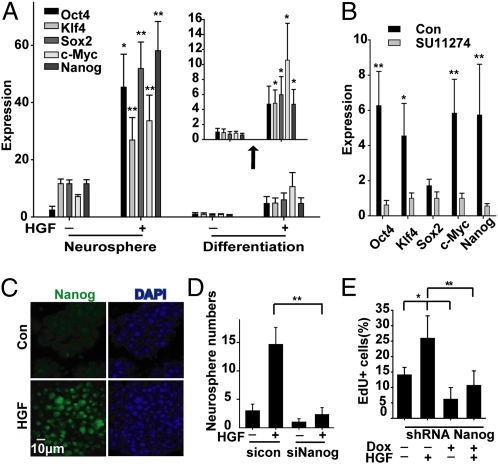
Our findings suggested that c-Met might regulate Sox2, Klf4, c-Myc, Oct4, and Nanog, transcription factors that are known to induce stem-like properties in differentiated cells (3). To test this hypothesis, expression of these transcription factors was quantified in GBM-derived neurospheres stimulated by HGF. Stimulating neurospheres with HGF for as briefly as 7 h significantly induced Sox2, c-Myc, Klf4, Oct4, and Nanog expression from two- to eightfold (Fig. 4A and Fig. S6A). To test the capacity of c-Met to induce reprogramming signals under more stringent conditions, neurosphere cells were first subjected to forced differentiation in serum-containing medium as shown in Fig. S1A before stimulation with HGF. Reprogramming factor expression decreased manyfold in response to differentiation culture conditions in control cells. HGF treatment induced the expression of all five transcription factors even after forced differentiation (Fig. 4A, Insert). Conversely, treating neurospheres with the c-Met inhibitors SU11274 or PF2341066 for 1 h inhibited basal expression of reprogramming factors (Fig. 4B and Fig. S6B). Nanog protein increased specifically within the nuclei of HGF-treated cells, consistent with its function as a transcription factor and similar to that seen during iPS cell formation (Fig. 4C and Fig. S6C) (21).
Fig. 4.
Role of reprogramming transcription factors in GBM neurosphere cell response to c-Met signaling. (A) Mayo39 GBM neurosphere cells were treated ± forced differentiation (1% FBS) and then ± HGF for 7 h in neurosphere medium lacking EGF/FGF. Forced differentiation inhibits reprogramming factor expression and HGF induces reprogramming transcription factor expression in both control and predifferentiated cells as determined by qRT-PCR. (B) GBM1A neurospheres were cultured in neurosphere medium and treated ± SU11274 for 1 h. Basal reprogramming factor expression is inhibited by SU11274. (C) Mayo39 GBM neurospheres were treated ± HGF for 7 h. Immunofluorescence staining of neurosphere cytospin shows that HGF induces nuclear Nanog. (D) GBM1A neurospheres were pretreated with siNanog RNA and then ± HGF. Inhibition of Nanog expression inhibits HGF-induced neurosphere formation. (E) GBM1A neurospheres engineered to stably express doxycycline-inducible sh-Nanog were treated ± HGF and evaluated for EdU incorporation as in Fig. 3C. Inhibiting Nanog induction inhibits HGF-induced neurosphere cell proliferation. See Fig. S7 for effects of si-Nanog and sh-Nanog on Nanog expression. *P < 0.05, **P < 0.01.
Nanog regulates neoplastic stem cells (22) and appears to be required to fully activate endogenous pluripotent transcriptional mechanisms in nonneoplastic cells (3, 22). Therefore, we asked whether Nanog expression is required for c-Met to induce the GBM stem-like phenotype using neurosphere-forming capacity and self-renewal as experimental endpoints. Two different gene silencing systems (siRNA and doxycycline-inducible shRNA) were used to inhibit Nanog induction by c-Met. qRT-PCR confirmed complete inhibition of HGF-induced Nanog expression by both siRNA-Nanog and doxycycline-induced shRNA-Nanog in GBM neurosphere cells (Fig. S7). Nanog expression knockdown significantly inhibited HGF-induced neurosphere formation by 84% and inhibited HGF-induced neurosphere cell proliferation by 61% (Fig. 4 D and E).
c-Met Expression Correlates with the Stem/Progenitor Phenotype in Clinical GBM Specimens.
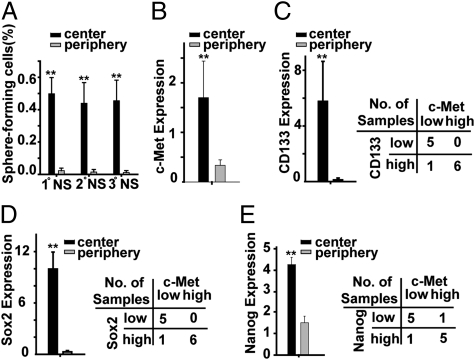
Whereas the topography of neoplastic stem cells within GBM remains somewhat uncertain, we (M.G., D.T., and B.S.) recently reported that the neoplastic stem-like cells within GBM preferentially localize at tumor centers relative to the peripheral tumor margins (23). Using an identical approach, cells derived from tumor specimens obtained from the “center” and “periphery” of six previously described GBMs resected at the University of Bonn Medical Center (23) were quantified for serial neurosphere-forming capacity, c-Met expression, and expression of Nanog, Sox2, and CD133. As previously reported, cells displaying the stem-like capacity to form neurospheres were much more abundant in specimens obtained from tumor centers compared with tumor peripheries (Fig. 5A). Likewise, the expression levels of c-Met, CD133, Nanog, and Sox2 were all significantly higher (5-, 44-, 2.8-, and 34-fold, respectively) in tumor centers compared with tumor peripheries (Fig. 5 B–E). Furthermore, tumor samples with high c-Met expression were shown to have statistically significantly higher CD133 expression (P = 0.05) and Sox2 expression (P = 0.02) (Fig. 5 C and D), and also demonstrated a trend toward higher Nanog expression (P = 0.08) (Fig. 5E). Consistent with this association between c-Met and Nanog expression in clinical specimens, we found that high c-Met expressing neurosphere cells expressed a 4-fold higher level of Nanog compared with low c-Met expressing cells (Fig. S8).
Fig. 5.
c-Met expression associates with the stem cell phenotype in clinical GBM specimens. (A) Cells obtained from the centers and peripheries of six GBMs (total of 12 samples) were evaluated for their capacity to form primary (1°), secondary (2°), and tertiary (3°) spheres as previously described (23). (B–E) c-Met, CD133, Sox2, and Nanog expression levels in the center and periphery biopsies of the six GBMs shown in A were determined by qRT-PCR. c-Met, CD133, Sox2, and Nanog expression levels are all higher in tumor centers relative to peripheries. C and E show that samples with high c-Met expression (expression cutoff >0.5 = median) were more likely to express high levels of CD133, Sox2, and Nanog. CD133, Sox2, and Nanog cutoffs were chosen to optimally predict high c-Met expression (P = 0.015, Fisher's exact test). Note: The expression cutoff for high CD133, Sox2, and Nanog (>0.1) is based on the comparison of CD133/c-Met high vs. CD133/c-Met low, Sox2/c-Met high vs. Sox2/c-Met low, and Nanog/c-Met high vs. Nanog/c-Met low (P = 0.05, P = 0.02, and P = 0.08, respectively; Wilcoxon signed-rank test). *P < 0.05, **P < 0.01.
Discussion
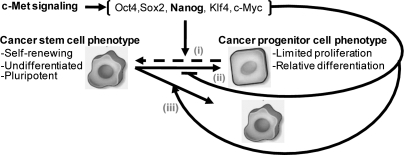
The relationship between GBM SCs and tumor “progenitor cells” that lack stem-like features remains unclear. Current paradigms emphasize a unidirectional path through which neoplastic SCs self-renew and generate neoplastic progenitors through cell division similar to the asymmetric division of nonneoplastic SCs (24). Mechanisms that disproportionately expand the pool of neoplastic SCs are expected to adversely influence patterns of tumor growth and recurrence, tumor responses to DNA-damaging agents, and responses to therapies designed to target the SC pool. One such pathway involves the tumor suppressor p53 that was found to regulate the polarity of SC division in neoplastic mammary cancer, with loss of p53 shifting the balance from asymmetric division to symmetric division (25). Neoplastic progenitors might also have the capacity to dedifferentiate into tumor-initiating SCs in a context-dependent manner and thereby expand the pool of neoplastic SCs. Whereas this potentiality is relatively unexplored, recent findings suggest that perivascular nitric oxide can induce neoplastic progenitors to acquire a SC phenotype via a Notch-dependent signaling cascade (26). We now show in this study that c-Met signaling can dynamically regulate glioma subpopulations and expand the pool of stem-like cells. The capacity for c-Met signaling to shift the heterogeneous composition of glioblastoma-derived neurosphere cells toward the SC phenotype could result from any of at least three cellular processes: (i) the reprogramming of more differentiated glioma progenitors, (ii) the inhibition of the SC response to differentiation signals, or (iii) a shift from asymmetric to symmetric SC division that would preferentially expand the SC pool (Fig. 6). Our findings that reprogramming factor expression is rapidly induced within 7 h of c-Met activation and that Nanog knockdown inhibits c-Met–dependent induction of neurosphere forming capacity and self-renewal support a molecular mechanism similar to cellular reprogramming. This interpretation is supported further by recent demonstrations that gastrointestinal cancer cells can be induced to express an embryonic stem-like state by the forced expression of Oct3/4, Sox2, Klf4, and c-Myc similar to the reprogramming of differentiated somatic cells to pluripotent embryonic SCs (27) and that the overexpression of E box binding transcription factors can induce differentiated somatic cells to generate neoplastic SCs (28).
Fig. 6.
Potential mechanisms by which c-Met signaling enhances the GBM SC pool. c-Met activation induces reprogramming transcription factors (Nanog, Sox2, Klf4, Oct4, and c-Myc) and increases the pool of cells displaying a stem-like phenotype. This response requires Nanog and potentially other reprogramming factors and might result from three possible mechanisms: (i) c-Met acts on GBM progenitor cells to induce their reprogramming to a more multipotent stem-like phenotype, (ii) c-Met inhibits GBM SC differentiation to progenitor cells, and/or (iii) c-Met enhances the disproportionate expansion of GBM SCs by preferentially inducing symmetric over asymmetric division.
There is growing evidence linking RFs to malignancy and neoplastic SC function in multiple cancers including glioblastoma. Nanog, which we found mediates the SC response to c-Met activation, is also an essential mediator of glioma SC response to hedgehog-Gli signaling (22). Silencing Sox2 inhibits the proliferation and tumorigenicity of GBM SCs (29). Knocking down c-Myc expression in GBM SCs induces cell cycle arrest at G0/G1, inhibits proliferation and increases apoptosis (30), and Oct4 loss-of-function alters neoplastic SC survival and invasion (31). Whereas these prior reports and our current findings point to important roles for Sox2, Klf4, c-Myc, Oct4, and Nanog in neoplastic stem cell biology, further studies are needed to determine how these transcriptional regulators function independently and/or cooperatively in response to dynamic contextual cues.
Functionally significant c-Met signaling has been demonstrated previously in human mesenchymal stem cells, neural stem cells, and rat hepatic stem cells but not in neoplastic stem cells (32, 33). We now show that c-Met signaling is activated and functional in isolated GBM-derived neurospheres enriched in tumor-initiating SCs and correlates with the topographical distribution of sphere-forming cells in clinical glioblastoma specimens. Our findings provide unique insights into the dynamic regulation of GBM SCs and suggest unique SC-dependent mechanisms by which c-Met signaling and potentially other oncogenic pathways contribute to GBM growth and recurrence. We provide evidence that c-Met signaling induces glioma malignancy, at least in part, by supporting the pool of GBM SCs. The capacity for c-Met to support the neoplastic SC phenotype is particularly relevant in light of the autocrine/paracrine mechanisms of c-Met hyperactivation including receptor and/or HGF overexpression in multiple solid malignancies (8–11). Our findings suggest that c-Met pathway inhibitors could serve as an adjunct to other therapeutic strategies designed to target neoplastic SCs.
Materials and Methods
GBM Neurosphere Culture and Differentiation.
Human GBM neurosphere lines and low passage (<5) primary neurospheres were derived and characterized as described previously and in Fig. S1 (1, 34). Stock neurospheres were cultured in serum-free neurosphere medium containing EGF/FGF as previously described (12). Forced differentiation was performed according to the method of Galli et al. (1) with some modifications (12). Briefly, the neurosphere cells were cultured on matrigel in FGF (no EGF)-containing neurosphere medium for 2 d and then grown in 1% FBS without EGF/FGF for 5 d, unless otherwise indicated.
Neurosphere Formation Assay.
Dissociated viable cells were cultured overnight in neurosphere medium lacking EGF/FGF before treatment ± HGF (100 ng/mL, a gift from Genentech, San Francisco, CA) or c-Met inhibitor SU11274 (or PF2341066) for 7 d. Neurospheres were fixed in neurosphere medium with 1% agarose. The numbers of neurospheres were counted by computer-assisted image analysis. For limited dilution assay, neurospheres were forced to differentiate and then single predifferentiated cells were seeded at various densities (25–200 cells per well in 48-well plates) and cultured ± HGF in neurosphere medium lacking EGF/FGF for 7 d, followed by normal neurosphere medium containing EGF/FGF for 2 wk. Each well was then examined for neurosphere formation. Cells derived from center and periphery GBM specimens were evaluated for neurosphere-forming capacity as previously reported (23) and described in SI Materials and Methods.
Immunofluorescence.
Neurosphere cells were collected by cytospin onto glass slides, fixed with 4% paraformaldehyde, and immunostained with anti-Stat3 (Cell Signaling), anti-GFAP, anti-Tuj1 (Millipore), and anti-Nanog (R&D Systems) antibodies essentially according to manufacturers’ protocols. Secondary antibodies were conjugated with Alexa 488 or Cy3. Coverslips were placed with Vectashield antifade solution containing 4′6-diamidino-2-phenylindole (Vector Laboratories). Immunofluorescent images were analyzed using Axiovision software (Zeiss).
Quantitative Real-Time PCR.
Total RNA was extracted using the RNeasy Mini kit (Qiagen). Reverse transcription was performed using MuLV Reverse Transcriptase and Oligo(dT) primers (Applied Biosystems) and quantitative real-time PCR with an Applied Biosystems Prism 7900 HT Sequence Detection system. Samples were amplified in triplicate and data were analyzed using the Applied Biosystems Prism Sequencer Detection software, version 2.3 (Applied Biosystems). Relative expression of each gene was normalized to 18S RNA. Primer sequences are listed in SI Materials and Methods.
Immunoblotting.
Immunoblotting was performed using antibodies specific for AKT, MAPK, Stat3, and phospho–c-Met, -MAPK, -AKT, -Stat3 (Cell Signaling Technologies), Tuj1, GFAP, Nestin, and Sox2 (Millipore). All blots were stripped and reprobed with β-actin (Santa Cruz Biotechnologies) as loading controls.
Flow Cytometry.
The percentages of cells expressing ALDH, CD133, and SSEA-1 were determined following the manufacturer's specifications (12, 20). Single-cell suspensions were incubated ± diethylaminobenzaldehyde (DEAB) and then incubated in ALDH substrate (Stem Cell Technologies). Alternatively, single-cell suspensions were labeled with phycoerythrin (PE)-conjugated anti-CD133 antibody (clone 293C3; Miltenyi Biotec) or with anti–SSEA-1 FITC (BD). The stained cells were analyzed on a FACScan (BD). For c-Met high/low subpopulation sorting, single-cell suspensions were labeled with anti–c-Met FITC antibody (eBioscience) and then sorted using the FACS Vantage SE flow cytometer (BD). For cell cycle analysis, cell samples were stained and analyzed as previously described (9).
Cell Transfection.
Transfections of siRNA–Nanog (Santa Cruz Biotechnologies) used Oligofectamine and 15 nmol/L of siRNA–Nanog or siRNA–Con according to the manufacturer's instructions. ShRNA–Nanog plasmids (Open Biosystems, Thermo Scientific) were transfected using Fugene HD (Roche Diagnostics) reagent according to the manufacturer's instructions. After transfections (48 h), cells were selected with normal neurosphere medium containing 1μg/mL puromycin for 3 wk.
Tumor Formation in Vivo.
GBM1A cells were pretreated ± 500 nM of SU11274 for 7 d. Equal numbers of viable cells (5,000) were stereotactically implanted into the striata of immunodeficient mice (n = 6). The animals were killed on postimplantation week 11. Brains were removed, sectioned, and stained with H&E. Maximal tumor cross-sectional areas were measured by computer-assisted image analysis as previously described (9).
Statistical Analysis.
Data were analyzed using Prism software (GraphPad). When appropriate, two group comparisons were analyzed with a t test or Fisher's exact test unless otherwise indicated. Multiple group comparisons were analyzed with Tukey's multiple comparison tests. All data are represented as mean value ± SE of mean (SEM), n = 3 unless indicated otherwise.
Supplementary Material
Acknowledgments
We thank Michael Schamblott for helpful discussions. This work was supported by National Institutes of Health Grants NS43987 and CA129192 (both to J.L.), the Brain Tumor Funders Collaborative and James S. McDonnell Foundation (J.L., C.G.E., and A.Q-.H.), and the Lichtenberg Program of the Volkswagen Foundation (B.S.).
Footnotes
The authors declare no conflict of interest.
This article is a PNAS Direct Submission.
This article contains supporting information online at www.pnas.org/lookup/suppl/doi:10.1073/pnas.1016912108/-/DCSupplemental.
References
- 1.Galli R, et al. Isolation and characterization of tumorigenic, stem-like neural precursors from human glioblastoma. Cancer Res. 2004;64:7011–7021. doi: 10.1158/0008-5472.CAN-04-1364. [DOI] [PubMed] [Google Scholar]
- 2.Dirks PB. Cancer: Stem cells and brain tumours. Nature. 2006;444:687–688. doi: 10.1038/444687a. [DOI] [PubMed] [Google Scholar]
- 3.Takahashi K, Yamanaka S. Induction of pluripotent stem cells from mouse embryonic and adult fibroblast cultures by defined factors. Cell. 2006;126:663–676. doi: 10.1016/j.cell.2006.07.024. [DOI] [PubMed] [Google Scholar]
- 4.Krizhanovsky V, Lowe SW. Stem cells: The promises and perils of p53. Nature. 2009;460:1085–1086. doi: 10.1038/4601085a. [DOI] [PMC free article] [PubMed] [Google Scholar]
- 5.Schoenhals M, et al. Embryonic stem cell markers expression in cancers. Biochem Biophys Res Commun. 2009;383:157–162. doi: 10.1016/j.bbrc.2009.02.156. [DOI] [PubMed] [Google Scholar]
- 6.Bae KM, et al. Expression of pluripotent stem cell reprogramming factors by prostate tumor initiating cells. J Urol. 2010;183:2045–2053. doi: 10.1016/j.juro.2009.12.092. [DOI] [PMC free article] [PubMed] [Google Scholar]
- 7.Hong H, et al. Suppression of induced pluripotent stem cell generation by the p53-p21 pathway. Nature. 2009;460:1132–1135. doi: 10.1038/nature08235. [DOI] [PMC free article] [PubMed] [Google Scholar]
- 8.Birchmeier C, Birchmeier W, Gherardi E, Vande Woude GF. Met, metastasis, motility and more. Nat Rev Mol Cell Biol. 2003;4:915–925. doi: 10.1038/nrm1261. [DOI] [PubMed] [Google Scholar]
- 9.Li Y, et al. The scatter factor/hepatocyte growth factor: c-met pathway in human embryonal central nervous system tumor malignancy. Cancer Res. 2005;65:9355–9362. doi: 10.1158/0008-5472.CAN-05-1946. [DOI] [PubMed] [Google Scholar]
- 10.Laterra J, et al. Scatter factor/hepatocyte growth factor expression enhances human glioblastoma tumorigenicity and growth. Biochem Biophys Res Commun. 1997;235:743–747. doi: 10.1006/bbrc.1997.6853. [DOI] [PubMed] [Google Scholar]
- 11.Koochekpour S, et al. Met and hepatocyte growth factor/scatter factor expression in human gliomas. Cancer Res. 1997;57:5391–5398. [PubMed] [Google Scholar]
- 12.Sun P, et al. DNER, an epigenetically modulated gene, regulates glioblastoma-derived neurosphere cell differentiation and tumor propagation. Stem Cells. 2009;27:1473–1486. doi: 10.1002/stem.89. [DOI] [PMC free article] [PubMed] [Google Scholar]
- 13.Fan X, et al. NOTCH pathway blockade depletes CD133-positive glioblastoma cells and inhibits growth of tumor neurospheres and xenografts. Stem Cells. 2010;28:5–16. doi: 10.1002/stem.254. [DOI] [PMC free article] [PubMed] [Google Scholar]
- 14.Pandita A, Aldape KD, Zadeh G, Guha A, James CD. Contrasting in vivo and in vitro fates of glioblastoma cell subpopulations with amplified EGFR. Genes Chromosomes Cancer. 2004;39:29–36. doi: 10.1002/gcc.10300. [DOI] [PubMed] [Google Scholar]
- 15.Pollard SM, et al. Glioma stem cell lines expanded in adherent culture have tumor-specific phenotypes and are suitable for chemical and genetic screens. Cell Stem Cell. 2009;4:568–580. doi: 10.1016/j.stem.2009.03.014. [DOI] [PubMed] [Google Scholar]
- 16.Bhattacharya S, Schindler C. Regulation of Stat3 nuclear export. J Clin Invest. 2003;111:553–559. doi: 10.1172/JCI15372. [DOI] [PMC free article] [PubMed] [Google Scholar]
- 17.Rasper M, et al. Aldehyde dehydrogenase 1 positive glioblastoma cells show brain tumor stem cell capacity. Neuro-oncol. 2010;12:1024–1033. doi: 10.1093/neuonc/noq070. [DOI] [PMC free article] [PubMed] [Google Scholar]
- 18.Bao S, et al. Glioma stem cells promote radioresistance by preferential activation of the DNA damage response. Nature. 2006;444:756–760. doi: 10.1038/nature05236. [DOI] [PubMed] [Google Scholar]
- 19.Peñuelas S, et al. TGF-beta increases glioma-initiating cell self-renewal through the induction of LIF in human glioblastoma. Cancer Cell. 2009;15:315–327. doi: 10.1016/j.ccr.2009.02.011. [DOI] [PubMed] [Google Scholar]
- 20.Son MJ, Woolard K, Nam DH, Lee J, Fine HA. SSEA-1 is an enrichment marker for tumor-initiating cells in human glioblastoma. Cell Stem Cell. 2009;4:440–452. doi: 10.1016/j.stem.2009.03.003. [DOI] [PMC free article] [PubMed] [Google Scholar]
- 21.Kawamura T, et al. Linking the p53 tumour suppressor pathway to somatic cell reprogramming. Nature. 2009;460:1140–1144. doi: 10.1038/nature08311. [DOI] [PMC free article] [PubMed] [Google Scholar]
- 22.Zbinden M, et al. NANOG regulates glioma stem cells and is essential in vivo acting in a cross-functional network with GLI1 and p53. EMBO J. 2010;29:2659–2674. doi: 10.1038/emboj.2010.137. [DOI] [PMC free article] [PubMed] [Google Scholar]
- 23.Glas M, et al. Residual tumor cells are unique cellular targets in glioblastoma. Ann Neurol. 2010;68:264–269. doi: 10.1002/ana.22036. [DOI] [PMC free article] [PubMed] [Google Scholar]
- 24.Chen R, et al. A hierarchy of self-renewing tumor-initiating cell types in glioblastoma. Cancer Cell. 2010;17:362–375. doi: 10.1016/j.ccr.2009.12.049. [DOI] [PubMed] [Google Scholar]
- 25.Cicalese A, et al. The tumor suppressor p53 regulates polarity of self-renewing divisions in mammary stem cells. Cell. 2009;138:1083–1095. doi: 10.1016/j.cell.2009.06.048. [DOI] [PubMed] [Google Scholar]
- 26.Charles N, et al. Perivascular nitric oxide activates notch signaling and promotes stem-like character in PDGF-induced glioma cells. Cell Stem Cell. 2010;6:141–152. doi: 10.1016/j.stem.2010.01.001. [DOI] [PMC free article] [PubMed] [Google Scholar]
- 27.Miyoshi N, et al. Defined factors induce reprogramming of gastrointestinal cancer cells. Proc Natl Acad Sci USA. 2010;107:40–45. doi: 10.1073/pnas.0912407107. [DOI] [PMC free article] [PubMed] [Google Scholar]
- 28.Mani SA, et al. The epithelial-mesenchymal transition generates cells with properties of stem cells. Cell. 2008;133:704–715. doi: 10.1016/j.cell.2008.03.027. [DOI] [PMC free article] [PubMed] [Google Scholar]
- 29.Gangemi RM, et al. SOX2 silencing in glioblastoma tumor-initiating cells causes stop of proliferation and loss of tumorigenicity. Stem Cells. 2009;27:40–48. doi: 10.1634/stemcells.2008-0493. [DOI] [PubMed] [Google Scholar]
- 30.Wang J, et al. c-Myc is required for maintenance of glioma cancer stem cells. PLoS ONE. 2008;3:e3769. doi: 10.1371/journal.pone.0003769. [DOI] [PMC free article] [PubMed] [Google Scholar]
- 31.Chang CC, et al. Oct-3/4 expression reflects tumor progression and regulates motility of bladder cancer cells. Cancer Res. 2008;68:6281–6291. doi: 10.1158/0008-5472.CAN-08-0094. [DOI] [PubMed] [Google Scholar]
- 32.Forte G, et al. Hepatocyte growth factor effects on mesenchymal stem cells: Proliferation, migration, and differentiation. Stem Cells. 2006;24:23–33. doi: 10.1634/stemcells.2004-0176. [DOI] [PubMed] [Google Scholar]
- 33.Suzuki A, Zheng YW, Fukao K, Nakauchi H, Taniguchi H. Liver repopulation by c-Met-positive stem/progenitor cells isolated from the developing rat liver. Hepatogastroenterology. 2004;51:423–426. [PubMed] [Google Scholar]
- 34.Wang H, et al. Targeting interleukin 6 signaling suppresses glioma stem cell survival and tumor growth. Stem Cells. 2009;27:2393–2404. doi: 10.1002/stem.188. [DOI] [PMC free article] [PubMed] [Google Scholar]
Associated Data
This section collects any data citations, data availability statements, or supplementary materials included in this article.


