

Abstract
Mammalian target of rapamycin (mTOR) is a key regulator of eukaryotic cell growth. In particular, mTORC1, one of the two complexes that contain mTOR, is involved in the regulation of protein synthesis, proliferation, cell cycle and autophagy. Hyperactivation of the mTOR signaling pathway is observed in human cancer. A variety of approaches including deletion analysis, yeast genetic screens and mining of human cancer genome databases were taken that resulted in the identification of activating mutations of TOR. These studies suggest that the FAT, FRB and kinase domains are the three regions of TOR where activating mutations can be identified. Within the kinase domain, the mutations are clustered in three hot spots that are all located in the kinase active site that was deduced by the alignment with PI3K. One of the hot spots corresponds to the region where PI3K oncogenic mutations have been identified. These results are beginning to provide important insights into the mechanism of activation of mTOR.
Introduction
Mammalian target of rapamycin (mTOR) plays critical roles in regulating protein synthesis and growth, ribosomal protein synthesis, cell cycle, autophagy and apoptosis of eukaryotic cells (Wullschleger et al. 2006; Laplante & Sabatini 2009; Polak & Hall 2009; Hall & Tamanoi 2010; Tamanoi & Hall 2010). These effects are mediated by a multiprotein complex termed mTORC1 that consists of mTOR complexed with associated proteins. These include Raptor, mLST8 and Tel2. mTORC1 phosphorylates S6K, which then phosphorylates the ribosomal protein S6 leading to the stimulation of protein synthesis. In addition, mTORC1 phosphorylates 4E-BP1 blocking its ability to inhibit eIF4E. Another complex called mTORC2 consists of mTOR associated with proteins such as Rictor, mLST8, Sin1 and Tel2. mTORC2 phosphorylates Akt and is involved in the regulation of the actin cytoskeleton (Jacinto et al. 2004; Sarbassov et al. 2004). Figure 1 shows an overview of the mTOR signaling pathway.
Figure 1.

The mammalian target of rapamycin (mTOR) signaling pathway. Two different complexes, mTORC1 and mTORC2, are present. Although mTORC1 regulates processes such as protein synthesis, growth and autophagy, mTORC2 phosphorylates Akt and is involved in the control of actin cytoskeleton. Growth factors such as insulin and IGF, nutrients and energy conditions regulate the mTOR signaling.
Insulin and insulin-like growth factor-1 cause activation of PI3K leading to the phosphorylation of Akt. Activation of mTORC1 by Akt is mediated in part by the phosphorylation of TSC1/TSC2 complex that acts as a negative regulator of the G-protein Rheb (Manning et al. 2002; Inoki et al. 2003; Huang & Manning 2009). Rheb is an activator of mTOR (Long et al. 2005; Sancak et al. 2007; Sato et al. 2009). Nutrient signals appear to be transmitted to mTORC1 through Rag, a heterodimeric G-protein that binds Raptor and translocates mTORC1 to endosomes (Kim et al. 2008; Sancak et al. 2008). Involvement of MAP4K3 (Yan et al. 2010) and Vps34 (Nobukuni et al. 2007) in the nutrient signaling pathway has been reported. Energy conditions impact mTORC1 signaling by the activation of AMPK that phosphorylates TSC1/TSC2 (Inoki et al. 2003; Shaw et al. 2004).
The significance of mTOR signaling in human cancer is evidenced by the detection of hyperphosphorylation of S6K and S6 in a variety of human cancer samples. For example, hyperphosphorylation of S6 is seen in cases of malignant melanoma and clear cell renal carcinoma (Robb et al. 2007; Karbowniczek et al. 2008). In addition, head and neck carcinoma has increased levels of S6 phosphorylation (Molinolo et al. 2007). Genetic disorders owing to mutations in the genes upstream of the mTOR signaling players are often associated with the appearance of benign tumors (Inoki & Guan 2009). For example, tuberous sclerosis is caused by mutations in either the TSC1 or TSC2 gene; its clinical symptoms include the appearance of benign tumors in a variety of places in the body such as the lungs and kidneys (Kwiatkowski & Manning 2005).
Recent studies identified a number of amino acid changes that confer the hyperactivation of TOR. Genetic approaches using yeast identified a large number of amino acid changes in TOR each of which can confer activation (Reinke et al. 2006; Urano et al. 2007; Ohne et al. 2008). In addition, mining of human cancer genome databases identified mTOR mutations in human cancer samples (Sato et al. 2010). These mutants provide valuable tools to study the mTOR signaling. They also provide insights into the structure of mTOR. Further identification of cancer mutants may uncover types of cancer where the mTOR signaling pathway plays an important role. Table 1 lists all the mutations identified. This review is intended to capture these recent developments.
Table 1.
Activating mutants of TOR
| Mutations | Domain | Comments |
|---|---|---|
| Fission yeast Tor2 | ||
| Q1206I | FAT | Rheb independence |
| A1280V | Tor2 hyperactivation | |
| Q1289P | ||
| W1299R | ||
| A1309V/P | ||
| L1310P | ||
| C1333F | ||
| A1427T/V | ||
| V1740F | ||
| V1775F | ||
| Y1986C | Kinase | |
| V2000L | ||
| F2004C | ||
| V2205F | ||
| A2218G | ||
| E2221K | ||
| I2229T | ||
| L2233H | ||
| L2289F | ||
| N2294I | ||
| Budding yeast Tor1 | ||
| I1954V | FRB | Caffeine resistance |
| A1957V | ||
| Budding yeast Tor2 | ||
| I1957T | FRB | Rapamycin resistance |
| mTOR | ||
| L1310P | FAT | |
| L2302Q | Kinase | |
| E2419K | ||
| S2215Y | Mining cancer genome database | |
| R2505P | ||
| Δ2430–2450 | Deletion mutant | |
| V2198A/L2216H/L2260P | Budding yeast screen | |
| A2290V/K2440R | ||
mTOR, mammalian target of rapamycin.
mTOR is a member of the PI3K-related kinase family
mTOR belongs to a family of serine/threonine kinases called phosphatidylinositol-3 kinase–related kinases that are conserved from yeast to human (Abraham 2004). In humans, this family consists of six members including ataxia-telangiectasia mutated (ATM), ataxia- and Rad3-related, DNA-dependent protein kinase catalytic subunit, mTOR, suppressor of morphogenesis in genitalia and transformation/transcription domain-associated protein (TRAAP) (Fig. 2). These proteins share a similar structure that consists of the N-terminal HEAT (Huntingtin, elongation factor 3, alpha-regulatory subunit of protein phosphatase 2A and TOR1) domain and a kinase domain in the C-terminal half that is flanked by the FAT (FRAP-ATM-TRAAP) domain and FATC domain. The region between the kinase domain and the FATC domain is called the PRD domain (also FIT domain). Although the PRD domain sequence is not well conserved, this domain appears to play important roles in regulating the kinase activity. In addition, the FRB domain, where rapamycin/FKBP12 complex binds and inhibits mTOR, is present on the N-terminal side of the kinase domain. The HEAT domain is believed to form a curved tubular-shaped surface that is involved in multiple protein–protein interactions. The kinase domain has sequence similarity to phosphatidylinositol 3-kinase (PI3K). This is discussed further in later sections.
Figure 2.

Mammalian target of rapamycin (mTOR) belongs to the PI3-kinase-related kinase family that possesses unique structural features. The PIKK family member proteins include ataxia- and Rad3-related, ataxia-telangiectasia mutated, DNA-dependent protein kinase catalytic subunit, suppressor of morphogenesis in genitalia, transformation/transcription domain-associated protein and mTOR. These proteins have a similar structure consisting of the HEAT repeats at the N-terminal region and the kinase domain flanked by the FAT and FATC domains. The PRD (FIT) domain is present between the kinase and the FATC domain. FRB is present in mTOR.
Discovery of an activating mTOR mutation by a deletion at the C-terminal region
The first activating mTOR mutation was obtained when a small deletion was introduced close to its C-terminus (Sekulic et al. 2000). This mutant, called ΔTOR, contains a deletion of amino acids 2430–2450 in the kinase domain. When the mutant was transiently expressed in HEK293 cells followed by serum starvation, it was found that the activity of mTOR immunoprecipitated from these cells was significantly higher (3.5-fold) than that of mTOR isolated from control cells. Additionally, p70S6K activity was increased by the expression of ΔTOR. Although the basal level of S6K phosphorylation was increased by mutant protein expression, insulin stimulation was still required for maximal phosphorylation of S6K.
Phenotypic consequences of the expression of ΔTOR were further investigated by expressing the mutant in the murine hematopoietic cell line FL5.12. These cells completely depend on IL-3 for growth, proliferation and survival (Edinger & Thompson 2004). It was shown that the ΔTOR mutant partially maintained 4EBP1 phosphorylation even in the absence of growth factors. Surface expression of the amino acid transporter 4F2hc was decreased upon IL-3 withdrawal. However, the expression of ΔTOR rendered 4F2hc localization independent of IL-3. In addition, ΔTOR partially supported glycolysis after IL-3 deprivation. Other effects of ΔTOR include cellular atrophy, mitochondrial homeostasis and cell survival. The expression of ΔTOR in p53 null MEF caused increased colony formation in soft agar. This effect was further enhanced by the expression of E1A (adenoviral E1A) protein. These results suggest that ΔTOR expression can contribute to survival and cellular transformation.
Because the deletion of the region 2430–2450 causes hyperactivation of mTOR, this region that is located between the kinase domain and the FATC domain is defined as the ‘Repressor’ domain. This stretch may interfere with the catalytic activity of the mTOR kinase. Antibodies designated as mTAB 1 and mTAB 2 have been raised against sequences corresponding to positions 2433–2450 (Brunn et al. 1997). Interestingly, the addition of mTAB 1 led to the activation of the kinase activity, as detected by the in vitro mTOR kinase reaction using 4E-BP1 (PHAS-1) as a substrate (Brunn et al. 1997). These observations suggest that the binding of mTAB 1 removes the inhibitory function of the repressor domain on kinase activity.
Yeast screens identified a large number of activating mutations
Fission yeast mutants exhibiting Rheb independence and hyperactive Tor2 phenotypes
By carrying out random mutagenesis analyses of TOR, we have identified a large number of TOR-activating mutations (Urano et al. 2007). This was possible by making use of fission yeast as a system that is amenable to extensive mutagenesis and screens. Before this study, we as well as others established that the TSC/Rheb/-TOR signaling pathway is largely conserved in fission yeast (Aspuria et al. 2007). Fission yeast cells have homologues of the TSC1 and TSC2 genes and that their gene products form a heterodimer that functions as a downregulator of TORC1. We have shown that Rheb in fission yeast acts as an activator of TORC1. TORC1 contains Mip1 which is a homologue of Raptor. In contrast, TORC2 contains Ste20, a homologue of Rictor. We have also identified S6 homologues in fission yeast (Nakashima et al. 2010). Fission yeast cells have two TOR homologues, Tor1 and Tor2. Tor2 is essential for growth and associates with Mip1 to form TORC1, whereas Tor1 is nonessential and forms the TORC2 complex by associating with Ste20.
Two different approaches were taken to identify hyperactive mutants of Tor2. In the first approach, mutant yeast cells that can grow in the absence of Rheb were identified after methyl-nitro-nitrosoguanidine mutagenesis of yeast. These mutants were named ‘rig’ mutants for ‘rheb-independent growth’ mutants. It was found that one of the rig mutants contained a mutation in the tor2 gene. In the second approach, the tor2 gene was randomly mutagenized by PCR and then the mutants that confer hyperactivation were screened by assaying for decreased iodine staining, an indicator of decreased mating and sporulation. This is because Tor2 has dual functions to promote growth and to inhibit sexual differentiation. These approaches resulted in the identification of 22 single amino acid changes any one of which can confer hyperactivation of Tor2. The resulting mutants exhibit a delayed response to nitrogen starvation, as the starvation-induced G1 arrest and cell size change were significantly delayed in the mutants. The mutants harboring rhb1 disruption and carrying a tor2-activating mutation were sensitive to high salt stress (1M KCl) and high temperature.
One of the important observations of this work is that the amino acid changes that confer hyperactivation of Tor2 are clustered in a small number of regions, suggesting the occurrence of ‘hot spots’ for mutations (Fig. 3). First, mutations were found within or adjacent to the FAT domain and the kinase domain. In the FAT domain, a number of mutations were identified in the N-terminal region of the domain. There are two regions of the kinase domain where mutations were identified, one at the N-terminal side of the kinase domain and the other toward the C-terminal side of the kinase domain. In addition, two mutations were found within the PRD (FIT) domain that is located between the kinase and the FATC domain. These kinase domain mutations are discussed further in a later section.
Figure 3.

Activating mutations of target of rapamycin (TOR) identified by mutagenesis of fission yeast Tor2 and by mining the human cancer genome database. Locations of the mutations are superimposed on mammalian target of rapamycin (mTOR). First, fission yeast screens to look for Rheb independence and Tor2 hyperactivation led to the finding of 22 amino acid changes, any one of which confers activation. Locations of these mutations are extrapolated to mTOR locations (R). Two cancer mutations found in human cancer samples are in the kinase domain, and they are shown (C). Location of each domain was assigned based on the publications cited. The N-terminal region encompassing amino acid residues 1–1381 was assigned as the HEAT repeats (Knutson 2010). The next stretch of amino acids 1382–1982 is assigned as the FAT domain (Bosotti et al. 2000). The FRB domain is assigned as the region encompassing amino acid residues 2014–2114 (Veverka et al. 2008). The kinase, the FIT and the FATC domains were assigned as regions encompassing amino acid residues 2187–2427, 2427–2516 and 2517–2549, respectively (Sturgill & Hall 2009).
Most of the amino acid changes identified in Tor2 occurred on residues that are conserved. This enabled us to introduce the mutations into mTOR and examine whether the mutations confer hyperactivation of mTOR (Urano et al. 2007). Two representative mutations, L1310P in the FAT domain (corresponds to L1460P in mTOR) and E2221K in the kinase domain (corresponds to E2419K in mTOR), were individually introduced into the wild-type mTOR gene, and the mutant mTOR gene was expressed in mammalian cells. After transfecting HEK293T cells with the mutant mTOR, the cells were serum and amino acid starved and the activation of mTORC1 signaling was examined by the phosphorylation of S6K, 4E-BP1 or S6. We found that the phosphorylation of these proteins was not shut down even under nutrient starvation conditions. Interestingly, no change in the phosphorylation of Akt was observed in these experiments, suggesting that the mTOR mutants preferentially influence mTORC1 signaling. In this study, the two mutations, L1460P and E2419K, exhibited similar responses to nutrient starvation. However, Dunlop et al. (2009) detected different response of the two mutants upon insulin and amino acid addition after nutrient starvation. Further work is needed to characterize whether the two mutants behave differently.
mTOR functions as a dimer (Takahara et al. 2006; Wang et al. 2006). Thus, it was of interest to examine whether the mutations act as dominant mutations in a heterodimer consisting of the wild type and the mutant mTOR. To examine this point, two different tags were used. The wild-type mTOR was marked with the FLAG whereas the mutant mTOR was marked with the AU1 tag. This enabled us to isolate mutant heterodimers by immunoprecipitating with the anti-FLAG tag. A heterodimer was isolated from HEK293T cells expressing both constructs that were subjected to serum and amino acid starvation. Examination of mTORC1 activity as detected by the use of 4E-BP1 as a substrate showed that the heterodimer was active. Thus, the mutant mTOR exhibits dominant effects over the wild-type mTOR.
Mutations identified by suppressing Lst8 mutant phenotypes in budding yeast
In a different approach, Maeda and his colleagues used a budding yeast Tor2 construct that had its C-terminal one-third replaced with mTOR (Ohne et al. 2008). This chimeric construct is functional, as it complemented the tor2 deficiency in yeast. Random mutations were introduced into the kinase domain and were screened for mutants that suppressed the impaired growth of a temperature-sensitive mutant of Lst8 (lst8ts). Three mutants (SL1, 2 and 3) were isolated from the screen. SL1 contains three mutations, V2198A, L2216H and L2260P. SL2 contains two mutations, A2290V and K2440R. SL3 contains L2302Q mutation. The mutations found in the SL1 mutant confer hyperactivation of mTOR, as shown by expressing a FLAG-tagged mTOR mutant harboring the three SL1 mutations in HeLa cells and then isolating the mTOR complex by immunoprecipitating with anti-FLAG beads. Phosphorylation of 4E-BP1 was significantly increased when mTOR was immunoprecipitated from the mutant mTOR-transfected cells.
Mutations identified by screening for caffeine or rapamycin resistance in budding yeast
Powers and his colleagues identified mutations in the FRB domain that activated budding yeast TOR (Reinke et al. 2006). They first found that caffeine inhibits budding yeast TORC1 and identified a number of Tor1 mutants that are resistant to caffeine. A single amino acid substitution of A1957V in the FRB domain was responsible for conferring resistance to 9 mM caffeine. Further study yielded mutants resistant to higher concentrations (up to 20 mM) of caffeine, and characterization of these mutants led to the finding that a combination of two mutations, I1954V and W2176R, confers the caffeine resistance. The contribution of these mutations to the kinase activity of TOR1 was examined by evaluating each single mutation. The results showed that the I1954V and A1957V mutations can confer increased Tor1 kinase activity.
The Tor1 mutant I1954V exhibited increased interaction with Kog1 (Raptor homologue) that may explain the increased kinase activity of this mutant. The I1954V and A1957V in Tor1 correspond to I1957T and A1960V in Tor2, respectively.
Maeda and his colleagues also identified two activating mutations that map to the FRB domain of budding yeast TOR. In this case, Tor2 mutants with point mutation I1957T or A1960V were identified by looking for mutations that conferred weak rapamycin resistance (Ohne et al. 2008). These mutations were introduced into mTOR-generating mTOR mutants I2017T and A2020V. In vitro kinase activity of these mutants as detected by the use of 4E-BP1 as a substrate was significantly higher than that of the wild-type mTOR.
Combining mutations to create super-active mTOR
The earlier studies point to three classes of activating mutations of mTOR: those having mutations in the FAT domain, those having mutations in the FRB domain and those that have mutations in the kinase domain. Thus, it is possible that combining mutations in different domains may have additive or more than additive effects. It is also worth pointing out that although the above mTOR mutants exhibit increased mTORC1 activity and dramatically increased resistance to nutrient starvation, they are not completely constitutively active; prolonged nutrient starvation eventually results in shutdown of the mTOR signaling. Thus, attempts are being made to create mTOR mutants with strong constitutive activity. Combining the SL1 mutation and the I2017T mutation led to the creation of mTOR (mTORSL1+IT) that had higher activity than each mutant (Ohne et al. 2008). Phosphorylation of S6K1 during amino acid starvation in cells expressing the mTORSL1+IT mutant remained high. Cells expressing the mTORSL1+IT mutant retained their size even after amino acid starvation. These cells were also resistant to starvation-induced autophagy as detected by the accumulation of LC3-II (microtubule-associated protein1 light chain 3-II). Similarly, combining the I2017T mutation in the FRB domain with the E2419K mutation in the kinase domain (mTOREK+IT) led to the creation of mTOR with dramatically increased activity (Ohne et al. 2008).
Although the mTOR mutants with combined mutations exhibited increased kinase activity, they did not exhibit transforming activity. This point was examined using the mTORSL1+IT mutant in the NIH3T3 transformation assay. The result showed that the number of foci obtained by the transfection of the mutant is similar to those seen with the wild-type mTOR and with the vector control (Ohne et al. 2008). Thus, the mutant itself does not have transforming activity in NIH3T3 cells.
Mutations identified in human cancer
We have recently reported the first identification of hyperactive mTOR mutations in human cancer by mining human cancer genome databases (Sato et al. 2010). We first examined the Sanger Center Cancer Genome Database, COSMIC, that contained genome sequence of 750 cancer samples derived from tissues including breast, central nervous system, hematopoietic and lymphoid tissue, kidney, large intestine, lung, ovary, pancreas, pleura, skin, stomach, testis, upper aerodigestive tract and urinary tract. This led to the identification of ten mutations in mTOR. Of these, two are silent mutations that did not cause amino acid change and one generated a stop codon. The mutation M135T was identified in two tissue samples. Thus, six different single amino acid changes were identified by this analysis. They are A8S, M135T, M2011V, S2215Y, P2476L and R2505P.
To examine whether any of these mutations confer hyperactivation of mTOR, we introduced four single amino acid changes (A8S, S2215Y, P2476L and R2505P) individually into the wild-type mTOR and expressed them in HEK293T cells. Cells were serum and amino acid starved, and the activation of the mTORC1 signaling was examined by assaying phospho-S6K or phospho-4EBP1, whereas the activation of mTORC2 signaling was examined by phospho-Akt. This study showed that the cells expressing the mTOR mutant S2215Y or R2505P retained the phosphorylation of mTORC1 substrates but not mTORC2 substrate even under nutrient-starved conditions. The activity of mTORC1 immunoprecipitated from cells expressing the S2215Y or R2505P mutant was high even though the cells were subjected to nutrient starvation. In contrast, mTORC2 activity was unaffected by the expression of these mutants. Thus, S2215Y and R2505P mutations confer hyperactivation of mTORC1 but not mTORC2. Interestingly, these mutations are located in regions that correspond to the two regions close to the C-terminus where fission yeast Tor2 hyperactive mutations were found (Fig. 3).
When HEK293T cells are nutrient starved (both serum and amino acid starved), they are blocked at the G0/G1 phase of the cell cycle and become small. FACS analysis of cells expressing either the S2215Y or the R2505P mutant showed that these cells had a higher percentage of S-phase cells compared with the cells expressing the wild-type mTOR. Furthermore, forward scatter analysis showed that the cells expressing the mutant mTOR did not decrease their cell size upon nutrient starvation.
It is interesting that the cells expressing mutant mTOR exhibited increased resistance to 1-butanol. Because 1-butanol is an inhibitor of PLase D (phospholipase D) and that 1-butanol inhibits mTOR signaling by decreasing phosphatidic acid, this may suggest that the mutant mTOR is resistant to decreased levels of phosphatidic acid. Cells expressing the mutant mTOR were also partially resistant to high concentrations of hydrogen peroxide. Conversely, rapamycin sensitivity was unaffected by the expression of the mutant.
Because the human cancer genome database is rapidly expanding, we expect that additional mutations will be identified. In addition to the Sanger Center Cancer Genome Database, there are other databases that can be mined. For example, Cancer Genome Anatomy Project of the National Cancer Institute can be examined for this purpose. This database of SNPs as well as other SNP databases such as the Gene Expression Omnibus and Short Read Archive may provide valuable resources to identify mTOR cancer mutations.
It should be noted that the mTOR mutations we identified in cancer samples were present together with mutations in other genes (Sato et al. 2010). In the case of the S2215Y mutation found in a large intestine adenocarcinoma sample, another mutation was identified in K-ras (KrasG13D) in the same sample. In the case of the R2505P mutation identified in a clear cell renal cell carcinoma sample, a mutation of F218I in the CDC25A gene was also present. Whether these mutations function together with the mTOR mutations to increase transformed phenotypes needs to be investigated.
Structural insights
Predicted structure of the mTOR kinase domain based on alignment with PI3K
A three-dimensional structure of mTOR has yet to be obtained. Recently, Sturgill & Hall (2009) have built a model of the C-terminal region of TOR that includes the FAT, kinase and FATC domain based on the known crystal structure of PI3KCγ. This was made possible by the alignment of amino acid sequences of the two kinases. The catalytic region of TOR was defined by comparing about 100 TOR sequences from various organisms by using the Clustalw program. A comparison with the sequence of PI3KC identified a number of key features that are conserved in TOR and PI3KC.
First, the catalytic domain of TOR was assigned to a region beginning with the conserved motif K2187GHEDLRQD. There are other key motifs that have identity in PI3K. A catalytic loop GLGDRHPS is conserved in TOR with the triplet DRH. Proline is adjacent to this in TOR. The aspartate of the DRH motif (D2338 of mTOR) is believed to function as the catalytic base for the phosphate transfer reaction in protein kinases. The end of the catalytic domain is assigned as the region with an invariant F2421xxDPL motif. A conserved arginine is found near the end of the catalytic domain in PI3K-related kinases. This appears to correspond to Arg2408 in mTOR.
Within the catalytic domain of protein kinases, one finds a region called the ‘activation loop’ (Loch-head 2009). This is a short sequence of approximately 20–30 amino acid residues which is flanked by conserved N- and C-terminal anchor regions. This region is known as the ‘activation segment’, as phosphorylation of this segment leads to activation of the protein kinase in many cases. The phosphorylation occurs by an upstream kinase or by autophosphorylation. The activation loop of TOR is defined as a 14–15 residue sequence beginning with the DFG (D2357) motif and ending with the PE motif (P2372 and E2373). This fits with the general definition of the activation loop that begins with a DFG motif and ends with an APE motif. The aspartate of the DFG motif is critical for positioning the Mg2+ ion necessary for catalysis.
The region between the catalytic domain and the FATC domain is named the Found in TOR (FIT) domain (Sturgill & Hall 2009). The FIT domain encompasses residues 2427–2516. This domain contains a repressor domain (2430–2450) discussed earlier. Deletion of this repressor domain leads to the activation of mTOR. The FIT domain also contains Ser2448 that is phosphorylated by S6K1. In addition, Ser2481 is autophosphorylated. These observations suggest that the FIT domain functions as a regulatory domain. The FIT domain is also called the PRD domain (Lempiainen & Halazonetis 2009). The FATC domain begins with Proline2522 in mTOR.
A region from 1906 to 2526 of mTOR has been modeled using the crystal structure of PI3KCγ based on the alignment of TOR and PI3K. The predicted structure is shown in Fig. 4A. This region contains 12 α-helices and 10 β-sheets (Fig. 5). One of the interesting features is that the kα3 and kα9 helices are placed at key locations within the catalytic domain. These helices run through the core and above the active site. Residues that bind ATP can be identified within the structure. In the structure of PI3KCα and PI3KCγ, N- and C-terminal ends of the activation loop are surrounded from three sides by the three C-terminal helices, kα10, kα11 and kα12 of PI3KCγ (Lempiainen & Halazonetis 2009). These three helices are on the same plane and form an imaginary rectangle, and the N- and C-terminal ends of the activation loop are placed within this rectangle. Thus, three regions, kα3, kα9 and a region encompassing kα10–12, are located at critical regions.
Figure 4.
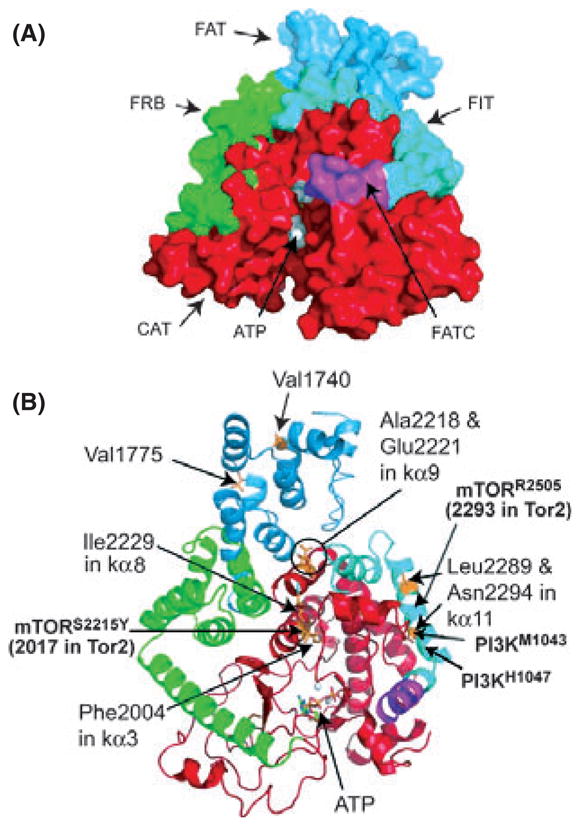
Predicted three-dimensional structure of the kinase domain of target of rapamycin (TOR) (adapted from Sturgill and Hall, 2009). (A) Three-dimensional structure of a region of TOR encompassing the region from the FAT to the FATC domain as deduced by the alignment of TOR with the structure of PI3Kγ is shown. (B) Predicted structure of fission yeast Tor2. Locations of activating mutations are shown on this structure.
Figure 5.

Target of rapamycin (TOR) mutants and PI3K oncogenic mutants occur at similar locations. α-helices and β-sheets found in mammalian target of rapamycin (mTOR) encompassing the region from the FRB to the FATC domains are assigned using the PI3KCγ nomenclature. These α-helices and β-sheets define the TOR region. Activating mutations found in fission yeast Tor2 are located within and/or adjacent to 3 α-helices, kα3, kα9 and kα11. The location of these mutations is shown as italicized residue numbers in Tor2, and the residue in mTOR corresponding to these is indicated in parenthesis. Cancer mutations are also found within and/or adjacent to the regions kα3 and kα11. Interestingly, oncogenic mutations of PI3K are located within kα11.
Activating mutations of TOR are clustered in the kinase active site
Figure 4B shows a predicted structure of fission yeast Tor2 kinase domain based on the alignment with PI3K that was adapted from Sturgill & Hall (2009). As described, we have identified a number of activating mutations in fission yeast Tor2 by carrying out yeast screens (Urano et al. 2007). The mutations found within or close to the kinase domain were clustered in three regions, region I (Y1986C, V2000L and F2004C), region II (V2205F, A2218G, E2221K, I2229T and L2233H) and region III (L2289F, N2294I). The location of these mutations in the predicted structure of Tor2 is shown in Fig. 5. Region I is within and adjacent to kα3. Region II mutations are within or adjacent to the helix kα9. Finally, region III mutations are within kα11. Thus, all these mutations occur at critical regions within the catalytic and the FIT domains. In the case of human cancer mutations, S2215Y is just outside of the kα3 whereas the R2205P mutation occurs in the kα11 helix.
Location of activating mutations of TOR overlaps with the location of oncogenic mutations in PI3K
Oncogenic mutations targeting residues in the catalytic subunit of PI3K p110α are frequent and occur in diverse tumors (Samuels et al. 2004; Miled et al. 2007; Vogt et al. 2007). These mutations map to two regions, one in the helical domain and the other in the kinase domain. The helical domain mutations mainly comprise of two hotspot mutations, E542K and E545K, whereas the kinase domain mutation is represented by the H1047R mutation. The helical domain mutations disrupt an inhibitory charge–charge interaction with p85α (Miled et al. 2007). In the case of the kinase domain mutants, H1047 is substituted with arginine, leucine, or tyrosine (Lempiainen & Halazonetis 2009). Another residue M1043 substituted with isoleucine or valine was found in this region (Lempiainen & Halazonetis 2009). These mutations enhance kinase activity and render PI3K insensitive to regulation by Ras, consistent with the observation that the binding of Ras to the Ras binding domain of PI3K induces conformational changes in the C-terminal lobe of the kinase domain (Pacold et al. 2000; Zhao & Vogt 2008, 2009).
The oncogenic PI3Kα mutations in the kinase domain map to the C-terminal half of helix αK12 (Samuels et al. 2004; Gymnopoulos et al. 2007). This helix in PI3KCα corresponds to helix kα11 in PI3KCγ. Strikingly, this helix is where the region III mutations in fission yeast Tor2 (L2289F, N2294I) as well as a cancer mutation (R2505P) were identified (Fig. 5). Thus, one of the clusters of TOR-activating mutations overlaps with the location of the PI3K oncogenic mutations, raising the possibility that the activation mechanism of mTOR shares similarity with that of PI3K. It may be further speculated that the mutations in kα11 render TOR insensitive to Rheb activation.
Future prospects
A large number of activating mutations in TOR have recently been identified. This is the culmination of multiple lines of research to identify TOR mutants. Use of yeast genetic screens was particularly effective in identifying these mutants. In addition, mining the human cancer genome database led to the identification of mTOR cancer mutations. The number of mutations is expected to grow rapidly as more results of the human cancer genome project become available.
One of the important questions concerning the mTOR signaling is in what type of cancer this signaling pathway plays a critical role. Further identification of mTOR-activating mutations in human cancer may provide insight into this question. Another type of information that may be obtained by the use of activating mTOR mutants concerns the question of biological consequences of mTOR activation. Investigation into phenotypes resulting from the expression of activating mutants may provide insight into the above question. For example, phenotypes of transgenic mice expressing an mTOR-activating mutant may be informative. Tissue-specific expression of the mTOR mutants should provide further insight.
The location of these mutations may suggest how TOR is activated. The mutations in the kinase catalytic domain are found to be confined to three regions (kα3, kα9 and kα11) in agreement with the occurrence of these helices at the active site of the kinase and in proximity to the activation loop. Further insight should be obtained in the future with a larger set of mutants. The studies also point to the significance of the FAT domain and FRB domain for the activation of TOR. How these regions play roles in the activation of this kinase should be addressed in the future.
Acknowledgments
We thank members of the Tamanoi lab for discussion. This work was supported by the NIH grant CA41996, JCCC seed grant and the Department of Defense grant W81xWH-05-0164.
References
- Abraham RT. PI 3-kinase related kinases: ‘big’ players in stress-induced signaling pathways. DNA Repair (Amst) 2004;3:883–887. doi: 10.1016/j.dnarep.2004.04.002. [DOI] [PubMed] [Google Scholar]
- Aspuria PJ, Sato T, Tamanoi F. The TSC/Rheb/TOR signaling pathway in fission yeast and mammalian cells: temperature sensitive and constitutive active mutants of TOR. Cell Cycle. 2007;6:1692–1695. doi: 10.4161/cc.6.14.4478. [DOI] [PubMed] [Google Scholar]
- Bosotti R, Isacchi A, Sonnhammer EL. FAT: a novel domain in PIK-related kinases. Trends Biochem Sci. 2000;25:225–227. doi: 10.1016/s0968-0004(00)01563-2. [DOI] [PubMed] [Google Scholar]
- Brunn GJ, Fadden P, Haystead TA, Lawrence JC., Jr The mammalian target of rapamycin phosphorylates sites having a (Ser/Thr)-Pro motif and is activated by antibodies to a region near its COOH terminus. J Biol Chem. 1997;272:32547–32550. doi: 10.1074/jbc.272.51.32547. [DOI] [PubMed] [Google Scholar]
- Dunlop EA, Dodd KM, Seymour LA, Tee AR. Mammalian target of rapamycin complex 1-mediated phosphorylation of eukaryotic initiation factor 4E-binding protein 1 requires multiple protein-protein interactions for substrate recognition. Cell Signal. 2009;21:1073–1084. doi: 10.1016/j.cellsig.2009.02.024. [DOI] [PubMed] [Google Scholar]
- Edinger AL, Thompson CB. An activated mTOR mutant supports growth factor-independent, nutrient-dependent cell survival. Oncogene. 2004;23:5654–5663. doi: 10.1038/sj.onc.1207738. [DOI] [PubMed] [Google Scholar]
- Gymnopoulos M, Elsliger MA, Vogt PK. Rare cancer-specific mutations in PIK3CA show gain of function. Proc Natl Acad Sci USA. 2007;104:5569–5574. doi: 10.1073/pnas.0701005104. [DOI] [PMC free article] [PubMed] [Google Scholar]
- Hall MN, Tamanoi F, editors. The enzymes: Structure, function and regulation of TOR complexes from yeasts to mammals, vol. 27, part A. Amsterdam: Academic Press/Elsevier; 2010. [Google Scholar]
- Huang J, Manning BD. A complex interplay between Akt, TSC2 and the two mTOR complexes. Biochem Soc Trans. 2009;37:217–222. doi: 10.1042/BST0370217. [DOI] [PMC free article] [PubMed] [Google Scholar]
- Inoki K, Guan KL. Tuberous sclerosis complex, implication from a rare genetic disease to common cancer treatment. Hum Mol Genet. 2009;18:R94–R100. doi: 10.1093/hmg/ddp032. [DOI] [PMC free article] [PubMed] [Google Scholar]
- Inoki K, Zhu T, Guan KL. TSC2 mediates cellular energy response to control cell growth and survival. Cell. 2003;115:577–590. doi: 10.1016/s0092-8674(03)00929-2. [DOI] [PubMed] [Google Scholar]
- Jacinto E, Loewith R, Shmidt A, Lin S, Ruegg MA, Hall MN. Mammalian TOR complex 2 controls the actin cytoskeleton and is rapamycin insensitive. Nat Cell Biol. 2004;6:1122–1128. doi: 10.1038/ncb1183. [DOI] [PubMed] [Google Scholar]
- Karbowniczek M, Spittle CS, Morrison T, Wu H, Henske EP. mTOR is activated in the majority of malignant melanomas. J Invest Dermatol. 2008;128:980–987. doi: 10.1038/sj.jid.5701074. [DOI] [PubMed] [Google Scholar]
- Kim E, Goraksha-Hicks P, Li L, Neufeld TP, Guan KL. Regulation of TORC1 by Rag GTPases in nutrient response. Nat Cell Biol. 2008;10:935–945. doi: 10.1038/ncb1753. [DOI] [PMC free article] [PubMed] [Google Scholar]
- Knutson BA. Insights into the domain and repeat architecture of target of rapamycin. J Struct Biol. 2010;170:354–363. doi: 10.1016/j.jsb.2010.01.002. [DOI] [PMC free article] [PubMed] [Google Scholar]
- Kwiatkowski DJ, Manning BD. Tuberous sclerosis: a GAP at the crossroads of multiple signaling pathways. Hum Mol Genet. 2005;14(Spec No 2):R251–R258. doi: 10.1093/hmg/ddi260. [DOI] [PubMed] [Google Scholar]
- Laplante M, Sabatini DM. mTOR signaling at a glance. J Cell Sci. 2009;122:3589–3594. doi: 10.1242/jcs.051011. [DOI] [PMC free article] [PubMed] [Google Scholar]
- Lempiainen H, Halazonetis TD. Emerging common themes in regulation of PIKKs and PI3Ks. EMBO J. 2009;28:3067–3073. doi: 10.1038/emboj.2009.281. [DOI] [PMC free article] [PubMed] [Google Scholar]
- Lochhead PA. Protein kinase activation loop auto-phosphorylation in cis: overcoming a Catch-22 situation. Sci Signal. 2009;2:pe4. doi: 10.1126/scisignal.254pe4. [DOI] [PubMed] [Google Scholar]
- Long X, Lin Y, Ortiz-Vega S, Yonezawa K, Avruch J. Rheb binds and regulates the mTOR kinase. Curr Biol. 2005;15:702–713. doi: 10.1016/j.cub.2005.02.053. [DOI] [PubMed] [Google Scholar]
- Manning BD, Tee AR, Logsdon MN, Blenis J, Cantley LC. Identification of the tuberous sclerosis complex-2 tumor suppressor gene product tuberin as a target of the phosphoinositide 3-kinase/akt pathway. Mol Cell. 2002;10:151–162. doi: 10.1016/s1097-2765(02)00568-3. [DOI] [PubMed] [Google Scholar]
- Miled N, Yan Y, Hon WC, Perisic O, Zvelebil M, Inbar Y, Schneidman-Duhovny D, Wolfson HJ, Backer JM, Williams RL. Mechanism of two classes of cancer mutations in the phosphoinositide 3-kinase catalytic subunit. Science. 2007;317:239–242. doi: 10.1126/science.1135394. [DOI] [PubMed] [Google Scholar]
- Molinolo AA, Hewitt SM, Amornphimoltham P, et al. Dissecting the Akt/mammalian target of rapamycin signaling network: emerging results from the head and neck cancer tissue array initiative. Clin Cancer Res. 2007;13:4964–4973. doi: 10.1158/1078-0432.CCR-07-1041. [DOI] [PubMed] [Google Scholar]
- Nakashima A, Sato T, Tamanoi F. Fission yeast TORC1 regulates phosphorylation of ribosomal S6 proteins in response to nutrients and its activity is inhibited by rapamycin. J Cell Sci. 2010;123(Pt 5):777–786. doi: 10.1242/jcs.060319. [DOI] [PMC free article] [PubMed] [Google Scholar]
- Nobukuni T, Kozma SC, Thomas G. hvps34, an ancient player, enters a growing game: mTOR Complex1/S6K1 signaling. Curr Opin Cell Biol. 2007;19:135–141. doi: 10.1016/j.ceb.2007.02.019. [DOI] [PubMed] [Google Scholar]
- Ohne Y, Takahara T, Hatakeyama R, Matsuzaki T, Noda M, Mizushima N, Maeda T. Isolation of hyperactive mutants of mammalian target of rapamycin. J Biol Chem. 2008;283:31861–31870. doi: 10.1074/jbc.M801546200. [DOI] [PubMed] [Google Scholar]
- Pacold ME, Suire S, Perisic O, Lara-Gonzalez S, Davis CT, Walker EH, Hawkins PT, Stephens L, Eccleston JF, Williams RL. Crystal structure and functional analysis of Ras binding to its effector phosphoinositide 3-kinase gamma. Cell. 2000;103:931–943. doi: 10.1016/s0092-8674(00)00196-3. [DOI] [PubMed] [Google Scholar]
- Polak P, Hall MN. mTOR and the control of whole body metabolism. Curr Opin Cell Biol. 2009;21:209–218. doi: 10.1016/j.ceb.2009.01.024. [DOI] [PubMed] [Google Scholar]
- Reinke A, Chen JC, Aronova S, Powers T. Caffeine targets TOR complex I and provides evidence for a regulatory link between the FRB and kinase domains of Tor1p. J Biol Chem. 2006;281:31616–31626. doi: 10.1074/jbc.M603107200. [DOI] [PubMed] [Google Scholar]
- Robb VA, Karbowniczek M, Klein-Szanto AJ, Henske EP. Activation of the mTOR signaling pathway in renal clear cell carcinoma. J Urol. 2007;177:346–352. doi: 10.1016/j.juro.2006.08.076. [DOI] [PubMed] [Google Scholar]
- Samuels Y, Wang Z, Bardelli A, Silliman N, Ptak J, Szabo S, Yan H, Gazdar A, Powell SM, Riggins GJ, Willson JK, Markowitz S, Kinzler KW, Vogelstein B, Velculescu VE. High frequency of mutations of the PIK3CA gene in human cancers. Science. 2004;304:554. doi: 10.1126/science.1096502. [DOI] [PubMed] [Google Scholar]
- Sancak Y, Peterson TR, Shaul YD, Lindquist RA, Thoreen CC, Bar-Peled L, Sabatini DM. The Rag GTPases bind raptor and mediate amino acid signaling to mTORC1. Science. 2008;320:1496–1501. doi: 10.1126/science.1157535. [DOI] [PMC free article] [PubMed] [Google Scholar]
- Sancak Y, Thoreen CC, Peterson TR, Lindquist RA, Kang SA, Spooner E, Carr SA, Sabatini DM. PRAS40 is an insulin-regulated inhibitor of the mTORC1 protein kinase. Mol Cell. 2007;25:903–915. doi: 10.1016/j.molcel.2007.03.003. [DOI] [PubMed] [Google Scholar]
- Sarbassov DD, Ali SM, Kim DH, Guertin DA, Latek RR, Erdjument-Bromage H, Tempst P, Sabatini DM. Rictor, a novel binding partner of mTOR, defines a rapamycin-insensitive and raptor-independent pathway that regulates the cytoskeleton. Curr Biol. 2004;14:1296–1302. doi: 10.1016/j.cub.2004.06.054. [DOI] [PubMed] [Google Scholar]
- Sato T, Nakashima A, Guo L, Coffman K, Tamanoi F. Single amino-acid changes that confer constitutive activation of mTOR are discovered in human cancer. Oncogene. 2010;29:2746–2752. doi: 10.1038/onc.2010.28. [DOI] [PMC free article] [PubMed] [Google Scholar]
- Sato T, Nakashima A, Guo L, Tamanoi F. Specific activation of mTORC1 by Rheb G-protein in vitro involves enhanced recruitment of its substrate protein. J Biol Chem. 2009;284:12783–12791. doi: 10.1074/jbc.M809207200. [DOI] [PMC free article] [PubMed] [Google Scholar]
- Sekulic A, Hudson CC, Homme JL, Yin P, Otterness DM, Karnitz LM, Abraham RT. A direct linkage between the phosphoinositide 3-kinase-AKT signaling pathway and the mammalian target of rapamycin in mitogen-stimulated and transformed cells. Cancer Res. 2000;60:3504–3513. [PubMed] [Google Scholar]
- Shaw RJ, Bardeesy N, Manning BD, Lopez L, Kosmatka M, DePinho RA, Cantley LC. The LKB1 tumor suppressor negatively regulates mTOR signaling. Cancer Cell. 2004;6:91–99. doi: 10.1016/j.ccr.2004.06.007. [DOI] [PubMed] [Google Scholar]
- Sturgill TW, Hall MN. Activating mutations in TOR are in similar structures as oncogenic mutations in PI3KCalpha. ACS Chem Biol. 2009;4:999–1015. doi: 10.1021/cb900193e. [DOI] [PMC free article] [PubMed] [Google Scholar]
- Takahara T, Hara K, Yonezawa K, Sorimachi H, Maeda T. Nutrient-dependent multimerization of the mammalian target of rapamycin through the N-terminal HEAT repeat region. J Biol Chem. 2006;281:28605–28614. doi: 10.1074/jbc.M606087200. [DOI] [PubMed] [Google Scholar]
- Tamanoi F, Hall MN, editors. The enzymes: Structure, function and regulation of TOR complexes from yeasts to mammals, vol. 28, part B. Amsterdam: Academic Press/Elsevier; 2010. [Google Scholar]
- Urano J, Sato T, Matsuo T, Otsubo Y, Yamamoto M, Tamanoi F. Point mutations in TOR confer Rheb-independent growth in fission yeast and nutrient-independent mammalian TOR signaling in mammalian cells. Proc Natl Acad Sci USA. 2007;104:3514–3519. doi: 10.1073/pnas.0608510104. [DOI] [PMC free article] [PubMed] [Google Scholar]
- Veverka V, Crabbe T, Bird I, Lennie G, Muskett FW, Taylor RJ, Carr MD. Structural characterization of the interaction of mTOR with phosphatidic acid and a novel class of inhibitor: compelling evidence for a central role of the FRB domain in small molecule-mediated regulation of mTOR. Oncogene. 2008;27:585–595. doi: 10.1038/sj.onc.1210693. [DOI] [PubMed] [Google Scholar]
- Vogt PK, Kang S, Elsliger MA, Gymnopoulos M. Cancer-specific mutations in phosphatidylinositol 3-kinase. Trends Biochem Sci. 2007;32:342–349. doi: 10.1016/j.tibs.2007.05.005. [DOI] [PubMed] [Google Scholar]
- Wang L, Rhodes CJ, Lawrence JC., Jr Activation of mammalian target of rapamycin (mTOR) by insulin is associated with stimulation of 4EBP1 binding to dimeric mTOR complex 1. J Biol Chem. 2006;281:24293–24303. doi: 10.1074/jbc.M603566200. [DOI] [PubMed] [Google Scholar]
- Wullschleger S, Loewith R, Hall MN. TOR signaling in growth and metabolism. Cell. 2006;124:471–484. doi: 10.1016/j.cell.2006.01.016. [DOI] [PubMed] [Google Scholar]
- Yan L, Mieulet V, Burgess D, Findlay GM, Sully K, Procter J, Goris J, Janssens V, Morrice NA, Lamb RF. PP2A T61 epsilon is an inhibitor of MAP4K3 in nutrient signaling to mTOR. Mol Cell. 2010;37:633–642. doi: 10.1016/j.molcel.2010.01.031. [DOI] [PubMed] [Google Scholar]
- Zhao L, Vogt PK. Helical domain and kinase domain mutations in p110alpha of phosphatidylinositol 3-kinase induce gain of function by different mechanisms. Proc Natl Acad Sci USA. 2008;105:2652–2657. doi: 10.1073/pnas.0712169105. [DOI] [PMC free article] [PubMed] [Google Scholar]
- Zhao L, Vogt PK. Hot-spot mutations in p110alpha of phosphatidylinositol 3-kinase (pI3K): differential interactions with the regulatory subunit p85 and with RAS. Cell Cycle. 2009;9:596–600. doi: 10.4161/cc.9.3.10599. [DOI] [PMC free article] [PubMed] [Google Scholar]