

Abstract
The human pregnane X nuclear receptor (PXR) is a xenobiotic-regulated receptor that is activated by a range of diverse chemicals, including antibiotics, antifungals, glucocorticoids, and herbal extracts. PXR has been characterized as an important receptor in the metabolism of xenobiotics due to induction of cytochrome P450 isozymes and activation by a large number of prescribed medications. Developing methodologies that can efficiently detect PXR ligands will be clinically beneficial to avoid potential drug–drug interactions. To facilitate the identification of PXR ligands, a time-resolved fluorescence resonance energy transfer (TR-FRET) assay was miniaturized to a 1,536-well microtiter plate format to employ quantitative high-throughput screening (qHTS). The optimized 1,536-well TR-FRET assay showed Z′-factors of ≥0.5. Seven- to 15-point concentration–response curves (CRCs) were generated for 8,280 compounds using both terbium and fluorescein emission data, resulting in the generation of 241,664 data points. The qHTS method allowed us to retrospectively examine single concentration screening datasets to assess the sensitivity and selectivity of the PXR assay at different compound screening concentrations. Furthermore, nonspecific assay artifacts such as concentration-based quenching of the terbium signal and compound fluorescence were identified through the examination of CRCs for specific emission channels. The CRC information was also used to define chemotypes associated with PXR ligands. This study demonstrates the feasibility of profiling thousands of compounds against PXR using the TR-FRET assay in a high-throughput format.
Introduction
The pregnane X nuclear receptor (PXR) is primarily expressed in the liver and gastrointestinal tract across species. Upon activation by a wide variety of chemicals, PXR regulates enzymes such as cytochrome P450 (CYP) 3A4 and transporters involved in the metabolism of many clinically prescribed drugs.1–4 Aside from its well-known role in CYP3A4 induction, PXR also regulates CYP1A, CYP2B, CYP2C, carboxylesterases, alcohol dehydrogenase, glutathione S-transferase (GST), and transporters such as P-glycoprotein.5,6 Specifically, PXR is a ligand-dependent nuclear receptor that is activated by endogenous and exogenous chemicals, while xenobiotic activation at the cellular level results in the induction of enzymes involved in oxidation, conjugation, and transport of the chemicals.1,6 In addition to its role as a xenobiotic sensor, PXR regulates endogenous levels of cholesterol and bile acids.7,8 After binding to certain ligands, PXR forms a heterodimer with the retinoid X receptor, which binds to PXR responsive elements in promoters and enhancer regions of PXR inducible genes, resulting in transcription of target genes.2,9
PXR, whose name was based on the observation that 21-carbon steroids known as pregnanes activated the receptor, was originally identified in 1998 as an orphan nuclear receptor.2,9,10 Structurally, PXR has a similar two-domain structure found in other nuclear receptors and contains a highly conserved DNA binding domain linked to a ligand binding domain (LBD) by a flexible hinge region.9 However, unlike other nuclear receptors, which are ligand-specific, PXR ligands are structurally diverse, with the LBD having the ability to bind large hydrophobic molecules.1,11 The PXR LBD is extremely flexible because of a 60-residue insert that extends the ligand binding pocket, thus allowing conformational changes to accommodate large molecules.9 Therefore, the promiscuous nature of PXR ligand binding is a contributing factor in drug–drug interactions due to its capability of binding an array of structurally unrelated molecules that induce CYP3A4.9,12
PXR is activated by low concentrations of glucocorticoids, antiglucocorticoids, antibiotics, antifungals, pesticides, and herbal extracts.10,13 Even though structurally unrelated, these molecules share the similar feature of CYP3A4 induction.10 Many potent PXR ligands identified among prescription drugs include retinoic acid, rifampicin, ritonavir, cyclophosphamide, RU486, dexamethasone, hyperforin, and SR12813.1,3,14,15 SR12813 is a biphosphonate ester used to lower serum cholesterol levels. SR12813 has been implicated as a strong inducer of CYP3A1 expression in human and rabbit hepatocytes and is the most potent human PXR activator that has been described to date.3,16 Another high-affinity PXR ligand is hyperforin, found in St. John's wort. Patients taking this herbal remedy along with other medications have reported drug–drug interactions.17
Although similar compounds have been shown to activate PXR across different species, pharmacological differences in the efficacy of PXR activation exist.18–22 Typically, nuclear receptor orthologs share greater than 90% sequence identity; however, human, rabbit, rat, and mouse PXR LBDs have been reported to share only 70% sequence identity.16 Due to species-specific sequence differences in PXR, SR12813 has been shown to be a potent activator in both human and rabbit PXR but a weak activator of rat and mouse PXR.16 Therefore, animal models may not be optimal to test or predict compound activation of PXR in humans because of species differences. Additionally, PXR responsive elements in target genes may differ between humans and other species, with species-specific profiles of CYP3A4 induction.16,22,23 Primary human hepatocytes have been utilized in the prediction of xenobiotic induction of drug metabolizing genes; however, one limitation has been the availability and quality of human liver donors.23
These limitations have meant that methods allowing direct analysis of human PXR ligand binding are desirable. Thus, in vitro technologies have recently emerged to screen drugs of interest.23 For example, transient and stably transfected cell lines incorporating an expression vector for PXR linked to a reporter gene have been used for compound screening.9 Other in vitro assays include radioligand competition binding assays, where compounds compete with [3H]SR12813 for PXR binding,16 and scintillation proximity binding assays, involving reactions with receptor-coated beads.3,24 Fluorescence resonance energy transfer (FRET) assays have also been used, where fluorescent signal depends on the ligand-dependent interaction of a fluorescently labeled LBD and co-activator proteins. The fluorescent signal is present when the LBD and co-activator proteins are brought into close proximity through an interaction between test compound and PXR LBD.25,26 Generally, the data derived from in vitro assays, such as FRET, have shown good correlation with cell-based reporter assays.3 However, data obtained from the direct evaluation of PXR protein binding may not reflect all cell-based PXR activity as this can depend on the composition of co-regulators in the cells as well as the species from which the cells were derived.
Recently, time-resolved FRET (TR-FRET) assays allow for the straightforward assessment of receptor binding. Lanthanide chelates (e.g., terbium [Tb3+] or europium) are used as the donor fluorophore and may be used to label either the biomolecule directly or an antibody to a common protein tag. A receptor ligand is labeled with a suitable acceptor fluorophore such as fluorescein.27 In this form, test compounds that compete for binding to the receptor will cause a decrease in the TR-FRET signal.
TR-FRET has many advantages, including the ability to measure both lanthanide and acceptor fluorophore emissions to generate FRET ratios, which greatly reduces variability in the data. The FRET ratio is disrupted when a competitor ligand binds the nuclear receptor and displaces the bound fluorescein-labeled tracer molecule. The long excitation lifetime of Tb3+ can minimize nonspecific interferences from short fluorescent lifetime components such as plate plastics, compound autofluorescence,28 and diffusion-enhanced FRET.29 As well, selecting the proper donor and acceptor fluorophores and filters allows for the monitoring of two simultaneous processes that can further aid in identifying fluorescent interferences such as attenuation of the excitation light.
We describe here the optimization, validation, and screening of a TR-FRET-based human PXR assay in a 1,536-well format. The assay measured human PXR LBD binding by measuring the emission intensities of both Tb3+ donor and fluorescein acceptor fluorophores. This allowed for the calculation of the ratio of these fluorophore intensities to determine if a loss in TR-FRET signal resulted upon compound binding. This miniaturized assay (6 μl per well) was validated using quantitative high-throughput screening (qHTS)30 with a pilot screening set (the 1,280-compound Library of Pharmacologically Active Compounds [LOPAC1280, Sigma-Aldrich, St. Louis, MO]). We next utilized qHTS against an additional 7,000 compounds from five different chemical libraries, to yield a total of 8,280 compounds screened in the assay. Using seven- to 15- concentration points, we determined concentration–response curves (CRCs) for every library compound that included known and previously unknown PXR ligands. The application of qHTS additionally allowed us to monitor assay artifacts, such as potential compound aggregation and signal quenching, and to assess the selectivity and sensitivity of the assay when using a single concentration-based screening format. We also describe several chemical scaffolds associated with PXR ligand binding that were identified in the assay.
Materials and Methods
Materials
Kalypsys (San Diego, CA) black polystyrene solid-bottom 1,536-well plates were used as assay plates. Polypropylene plates were used as 1,536-well compound plates.
Compound Library
Compound preparation has been described elsewhere.31 A total of 8,280 compounds were screened from six different chemical libraries, which included (compound number in each collection is indicated in parentheses) the Sigma-Aldrich LOPAC collection (1,280), the U.S. Food and Drug Administration (FDA) (Bethesda, MD) FDA1 (1,408), FDA 2 (1,408), Tocris/TimTec (Bristol, UK) (1,395), bioactive collection (1,381), and Biomol (Plymouth Meeting, PA) (1,408).
The LOPAC, FDA 1, and FDA 2 libraries were prepared as 15-point concentrations that were serially diluted 1:2.236 in dimethyl sulfoxide (DMSO) in 384-well plates ( , allowing for even 1:5 dilutions at every other titration point in case fewer titration points are desired). The Biomol library was also prepared as 15-point concentrations, but the 11th concentration was omitted because of a handling error. The Bioactive library was prepared as seven-point titrations that were serially diluted 1:5 in DMSO. Some of the libraries, such as FDA and Biomol, contained pharmacologically active PXR ligands that were used to evaluate the performance of the assay. Transfer of the diluted compounds from 384-well plates to 1,536-well plates was performed using an Evolution™ P3 system (PerkinElmer, Wellesley, MA).31 The stock concentrations of the test compounds contained in DMSO ranged from 10 mM to 0.13 μM. Thirty compounds were chosen for follow-up and prepared in duplicate 24-point twofold titrations, in DMSO, across the 1,536-well plate. The starting concentrations of compounds were 10 mM except for NCGC00164349-01 (20 mM), NCGC00017093 (4.47 mM), and NCGC00016769-01 (4.47 mM).
Analytical Quality Control of Follow-Up Compounds
Active compounds that were obtained from commercial sources were analyzed for purity. For these resupplied compounds, the purity analysis was performed via liquid chromatography/mass spectroscopy analysis on a Waters (Milford, MA) ACQUITY UPLC System with a 1.7-μm BEH C18 column (2.1 × 50 mm) at a flow rate of 0.5 ml/min (45°C). A linear gradient from 2% to 100% acetonitrile over 1.3 min with a total run time of 2.1 min was used. The solvents were modified with trifluoroacetic acid (0.025% trifluoroacetic acid in acetonitrile, 0.05% trifluoroacetic acid in water). Compound purity was measured based on peak integration from both ultraviolet (UV)/visible absorbance and evaporative light scattering detectors, and compound identity was based on mass analysis.
TR-FRET Assay
The PXR assay was performed using the LanthaScreen™ TR-FRET PXR competitive binding assay kit (Invitrogen, Carlsbad, CA). The kit contains the TR-FRET PXR assay buffer, Fluormone™ PXR Green (fluorescein-labeled PXR ligand), human PXR-LBD (GST-labeled) (amino acids 111–434), and LanthaScreen Tb-anti-GST antibody. Batch-to-batch variation in PXR performance was alleviated through reformulation of PXR storage buffer by Invitrogen. PXR LBD was diluted in the assay buffer to 1.5 times the final recommended concentration to maintain optimal protein stability during the screening process in the 1,536-well format. A BioRAPTR™ flying reagent dispenser (FRD) (Beckman-Coulter, Fullerton, CA) was used for reagent dispensing.32
qHTS Assay Protocol
The first four columns of each 1,536-well plate used in the assay were reserved for control compounds that are known PXR ligands. SR12813 and T0901317 were serially diluted (1:2) in 384-well plates containing DMSO for a total of 16 concentrations (2.5 mM starting concentration). Next, 7 μl of the dilutions was transferred in duplicate to a 1,536-well compound plate, with SR12813 and T0901317 dilutions in the first two columns, respectively. Vehicle-only (DMSO) and SR12813 at the 100% effective concentration (2.5 mM) were placed in the third and fourth columns, respectively, to assess plate statistics and signal-to-background ratios of the assay. The stepwise qHTS protocol is shown in Table 1. Three microliters of 2× Fluormone tracer was first dispensed into 1,536-well black solid-bottom assay plates. Next, 23 nl of control and test compounds was transferred using a pin tool equipped with 1,536 10-nl pins33 (Kalypsys), with final DMSO concentrations less than 0.5%. Three microliters of a 3× Tb-anti-GST antibody/PXR LBD mixture was dispensed into each plate, after testing various concentrations of nuclear receptor to use in the assay. The plates were incubated for approximately 1½–2 h at room temperature (covered) and read on an EnVision™ photomultiplier tube-based reader (PerkinElmer) with a post-excitation delay time of 100 μs and 50 flashes per well. An excitation filter (340 nm, PerkinElmer) was used for the excitation of the Tb-anti-GST antibody. Sequential emission values for fluorescein (520/25 nm, Chroma Technology, Rockingham, VT) and Tb3+ (495/10 nm, PerkinElmer) were measured for each well. The ratio of the emission intensities were calculated for each well (520 nm/495 nm) to correct for the differences in dispensed volumes between wells. Plates from the triplicate LOPAC validation screens were also read on the ViewLux™ (PerkinElmer) charge-coupled device (CCD) imager with a 2-s plate exposure time and 200-μs delay time.
Table 1.
TR-FRET PXR Assay Protocol in 1,536-Well Format
| Step | Parameter | Value | Description |
|---|---|---|---|
| 1 | (Reagent) | 3 μl | 2× Fluormone PXR Green |
| 2 | Compound library | 23 nl | 38.3 μM–0.5 nM dilution series (final concentration) |
| 3 | Reagent | 3 μl | 3× PXR-LBD/DTT/Tb-anti-GST antibody (nuclear receptor) |
| 4 | Incubation time | ~2 h | Compound interaction with PXR LBD |
| 5 | Detector | 495 nm and 520 nm sequential readings | EnVision detector |
| Notes | |||
2× Fluormone PXR Green was prepared by adding 20 μl of Fluormone Green stock/ml of assay buffer. Reagent was dispensed with FRD to 1,536-well black solid-bottom plates and covered with Kalypsys stainless steel gasket-containing plate lids.
Pin tool transfer of DMSO solutions of test and control compounds.
PXR-LBD/dithiothreitol/Tb-anti-GST antibody mixture consisted of combining 3× PXR-LBD, 0.1 M dithiothreitol, and 2× Tb-anti-GST antibody. 3× (1.5× final concentration) of PXR LBD was dispensed into the assay plates with the FRD.
Room temperature incubation (covered).
Excitation light (50%), delay (100 μs), window time (200 μs), time between flashes (2,000 μs), number of flashes for first detector (50), number of flashes for second detector (50), 340 nm excitation filter, 520/495 ratio is calculated.
Tb-anti-GST Antibody/Maltose Binding Protein (MBP) Assay
In order to test for experimental artifacts in the PXR TR-FRET assay, the LOPAC set was screened without PXR and Fluormone using instead a fluorescently labeled GST-tagged MBP (kit purchased from Invitrogen) to act as the acceptor for the Tb-anti-GST antibody. Fixed concentrations of Tb-anti-GST antibody (2 nM) and fluorescein-GST-MBP (5 nM) were diluted in TR-FRET dilution buffer (Invitrogen). Three microliters of 2× Tb-anti-GST antibody was dispensed with a BioRAPTR FRD into Kalypsys solid-bottom black 1,536-well plates. Test compounds were next pin tool-transferred (23 nl) into the assay plates, and 3 μl of 2× fluorescein-GST-MBP was dispensed into the plates. Plates were kept covered at room temperature for 1 h and read on the EnVision reader using the same settings as the PXR qHTS assay protocol.
Data Analysis
The qHTS concentration–response data for each compound were fit using software developed in-house (see http://www.ncgc.nih.gov/pub/openhts/curvefit/ for sample application) to the standard four-parameter Hill equation:
 |
where response is percentage activity, dose is the concentration of the tested compound, AC50 is the compound concentration at half-maximum activity, n is the slope of the Hill equation, and S0 and S∞ are the activities at zero and infinite activity, respectively. Curve fits to the data allow assignment of CRC classes that correspond to the efficacy and potency of the compounds as well as the quality of the curve fits. Overall, curve classification is based on a set of characteristics such as efficacy (with respect to controls, in this case SR12813) and quality of fit (r2) derived from the Hill equation. The CRC classification system has been described elsewhere4,30 but is also illustrated here in Scheme 1.
Scheme 1.

Example classification scheme for assignment of resulting curve-fitted data into CRC classes. The following classification criteria are used to establish SAR: Class 1 curves display two asymptotes, an inflection point, and r2 ≥ 0.9; subclasses 1a versus 1b are differentiated by full (>80%) versus partial (≤80%) response. Class 1a curves demonstrate high activity. Class 2 curves display a single left-hand asymptote and inflection point; subclasses 2a and 2b are differentiated by a maximum response and r2 with either >80% and >0.9 or <80% and <0.9, respectively. Class 3 curves have a single left-hand asymptote, no inflection point, and a response >3 standard deviations the mean activity of the sample field; hence they are often termed “inconclusive” and are lower confidence curves. Class 4 defines those samples showing no concentration–response relationship; thus they are inactive.
Minimum significant ratio (MSR) values for individual runs were calculated using normalized, background-corrected data from the control titrations of each assay plate. Control compounds T0901317 and SR12813 were titrated into adjacent columns of each 1,536-well plate in duplicate, 1:2 dilutions, such that a final concentration of 36.8 μM compound was present in wells 1 and 2, 18.4 μM compound in wells 3 and 4, etc., to a final value of 1.11 nM. Potency ratios for each titration column were calculated using pairs of 50% inhibitory concentration values found by fitting the titration data from the odd and even row wells separately using the standard Hill equation.30 The values of the log of these potency ratios were tabulated for each column, and the standard deviation of all potency ratios was used with the conventional MSR equation for values found in the same physical assay run34:
 |
where σ is the standard deviation of the log potency ratios from all runs.
The qHTS experiment allows us to analyze the data retrospectively, as a set of independent, single-concentration screens. A subset of the qHTS data at compound concentration values of 1.5, 7.7, and 38 μM was selected to assess how the assay performs in a traditional HTS mode. To create performance tables, a 3σ activity threshold (also referred to as statistical cutoff) was calculated using the standard deviation of the activity measured at the lowest concentration of the qHTS experiment, where activity is typically within the noise level of the assay. For the purposes of retrospective analysis, compounds yielding CRCs assigned to the highest confidence CRC classes (classes 1 and 2) are considered active. CRCs with activities exceeding the threshold at the test concentration are counted as confirmed true positives (TPs), while those with activities within the statistical cutoff are considered false negatives (FNs), because these are associated with high confidence CRCs but are not found as positive in the single-concentration assay. Compounds showing no concentration–response relationship are classified as inactive (class 4). The majority of these compounds are counted as true negatives (TNs) because their activities fall within the activity threshold limit. However, if an inactive compound's activity is found to be beyond the threshold at a single concentration, it is counted as a false positive (FP). In the case when a compound's data are successfully fit by the Hill equation but assigned a lower confidence CRC class (e.g., class 3), it is counted as TP if the measured activity is beyond the activity threshold at the test concentration but not counted towards the FN count if its activity falls below threshold4,30 because class 3 CRCs may be fit to data outside the single concentration tested range. We define % FN as the percentage of actives confirmed by qHTS that are classified at the test concentration as inactive, a quantity also known as the FN rate. The % FP, also referred to as the FP rate, is the percentage of positives as determined by the single test concentration threshold that were not classified as confirmed actives by qHTS.35
Spectroscopic Investigation of Rifampicin
Fluorescent excitation and emission spectra were recorded on a Fluoromax®-4 (Horiba Jobin Yvon, Edison, NJ) spectrofluorometer equipped with a single-cuvette sample holder. Spectra were recorded at room temperature in a 400-μl volume using a semi-micro-Spectrosil® far UV quartz 5-mm-pathlength cuvette (Starna Cells, Atascadero, CA). The monochromator wavelength steps were set at 1 nm, and integration time was 0.1 s. The excitation and emission slit widths were 2 nm. Terbium emission spectra were recorded using excitation wavelength of 342 nm, whereas excitation spectra were measured following the 487 nm emission peak. UV-visible spectrophotometry was performed on an Agilent Technologies (Palo Alto, CA) model 8453 diode-array spectrophotometer using a 100-μl sample in a 1-cm-pathlength semi-micro-cuvette. The absorbance spectrum of rifampicin in supplied TR-FRET dilution buffer (Invitrogen) was recorded at 16.7 μM compound concentration. To examine the quenching effect of rifampicin on Tb3+ fluorescence, a titration experiment was set up where increasing concentrations of rifampicin were added (1.25, 2.5, 3.75, 5, 7.5, 11, 17, 29, and 65 μM were used) to a solution of 5 nM LanthaScreen Tb-anti-GST antibody, and fluorescence excitation and emission spectra were measured approximately 1 min after sample mixing.
Results
The PXR TR-FRET assay utilizes a Tb3+ label on an anti-GST antibody. This antibody in turn binds to the GST tag of the PXR LBD. The Fluormone tracer (a fluorescently labeled ligand) binds to the ligand binding domain of PXR, and displacement of this Fluormone tracer is used to monitor the PXR-ligand interactions. Excitation of the Tb3+ antibody at 340 nm results in fluorescent emission at 495 nm, or the excited Tb3+ can transfer energy to bound Fluormone tracer yielding emission at 520 nm. A high TR-FRET signal is achieved when the Tb3+ and Fluormone tracer are in close proximity; however, this signal is disrupted when ligand binding displaces the Fluormone tracer (Fig. 1).
Fig. 1.

PXR TR-FRET assay overview. The TR-FRET assay principle relies on the proximity of two fluorophores, where excitation of a Tb3+-labeled antibody (donor molecule), bound to the GST-tagged portion of the nuclear receptor, at 340 nm results in fluorescent emission at 495 nm and energy transfer to a fluorescein-labeled acceptor ligand (Fluormone tracer) bound to the nuclear receptor. The transfer of energy to the acceptor molecule results in fluorescent emission at 520 nm and a high TR-FRET ratio (520 nm/495 nm). The TR-FRET assay reports on the ability of a test ligand to displace the Fluormone tracer molecule from the nuclear receptor, which results in a disruption of the energy transfer and loss of the TR-FRET signal.
Until this report, the TR-FRET-based PXR competitive binding assays had only been performed in 96- or 384-well plates. To increase the throughput of PXR compound screening, we miniaturized the PXR assay to a 1,536-well format to identify PXR ligands using qHTS. We optimized various parameters of the PXR protocol such as examining the performance in both polystyrene and polypropylene plates (due to nonspecific binding of the nuclear receptor with the polystyrene plate type), the order of reagent addition, PXR LBD concentration, and incubation time. In the originally described 384-well format,27 the suggested plate type is untreated polypropylene plates to minimize PXR nonspecific binding to the plate and maximize the assay window. To test the difference between polypropylene and polystyrene plates in 384-well format, we performed the assay in both plate types. After 1- and 2-h incubation times, there appeared to be no change in 50% effective concentration (EC50) values or loss in assay window for the polystyrene plates (data not shown); thus either type of plate can be used for the 384-well format. Next, we examined the order of reagent addition in 1,536-well format. The recommended order of reagent addition in 384-well format consisted of adding the compound of interest, followed by Fluormone tracer, and finally the PXR LBD/Tb-anti-GST antibody mixture. Because of the small volume of compound that is added to each well in the 1,536-well plate (23 nl), we compared the addition of Fluormone tracer or the PXR/Tb-anti-GST antibody mixture first. The best assay performance was achieved through the addition of Fluormone tracer first and PXR LBD/Tb-anti-GST antibody mixture last. In this mode, the compound and tracer are present together allowing competition between both components to occur simultaneously upon addition of the PXR LBD. However, it is worth noting that the results obtained when PXR was added first may have been a result of the receptor interaction with the compound before the tracer. In this case, the compound may appear more potent if competition with the tracer is slow, thus decreasing the assay window. Furthermore, if the compound and PXR are allowed to bind first, the maximal TR-FRET signal may not be achieved, and the bottom of the curve at high compound concentration may have lower TR-FRET with a slowly disassociating compound. The addition of PXR first to the plate also affects the Hill slope because there will be a heterogeneous population of PXR, some of which will have bound compound and some of which will not. In our experiments, the Hill slope and AC50 values were up to four and 10 times smaller, respectively, at all time points tested for cases where the PXR/Tb-anti-GST antibody mixture was added first compared to Fluormone tracer. To further optimize the assay, multiple reading times were taken from 1 to 3 h to identify the point at which the assay had reached equilibrium. An incubation time of approximately 2 h demonstrated the best Z′ factors36 (>0.5) and signal-to-background ratios between 2.5 and 3.5. The optimized 1,536-well plate-based protocol for the PXR assay is shown in Table 1. The time-resolved fluorescence delay times chosen were in the range reported for previous TR-FRET assays.37 Finally, there was no difference in assay signal or EC50 values when performing the 1,536-well assay protocol using either polystyrene or cyclic olefin polymer plates, which can reduce nonspecific protein interaction with the plate38; thus our final choice of assay plate was 1,536-well polystyrene black solid-bottom plates.
Following optimization, a qHTS against six chemical libraries consisting of 8,280 compounds was performed, with the LOPAC1280 library used for assay validation. Each 1,536-well plate contained compound titrations of the controls SR12813 and T0901317 at a final starting concentration of 9.6 μM. Each compound was tested at seven to 15 different concentrations with 38.3 μM as the highest concentration tested. To test the performance of the assay, we performed a triplicate LOPAC screen over three separate days on two separate readers. The inter-screen results, illustrating the reproducibility, of the triplicate LOPAC runs are shown in Fig. 2A. The statistically significant correlation between each of the three LOPAC runs (r2) ranged from 0.84 to 0.89, indicating good assay reproducibility. The best correlated LOPAC runs were performed on the first and second days, with an r2 of 0.89 (Fig. 2B). Overall, the reproducibility of the triplicate runs and AC50 correlation values show robust dispensing and compound transfer in the 1,536-well format for this assay. Furthermore, the average coefficient of variation (CV) percentage and Z′ value for the triplicate screening were 9.38% and 0.68, respectively, and the average signal-to-background ratios ranged from 2.5- to 3.5-fold. The reproducibility of the assay was also measured using MSRs of the control compounds,30,34 as described in Materials and Methods, which were found to range from 2.02 to 2.85 for SR12813 and from 1.56 to 2.23 for T0901317 within the triplicate LOPAC screens using the EnVision reader.
Fig. 2.

qHTS Reproducibility of PXR qHTS. Intra-screen data from triplicate qHTS runs of the LOPAC library are shown. (A) Seven-point CRCs for 1,280 compounds, performed in triplicate, demonstrate concentration-dependent inhibition of the TR-FRET signal (blue), activation of the TR-FRET signal (red), or inactives (gray). (B) Log AC50 correlation plot of compounds with class 1a, 1b, and 2a curves from runs 1 and 2 (r2 = 0.89; n = 43). Runs 1 versus 3 and 2 versus 3 had r2 values of 0.86 and 0.84, respectively (all P < 10−4).
To compare different microplate readers (photomultiplier tube- vs. CCD-based), the assay plates from the triplicate LOPAC screen were also read on a ViewLux CCD-based microplate reader. The average % CV and Z′ values were 12.9% and 0.61, respectively, and the average signal-to-background ratio ranged from 2.1 to 2.8. The CRCs of both assay controls, included on every assay plate, were highly reproducible. In the 27 1,536-well microplate validation plates on both readers, all data were deemed suitable for analysis. Although our assay produced comparable results between the two tested readers, our filter corresponding to the Tb3+ emission wavelength did not have an optimal lens thickness; hence this may have been a contributing factor to the slightly lower Z′ factor and higher % CV. Nevertheless, our results show that both readers would be acceptable for use in a TR-FRET assay in 1,536-well format.
As traditional HTS is performed at a single concentration, a retrospective analysis was performed to evaluate the performance of the qHTS assay in relation to single concentration screening datasets. We evaluated the sensitivity as judged by the FN rate and the selectivity of the assay as judged by the FP rates4,36 (Table 2). We compared compounds associated with CRC classes 1a, 1b, and 2a from the ratiometric data to identify positives with high confidence class 1 and 2 CRCs from the combined triplicate LOPAC screen. The sensitivity of the assay was measured by determining the percentage of FNs for the 1.5, 7.7, and 38 μM screening concentrations, which were found to be 67%, 11%, and 0.9%, respectively. Additionally, the selectivity of the assay was measured by the percentage of FPs for the 1.5, 7.7, and 38 μM screening concentrations, which were 12%, 4%, and 9%, respectively, showing that the assay has 88–96% accuracy for determining a TN. Furthermore, we noted the percentage of FPs and FNs depended on the screening concentrations, where the 7.7 μM concentration showed the lowest FP rate (3.7%) and the 38 μM concentration showed the lowest FN rate (0.9%). Overall, the retrospective analysis of the ratiometric data shown in Table 2 for the 7.7 μM concentration indicates excellent selectivity with an accuracy of greater than 96% for determining a TN with comparable sensitivity of 89% for determining all of the TPs. The inclusion of lower confidence class 3 curves results in the same FP rates for all three single concentrations; however, the FN rates for the 1.5, 7.7, and 38 μM concentrations were found to increase to 88%, 60%, and 13%, respectively.
Table 2.
Retrospective Analysis of 3× LOPAC Run (Ratiometric Data)
| Concentration (μM) | Total positive | TP | TN | FP | FN | % FP | % FN |
|---|---|---|---|---|---|---|---|
| 1.5 | 68 | 60 | 3,310 | 8 | 121 | 11.8 | 66.8 |
| 7.7 | 217 | 209 | 3,310 | 8 | 26 | 3.7 | 11.1 |
| 38 | 500 | 453 | 3,271 | 47 | 4 | 9.4 | 0.88 |
Retrospective analysis for the Tb3+ (donor) and fluorescein (acceptor) channels was also examined. Using CRC classes 1 and 2 as confirmed positives for the fluorescein channel revealed FP rates of 13%, 1%, and 5% and FN rates of 79%, 20%, and 0.63% for 1.5, 7.7, and 38 μM single concentration datasets, respectively. Inclusion of class 1–3 curves as confirmed positives for the fluorescein channel shows the same FP rate as the inclusion of class 1 and 2 curves; however, the FN rate increases to 93%, 68%, and 17% for the 1.5, 7.7, and 38 μM concentrations, respectively. Retrospective analysis of the Tb3+ (donor) 495 nm channel revealed similar or better FP and FN rates for the low and mid concentrations; however, these rates were considerably higher for the highest concentration than those found for the ratiometric data. Additionally, the majority of the concentration–response data are class 4 for this channel; hence the more meaningful comparison is between the fluorescein emission channel and the ratiometric data.
Similar to the LOPAC assay validation screening, each compound library was tested with between seven and 15 concentration points, and CRCs were generated for the remaining 7,000 compounds from five chemical libraries (Table 3). DMSO blank plates at the beginning and end of each assay set were used to subtract background effects, and each titration was generated using the Hill equation. The MSR values for the control compounds SR12813 and T0901317 from the compound library screen (excluding the LOPAC set) were 3.25 and 2.25, respectively. Control titration curves from each screen (excluding the LOPAC set) are shown for T0901317 (Fig. 3A) and SR12813 (Fig. 3B). The qHTS data from the calculated ratio for all inhibitors, activators, and inactive compounds are shown in Fig. 3C.
Table 3.
Potency and Curve Class of PXR qHTS Actives
| |
Curve classification |
|||||
|---|---|---|---|---|---|---|
| EC50 (μM) | 1a | 1b | 2a | 2b | 3 | Total |
| <1 | 26 | 10 | 0 | 1 | 2 | 39 |
| 1–10 | 113 | 58 | 65 | 99 | 4 | 339 |
| 10–100 | 2 | 5 | 101 | 163 | 105 | 376 |
| >100 | 0 | 0 | 0 | 0 | 0 | 0 |
| Total per classification | 141 | 73 | 166 | 263 | 111 | 754 |
| % of library | 2.0 | 1.0 | 2.4 | 3.8 | 1.6 | 10.8 |
Fig. 3.

qHTS CRCs generated in the PXR assay. Ratiometric data are shown. (A) 134 CRCs for T0901317 (MSR = 2.25). (B) 134 CRCs for SR12813 (MSR = 3.25). (C) Seven- to 15-point qHTS data for all compounds tested from five different libraries where inhibitors of the TR-FRET signal (blue), activators (red), and inactives (gray) are shown. qHTS data shown do not include the LOPAC validation runs.
Following CRC classification of the data, 754 (10.8% of the compounds screened) were identified as inhibitors (class 1–3 CRCs) of FRET, thus demonstrating PXR ligand binding. Of the 214 compounds that showed class 1 CRCs, 141 compounds had efficacies greater than 80% (class 1a), and 73 showed partial efficacy (<80%; class 1b). An additional 429 compounds had incomplete CRCs (classes 2a and 2b). The rest of the 111 compounds exhibited activity only at the highest concentration tested and/or had poor curve fits (class 3). (The complete data set may be obtained from the corresponding author.) In some cases, the activity of the compound exceeded that of the control (for example, a maximum activity of between −120% and −130% was observed for three compounds in the LOPAC screen). This occurred at the top two highest tested concentrations because of nonspecific effects on the assay signal. There were 39 compounds across all active CRC classes that were highly potent (EC50 <1 μM), with the most potent being NCGC00166188-01 (EC50 = 0.089 μM). CRCs for strong actives corresponding to the ratiometric (Fig. 4A), 520 nm fluorescein channel (Fig. 4B), and 495 nm Tb3+ channel (Fig. 4C) are shown. The ratiometric CRC curves illustrate the quality of the data compared to each of the individual channels, which have more outliers produced by assay artifacts. Two previously mentioned known PXR ligands, hyperforin (CRC class 1a) and rifampicin (CRC class 2b), exhibited increased PXR binding with increasing concentrations (Fig. 5). Other known ligands, such as cyclophosphamide, were not tested or were not picked up as active in the assay.
Fig. 4.

qHTS titration curves for CRC classes 1 and 2. CRCs for (A) ratiometric, (B) 520 nm, and (C) 495 nm channels are shown for the entire screen (excluding LOPAC validation runs).
Fig. 5.

qHTS curves for well-known PXR ligands: (A) hyperforin ratiometric CRC data taken from the Biomol collection and (B) rifampicin taken from the FDA 2 compound collection.
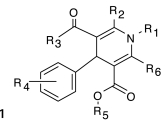
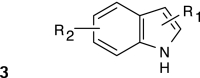
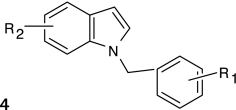
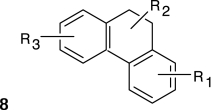
Structure–activity relationships (SARs) were elucidated among the actives using fragment-based analysis software developed at the National Institutes of Health Chemical Genomics Center. A set of relevant fragments (i.e., fragments for which there were a large number of compounds belonging to class 1a and 2a CRCs) was first identified from the fragment profiling across all screening libraries. A maximal common substructure search was then performed to expand on compounds associated with each selected fragment. We identified eight structural classes that are shown in Table 4. Scaffold 5 contained the largest percentage of compounds, with 478 compounds falling into this cluster from five chemical libraries. Of those compounds, 137 (29%) and 26 (31%) compounds were found active from the five chemical libraries or the LOPAC library screened, respectively.
Table 4.
Structures and Activities of PXR Actives
| Series | Count | Active | Potency range (μ M) |
|---|---|---|---|
 |
9 (6) | 8 (5) | 0.01–31.6 (1.41–28.2) |
| 201 (35) | 35 (9) | 2.51–31.6 (4.47–31.6) | |
 |
394 (58) | 91 (8) | 0.28–35.5 (0.28–10.0) |
 |
19 (7) | 9 (2) | 2.0–28.2 (2.0–12.6) |
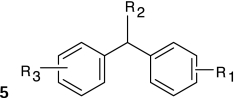 |
478 (84) | 137 (26) | 0.09–31.6 (0.04–28.2) |
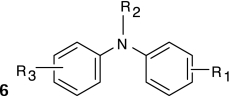 |
124 (26) | 30 (7) | 0.11–25.1 (0.11–12.6) |
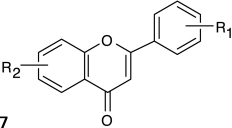 |
115 (5) | 17 (2) | 2.23–31.6 (8.9–12.6) |
 |
24 (6) | 17 (5) | 3.16–31.6 (3.16–15.8) |
Numbers in parentheses represent data for the LOPAC library.
Thirty compounds were chosen for follow-up studies, which included confirming the potency of these in the PXR assay using 24-point twofold dilutions and comparing their activity to the seven- to 15-point qHTS titrations. Selected compounds for follow-up included the most potent compounds unique to each library, at least one compound from the FP and FN lists, compounds that did not have the same CRCs or were not consistently found active or inactive (CRC class 4) across libraries obtained from different vendors, and compounds that displayed activation in the 520 nm channel and inhibition of Tb3+ in the 495 nm channel. Compounds were additionally profiled against preexisting qHTS databases for potential artifacts39,40 before they were retested. Of the compounds chosen for follow-up, there were several well-known PXR ligands, including retinoic acid,41,42 hyperforin,1,15 and rifampicin,3,22,41 that were identified in the original qHTS. There were five follow-up compounds that belonged to scaffold 3, one compound belonging to scaffold 5, and one compound belonging to scaffold 6 (see Appendix Table A1). Of the 30 compounds that were retested, those that had good CRC classes (1a, 2a, or 2b) across all qHTS assays were found to replicate in the follow-up study. For example, retinoic acid had class 1 or 2 CRCs across four libraries obtained from different vendors and demonstrated a class 1 CRC upon follow-up (Fig. 6). However, nine compounds did not replicate in curve class in the follow-up assay (see Appendix Table A1). One of these compounds, NCGC00093793-01, was also classified as a FP; hence the non-concurrence between CRC classes was not surprising. The remaining nine compounds were put through analytical quality control measurements to evaluate the identity and purity of the compound. Four compounds failed quality control measures, possibly due to degradation. The other compounds were sometimes associated with compounds that had weak or class 3 CRC (e.g., NCGC00024781-01). It is also important to note that rifampicin exhibited a weak CRC in the ratiometric data for confirmatory experiments because of signal decreases in both the Tb3+ and fluorescein channels (Fig. 7A). A decrease in the Tb3+ signal with increasing compound concentration can result from absorption of the excitation light at 340 nm and is referred to as light attenuation or the “inner filter effect.” We examined the absorption spectrum of rifampicin and its ability to attenuate both the fluorescent excitation and emission spectra of Tb3+ (Fig. 7B). A gradual concentration-dependent decrease in both the excitation and emission intensities was observed, consistent with at least an inner filter effect exerted by rifampicin at the Tb3+ excitation range. Indeed, a comparison between the Tb3+ excitation and rifampicin absorbance spectra indicates that approximately three-quarters of the Tb3+ excitation window can be blocked by rifampicin light absorbance; furthermore, the rifampicin absorbance peak at 340 nm almost perfectly matches the pair of Tb3+ excitation maxima. At high rifampicin concentrations, an additional mechanism of fluorescence quenching is possible, namely, the absorption of the fluorescence emitted by Tb3+. Although the exact contribution of rifampicin absorbance to the Tb3+ ~480 nm emission is difficult to calculate based on the present data, the effect is suggested by the presence of a second broad peak in the rifampicin absorbance spectrum that is centered around the same wavelength as the monitored Tb3+ emission, near 480 nm. Therefore, rifampicin is a potent light attenuator in the micromolar concentration range that distorts the fluorescent channel data leading to a right shift in the apparent potency of this compound (from the 0.7 μM reported value3 to >10 μM potency [Fig. 7A]). In addition, the CRC class associated with the ratiometric data in the follow-up assay (a lower confidence CRC) was also a result of inhibition in both the Tb3+ (class 2a) and fluorescein (class 1b) channels. Thus, it is also important to look at the fluorescein channel data as these also reflect the activity of the ligand. The rifampicin example illustrates the complexity of fluorescent interferences that makes these types of interferences difficult to anticipate.39 Finally, we noted that the standard deviation of retinoic acid AC50 values that was present in multiple libraries from different vendors (Fig. 6) were much higher (>4) across the libraries than the standard deviation of the AC50 values for the controls SR12813 (0.71) or T0901317 (0.09) contained on the same assay plates, implicating inter-vendor sample preparation differences as the reason for variability rather than assay performance.
Fig. 6.
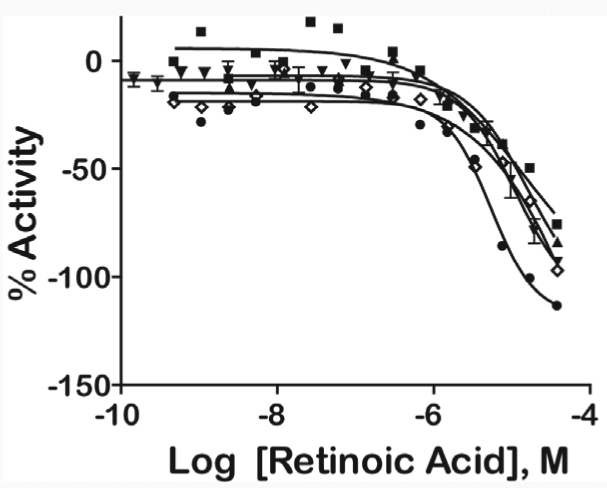
Intra-vendor and follow-up PXR qHTS curves for retinoic acid from various vendors: FDA (▪), LOPAC (▴), Tocris (⋄), Biomol (•), and follow-up sample (▾). The mean values taken from duplicate titration points are shown, and error bars represent standard error of the mean.
Fig. 7.

Fluorescent interference with Tb3+ fluorescence by rifampicin. (A) Response of rifampicin in the TR-FRET PXR confirmatory assay for the ratio (○), 495 nm (•), and 520 nm (□) emission channels. (B) Fluorescence excitation and emission spectra for 5 nM Tb-anti-GST antibody used in the PXR assay. The positive spectra represent the fluorescent signal of Tb3+ alone or with increasing concentrations of rifampicin (concentration range from 0 to 65 μM; gray shaded lines decreasing in fluorescent intensity). The negative spectrum represents the difference in intensity of the Tb3+ complex in the presence of 60 μM rifampicin minus the Tb3+ alone. The dotted line is represents the absorbance (Abs) spectrum of 16.7 μM rifampicin (scale shown on right y-axis). CPS, counts per second.
Because of our ability to interrogate CRCs for individual channels, we were able to identify compounds associated with artifacts such as light attenuation or fluorescence. Fluorescent interference is prevalent in HTS of compound libraries because of the heterocylic nature of small molecule libraries and the wide use of blue and green fluorescent labels.43 Further, fluorescent artifacts can be reproducible, often demonstrating a concentration–response relationship.39 However, the nature of the FRET assay is designed to alleviate interference from fluorescent compounds. Typically, a non-fluorescent, non-quenching PXR ligand should exhibit a signal change (inhibition) in the acceptor (fluorescein) and ratiometric channels with only a small change in the donor (Tb3+) channel.28 We observed several compounds that displayed attenuation of the Tb3+ 495 nm emission signal at increasing compound concentrations, where rifampicin is an important example of a light attenuator that confounds the activity of this PXR ligand. We also observed compounds that displayed activation in the 520 nm channel at increasing concentrations in every library screened in the assay (Fig. 4B and C). Overall, there were 414 compounds from the entire screen that displayed light attenuation in the Tb3+ channel and 74 compounds that displayed signal intensification in the fluorescein channel. One possibility contributing to compound fluorescence in the fluorescein emission channel may be diffusion-enhanced FRET, where fluorescent compounds at high concentrations (>1 μM) come into close contact with the Tb-antibody by diffusion during the integration time of the time-resolved fluorescence signal. Another possibility is the formation of aggregates, with moderate concentrations of nonionic detergents disrupting aggregate formation. Thus, we profiled the 74 activating compounds from the PXR screen against our aggregation databases,40 where compounds displayed aggregation without detergent and disrupted aggregation with detergent. We observed four compounds that displayed aggregation and sensitivity to detergent (NCGC00025381-01, NCGC00024486-04, NCGC00094270-01, and NCGC00094973-03). Furthermore, we observed 166 compounds that displayed strong or weak signal intensification in the Tb3+ channel, which most likely resulted from aggregation of the antibody (this effect can be minimized by centrifuging the antibody prior to use [noted by Invitrogen]). These compounds were profiled against the spectroscopic profiling database for the Tb3+ region and were not flagged as fluorescent. The 74 compounds showing signal intensification in the fluorescein channel were also compared against spectroscopic profiling results for this fluorophore.39 Of the 74 compounds, 29 were present in the profile database, and only one compound (NCGC00093577-01) was found as fluorescent. However, we must assume that these compounds are weakly fluorescent and that the apparent activation observed here could be due to a mechanism such as diffusion-enhanced FRET that can occur at high compound concentrations29 and may not correlate well with our prompt fluorescent-based database. In order to decipher whether the artifacts were intrinsic to the PXR assay, we performed a 1× LOPAC screen using a Tb-anti-GST antibody MBP kit. Similar to the PXR assay, this kit contains a Tb3+-labeled anti-GST antibody; however, the fluorescein is labeled to a GST-tagged portion of the MBP. The Tb3+ was added at a fixed concentration (2 nM), and the fluorescein was added in the same concentration as PXR used in the previously mentioned assays in this study (5 nM). There were 34 compounds that displayed light attenuation of the Tb3+ signal and two compounds that displayed an increase in fluorescence in the 520 nm channel in the MBP assay and across all three previous LOPAC runs on the EnVision reader (see Appendix Table A2). Of those two compounds, NCGC00093577-01 was fluorescent39; however, it did not form aggregates.40 Similarly, apparent activation seen in the ratiometric data will require further interrogation of each individual channel because it can arise from artifacts such as inhibition in each fluorophore channel or inhibition in the 495 nm channel but activation in the 520 nm channel.
Discussion
The identification of ligands that bind to the PXR receptor is important because of the role of PXR in drug metabolism and protein-protein interactions. The application of the TR-FRET assay in the identification of these ligands is an improvement over previous assays that have used radioactive binding assays and animal models. Another improvement is the ability to monitor the fluorescence of acceptor and donor fluorophores in TR-FRET mode, allowing for the ratiometric correction of dispensing and assay variation.28 Furthermore, the use of Tb3+ as a donor species has many advantages over traditionally used fluorophores, mainly due to its long emission half-life, which aids overcoming fluorescence background and compound interference. This assay was successfully optimized and validated in 1,536-well format, enabling qHTS screening of over 8,000 compounds as potential PXR ligands using a seven to 15 concentration-titration point series. The assay illustrated good performance with Z′ factors 0.5 and MSR values ~3 for the control compounds. Additionally, the ability to generate CRCs for Tb3+ and fluorescein emission allowed us to monitor for assay artifacts.
Screening at several concentration points allowed us to retrospectively evaluate assay performance for typical assay concentration ranges. Thus, we performed retrospective analyses on the individual Tb3+ and fluorescein channels, with the inclusion of class 1 and 2 and class 1–3 CRCs as confirmed positives, and compared those results to the analyses performed on the ratiometric data. Collectively, we found that the ratiometric data appear to provide overall superior assay performance over the fluorescein channel data, especially with regard to low to mid screening concentrations. However, higher concentrations result in assay artifacts, such as light attenuation, aggregation, or diffusion-enhanced FRET for certain compounds; thus the individual fluorescein channel was slightly superior to the ratiometric data at the 38 μM concentration. In general, taking the ratio of the 520 nm and 495 nm emission channels appears to correct for most of the assay variability from dispensing. However, an FN result can stem from the case where strong light attenuation is observed, as in the example of rifampicin. Overall, the 7.7 μM concentration is closest to the typical screening concentration of 10 μM, and we found excellent selectivity (accuracy of 96%) and selectivity (89% of the TP found) for the 1,536-well PXR assay at this concentration
It is important to note that advantages of TR-FRET assays involve the ratiometric nature of the assay and measuring TR-FRET after a delay time to reduce the effects of compound interference. We found that screening at a high concentrations (38 μM) did not increase the FP rate, whereas the FN rate was markedly reduced (99.4% of the TP were found). The ability to use such high screening concentrations may be an advantage of TR-FRET-based assays where compound interference is reduced, allowing screening at high compound concentrations to reduce FN rates without increasing FP rates. Experimentally, the previously mentioned artifacts can also be reduced by prereading plates with compound, Fluormone, and antibody prior to PXR addition. The plates can then be read in the presence of PXR, and the 495 nm and 520 nm emission channels can be compared in both conditions. Thus, any artifacts can be captured because there should be no change except for compound interference in the absence of PXR.
Our ability to identify known PXR ligands supports the biological relevance of the TR-FRET assay in 1,536-well format. The high-throughput format of the assay was supported by the assay validation, performance of two well-known controls, and identification of well-known ligands in the qHTS screen that were further confirmed in follow-up studies. Well-known compounds, such as retinoic acid (Fig. 6), were active in the qHTS screening platform across several different vendors and the follow-up analysis. The variation in potency values observed for retinoic acid may reflect differences in compound preparation or stability from different vendors.30 In addition, retinoic acid may have degraded because of its sensitivity in solution.44 We found that the standard deviation of retinoic acid AC50 was high (>4) because of inter-vendor sample preparation differences. However, the qHTS approach is able to account for such variation, although such inter-vendor variations may lead to mischaracterizing the activity of these compounds if a single concentration screening strategy is used.30 Known PXR ligands, such as cyclophosphamide, that were not picked up as active in the assay could have resulted from the use of PXR LBD outside of a cell-based system. Thus, future studies should incorporate the results presented here with those obtained from cell-based reporter assays.
The analysis of multiple channels in the TR-FRET format revealed assay artifacts that were further investigated using our own databases and a follow-up assay similar to the PXR assay format. Compounds associated with artifacts, such as aggregate formation, may not have been picked up by our previous profiling assays, as these results may be pH dependent, and not all compounds from our PXR screen were tested in these assays. Hence, future studies that examine compound aggregate sensitivity to detergent may have to be performed under different pH conditions. To aid in identifying fluorescent compounds, the protocol shown in Table 1 could be modified to include a preread of the fluorescent signal from the tracer and the compounds (e.g., after step 2) before the addition of the PXR-LBD. Furthermore, profile databases that identify compounds that interfere with TR-FRET-based detection through such mechanisms as diffusion-enhanced FRET will be a valuable asset in detecting such artifacts. Importantly, a light attenuation effect may be caused by compounds such as rifampicin with large extinction coefficients at the particular wavelength used to excite the donor species and absorption of light at the same emission wavelength used to excite the acceptor species. Our data demonstrate the importance of exploiting information from all channels of the TR-FRET, which was complemented by utilizing a qHTS platform. Additionally, future studies should compare human cell-based PXR reporter systems to the results described here using the PXR LBD. Overall, the 1,536-well PXR TR-FRET assay was found to be an excellent assay for interrogating large chemical libraries for PXR ligands.
Abbreviations
- AC50
compound concentration at half-maximum activity
- CCD
charge-coupled device
- CRC
concentration–response curve
- CV
coefficient of variation
- CYP
cytochrome P450
- DMSO
dimethyl sulfoxide
- EC50
50% effective concentration
- FDA
U.S. Food and Drug Administration
- FN
false negative
- FP
false positive
- FRD
flying reagent dispenser
- FRET
fluorescence resonance energy transfer
- GST
glutathione S-transferase
- LBD
ligand binding domain
- LOPAC
Library of Pharmacologically Active Compounds
- MBP
maltose binding protein
- MSR
minimum significant ratio
- PXR
pregnane X receptor
- qHTS
quantitative high-throughput screening
- SAR
structure-activity relationship
- Tb3+
terbium
- TN
true negative
- TP
true positive
- TR-FRET
time-resolved fluorescence resonance energy transfer
- UV
ultraviolet.
Appendices
Appendix Table A1.
Thirty Compounds Chosen for Retesting
| Compound ID | Name | Scaffold numbera | qHTS EC50 (μM)b | Follow-up EC50 (μM) | qHTS curve classb | Follow-up curve class | Quality control resultsc |
|---|---|---|---|---|---|---|---|
| NCGC00165830-01 | 0.56 | 0.44 | -1a | -1a | |||
| NCGC00163489-01 | Shikonin | 0.71 | 0.50 | -1a | -1a | ||
| NCGC00163120-01 | Hyperforin | 0.89 | 0.71 | -1a | -1a | ||
| NCGC00095664-01 | Hematein | 0.71 | 0.79 | -1a | -1a | ||
| NCGC00164581-01 | 2.24 | 0.79 | -1b | -1a | |||
| NCGC00163348-01 | Adrenochrome | 1.26 | 1 | -1a | -1a | ||
| NCGC00163650-01 | Cryptotanshinon | 1.58 | 1.26 | -1a | -1a | ||
| NCGC00025258-01 | GW 7647 | 2.51–5.0 | 1.26 | -1a to −2a | -1a | ||
| NCGC00016769-01 | Famprofazone | 3.98 | 1.58 | -2b | -1a | ||
| NCGC00025117-01 | JHW 015 | 3 | 3.54 | 2.51 | -1a | -1a | |
| NCGC00164601-01 | Liranaftate | 1.58 | 3.16 | -1b | -1a | ||
| NCGC00163292-01 | 7-(Dimethylcarbamoyloxy)-6-phenylpyrrolo-[2, 1-d][1,5] benzothiazepine | 5.01 | 3.55 | -1a | -1a | ||
| NCGC00166123-01 | 5 | 2.81 | 3.98 | -2a | -1a | ||
| NCGC00094956-01 | Cephaloridine | 3.16 | 4.47 | -1a | -1a | ||
| NCGC00164537-01 | Droxidopa | 5.62 | 5.01 | -1b | -1a | ||
| NCGC00021808-04 | Retinoic acid | 5.01–15.84 | 11.22 | -1a to −2b | -1a | ||
| NCGC00160678-01 | Fenoverina | 6 | 12.59 | 4.47 | -2b | -1bd | |
| NCGC00165741-01 | 1.41 | 7.94 | -1a | -1bd | |||
| NCGC00093691-01 | Bepridil hydrochloride | 0.71–12.59 | 14.13 | -2a to 4 | -1bd | Fail | |
| NCGC00022678-04 | Rifampicin | 12.59–14.13 | 14.13 | -2a to 4 | -1bd | Pass | |
| AB07981420-01 | Phenyl butazone | 5.01–31.62 | 15.84 | -3 to 4 | -1bd | Pass | |
| NCGC00094356-01 | SCH-202676 hydrobromide | 3.55–4.47 | 14.13 | -1a to −2b | -2a | ||
| NCGC00095348-03 | Diindoylmetyhane | 3 | 1.26 | 11.22 | -1a | -2bd | |
| NCGC00093793-01 | Dihydroergotamine methanesulfonate | 3 | 0.28–5.62 | 12.59 | -2bd to 4 | -2bd | Pass |
| AB07935373-01 | Thioctic acid | 0.003–7.94 | 25.11 | -2a to 4 | -2bd | Fail | |
| NCGC00163451-01 | GO 6976 | 3 | 10 | 7.08 | 2a | 1a | |
| NCGC00021621-02 | 7-Nitroindazole | -2ad to 4 | 4 | Fail | |||
| NCGC00017093-01 | Cephapirin sodium salt | -1a to 4 | 4 | Pass | |||
| NCGC00024781-01 | Carboxy PTIO potassium salt | 2bd | 4 | Pass | |||
| NCGC00024772-01 | SIN-1 chloride | 1a to 2a | 4 | Fail |
PTIO, 2-phenyl-4,4,5,5-tetramethylimidazoline-1-oxyl-3-oxide; SIN-1, 3-morpholinosydnonimine hydrochloride.
Compounds with blank entries were from different scaffolds than the ones listed.
Range of values are shown because of compound screening in multiple libraries.
Quality control analysis was performed on compounds that did replicate in the qHTS and follow-up assays.
These CRCs had poor r 2 values.
Appendix Table A2.
Artifact Confirmation in the MBP and LOPAC PXR Assays
| Sample ID | Name | Channel (nm emission) | Structure | MBP curve class | LOPAC run 1, 2, and 3 curve classes |
|---|---|---|---|---|---|
| NCGC00025016-02 | Quercetin | 495 |  |
-2b | -2b, −3, −3 |
| NCGC00025134-02 | GW5074 | 495 |  |
-2b | -2b, −3, −3 |
| NCGC00025170-02 | SU 4312 | 495 |  |
-2b | -2b, −2b, −2b |
| NCGC00025186-02 | SP 600125 | 495 |  |
-2b | -2b, −2b, −2b |
| NCGC00025211-02 | NSC 95397 | 495 |  |
-2b | -2b, −2b, −2b |
| NCGC00091540-02 | Emodin | 495 |  |
-2b | -2b, −2b, −2b |
| NCGC00093542-01 | 5-(N,N-Dimethyl) amiloride hydrochloride | 495 |  |
-2b | -2b, −3, −3 |
| NCGC00093577-01 | 4-Amino-1,8-naphthalimide | 495 |  |
-2b | -2b, −2b, −2b |
| NCGC00093601-01 | 5-(N,N-Hexamethylene) amiloride | 495 |  |
-2b | -2b, −2b, −2b |
| NCGC00093644-01 | Amsacrine hydrochloride | 495 |  |
-2b | -2b, −2b, −2b |
| NCGC00093830-01 | Dephostatin | 495 |  |
-2b | -2b, −2b, −2b |
| NCGC00093870-01 | R(-)-2,10,11-Trihydroxy-N-propylnoraporphine hydrobromide | 495 |  |
-2b | -2b, −3, −2ba |
| NCGC00093966-01 | BU99006 | 495 |  |
-2b | -2b, −2b, −3 |
| NCGC00093976-01 | Idarubicin | 495 |  |
-2a | -2a, −2a, −2a |
| NCGC00094000-01 | 6-Hydroxy-dl-DOPA | 495 |  |
-2b | -2b, −2b, −2b |
| NCGC00094031-01 | Ro 90-7501 | 495 |  |
-2b | -2b, −2b, −2b |
| NCGC00094083-01 | Myricetin | 495 |  |
-2b | -2b, −2b, −2b |
| NCGC00094116-01 | Mitoxantrone | 495 |  |
-1a | -2a, −2a, −2a |
| NCGC00094188-01 | Methysergide maleate | 495 |  |
-2b | -3, −3, −2b |
| NCGC00094195-01 | Me-3,4-dephostatin | 495 |  |
-2a | -2a, −2a, −2a |
| NCGC00094223-01 | NBQX disodium | 495 | 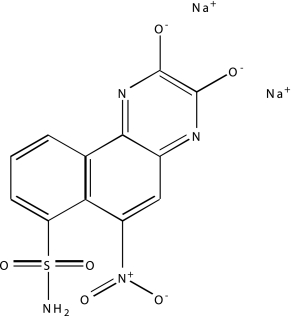 |
-2b | -2b, −2b, −2b |
| NCGC00094243-01 | PPNDS tetrasodium | 495 |  |
-2ba | -2a, −2a, −2a |
| NCGC00094244-01 | SU 9516 | 495 | 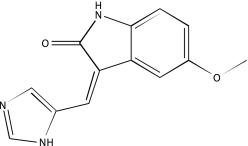 |
-2a | -2a, −2a, −2a |
| NCGC00094273-01 | Protoporphyrin IX disodium | 495 | 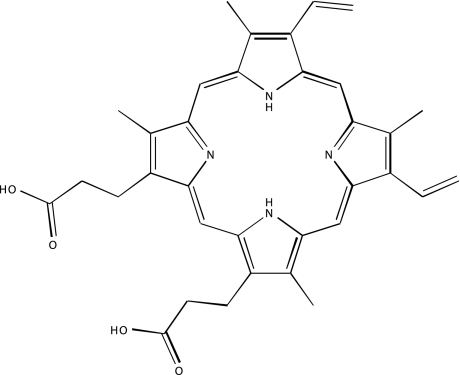 |
-2ba | -2b, −2b, −2b |
| NCGC00094309-01 | IC 261 | 495 |  |
-2b | -2b, −2b, −2b |
| NCGC00094336-01 | Reactive Blue 2 | 495 |  |
-2b | -2b, −2b, −2b |
| NCGC00094406-01 | Tyrphostin AG 112 | 495 |  |
-2b | -2b, −2b, −2b |
| NCGC00094427-01 | Tyrphostin AG 34 | 495 |  |
-2b | -2b, −2b, −2b |
| NCGC00094443-01 | Tyrphostin 25 | 495 | 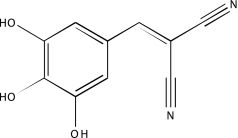 |
-2b | -2b, −2b, −2b |
| NCGC00094466-01 | Tyrphostin 47 | 495 | 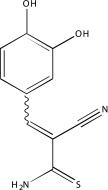 |
-2b | -2b, −2b, −2b |
| NCGC00094473-01 | Tyrphostin 51 | 495 | 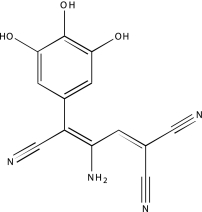 |
-2b | -2b, −2b, −2b |
| NCGC00094491-01 | I-OMe-Tyrphostin AG 538 | 495 | 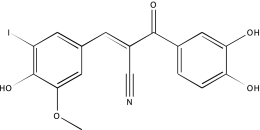 |
-2b | -2b, −2b, −2b |
| NCGC00094499-01 | Tyrphostin AG 538 | 495 |  |
-2b | -2b, −2b, −2b |
| NCGC00094505-01 | WB 64 | 495 |  |
-2a | -2b, −2b, −2b |
| NCGC00093577-01b | 4-Amino-1,8-naphthalimide | 520 | 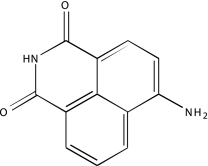 |
1a | 2a, 2a, 2a |
| NCGC00093754-01 | 7-Chloro-4-hydroxy-2-phenyl-1,8-naphthyridine | 520 | 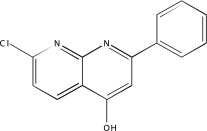 |
3 | 3, 3, 3 |
DOPA, 3,4-dihydroxy-l-phenylalanine; NBQX, 1,2,3,4-tetrahydro-6-nitro-2,3-dioxo-benzo[f]quinoxaline-7-sulfonamide; Abs, absolute flag indicating that the exact stereoisomer is as drawn; PPNDS, pyridoxal-5′-phosphate-6-(2′-naphthylazo-6′-nitro-4′,8′-disulfonate.
These CRCs had poor r2 values.
Fluorescent compound in 480 nmexcitaton/540 nmemission region based on previous spectroscopic data (PubChem assay identifier 591).
Acknowledgments
This research was supported by the Molecular Libraries Initiative of the NIH Roadmap for Medical Research and the Intramural Research Program of the National Human Genome Research Institute, National Institutes of Health. The authors wish to acknowledge Paul Shinn and Adam Yasgar for compound management, Ajit Jadhav for informatics support, Richard Jones for instrument set up and support, Jeremy Smith and William Leister for quality control measurements of compounds, and Cynthia Wadsworth and Kaitie VanDenHeuvel-Kramer for excellent assay, product, and technical support.
Disclosure Statement
W.J.F., T.M.H., B.D.M., U.S., H.C.E., and J.P. are employees of Invitrogen. The remaining authors declare no competing interests, financial or otherwise.
References
- 1.Kliewer SA. Goodwin B. Willson TM. The nuclear pregnane X receptor: a key regulator of xenobiotic metabolism. Endocr Rev. 2002;23:687–702. doi: 10.1210/er.2001-0038. [DOI] [PubMed] [Google Scholar]
- 2.Ma X. Idle JR. Gonzalez FJ. The pregnane X receptor: from bench to bedside. Expert Opin Drug Metab Toxicol. 2008;4:895–908. doi: 10.1517/17425255.4.7.895. [DOI] [PMC free article] [PubMed] [Google Scholar]
- 3.Moore LB. Parks DJ. Jones SA. Bledsoe RK. Consler TG. Stimmel JB, et al. Orphan nuclear receptors constitutive androstane receptor and pregnane X receptor share xenobiotic and steroid ligands. J Biol Chem. 2000;275:15122–15127. doi: 10.1074/jbc.M001215200. [DOI] [PubMed] [Google Scholar]
- 4.Zhu PJ. Zheng W. Auld DS. Jadhav A. Macarthur R. Olson KR, et al. A miniaturized glucocorticoid receptor translocation assay using enzymatic fragment complementation evaluated with qHTS. Comb Chem High Throughput Screen. 2008;11:545–559. doi: 10.2174/138620708785204045. [DOI] [PMC free article] [PubMed] [Google Scholar]
- 5.Maglich JM. Stoltz CM. Goodwin B. Hawkins-Brown D. Moore JT. Kliewer SA. Nuclear pregnane x receptor and constitutive androstane receptor regulate overlapping but distinct sets of genes involved in xenobiotic detoxification. Mol Pharmacol. 2002;62:638–646. doi: 10.1124/mol.62.3.638. [DOI] [PubMed] [Google Scholar]
- 6.Rosenfeld JM. Vargas R., Jr Xie W. Evans RM. Genetic profiling defines the xenobiotic gene network controlled by the nuclear receptor pregnane X receptor. Mol Endocrinol. 2003;17:1268–1282. doi: 10.1210/me.2002-0421. [DOI] [PubMed] [Google Scholar]
- 7.Handschin C. Meyer UA. Induction of drug metabolism: the role of nuclear receptors. Pharmacol Rev. 2003;55:649–673. doi: 10.1124/pr.55.4.2. [DOI] [PubMed] [Google Scholar]
- 8.Handschin C. Meyer UA. Regulatory network of lipid-sensing nuclear receptors: roles for CAR, PXR, LXR, and FXR. Arch Biochem Biophys. 2005;433:387–396. doi: 10.1016/j.abb.2004.08.030. [DOI] [PubMed] [Google Scholar]
- 9.Matic M. Mahns A. Tsoli M. Corradin A. Polly P. Robertson GR. Pregnane X receptor: promiscuous regulator of detoxification pathways. Int J Biochem Cell Biol. 2007;39:478–483. doi: 10.1016/j.biocel.2006.08.017. [DOI] [PubMed] [Google Scholar]
- 10.Willson TM. Kliewer SA. PXR, CAR and drug metabolism. Nat Rev Drug Discov. 2002;1:259–266. doi: 10.1038/nrd753. [DOI] [PubMed] [Google Scholar]
- 11.Jacobs MN. Dickins M. Lewis DF. Homology modelling of the nuclear receptors: human oestrogen receptorbeta (hERβ), the human pregnane-X-receptor (PXR), the Ah receptor (AhR) and the constitutive androstane receptor (CAR) ligand binding domains from the human oestrogen receptor alpha (hERα) crystal structure, and the human peroxisome proliferator activated receptor alpha (PPARα) ligand binding domain from the human PPARγ crystal structure. J Steroid Biochem Mol Biol. 2003;84:117–132. doi: 10.1016/s0960-0760(03)00021-9. [DOI] [PubMed] [Google Scholar]
- 12.Lemaire G. Benod C. Nahoum V. Pillon A. Boussioux AM. Guichou JF, et al. Discovery of a highly active ligand of human pregnane x receptor: a case study from pharmacophore modeling and virtual screening to “in vivo” biological activity. Mol Pharmacol. 2007;72:572–581. doi: 10.1124/mol.106.033415. [DOI] [PubMed] [Google Scholar]
- 13.Lemaire G. Mnif W. Pascussi JM. Pillon A. Rabenoelina F. Fenet H, et al. Identification of new human pregnane X receptor ligands among pesticides using a stable reporter cell system. Toxicol Sci. 2006;91:501–509. doi: 10.1093/toxsci/kfj173. [DOI] [PubMed] [Google Scholar]
- 14.Honkakoski P. Sueyoshi T. Negishi M. Drug-activated nuclear receptors CAR and PXR. Ann Med. 2003;35:172–182. doi: 10.1080/07853890310008224. [DOI] [PubMed] [Google Scholar]
- 15.Moore LB. Goodwin B. Jones SA. Wisely GB. Serabjit-Singh CJ. Willson TM, et al. St. John's wort induces hepatic drug metabolism through activation of the pregnane X receptor. Proc Natl Acad Sci U S A. 2000;97:7500–7502. doi: 10.1073/pnas.130155097. [DOI] [PMC free article] [PubMed] [Google Scholar]
- 16.Jones SA. Moore LB. Shenk JL. Wisely GB. Hamilton GA. McKee DD, et al. The pregnane X receptor: a promiscuous xenobiotic receptor that has diverged during evolution. Mol Endocrinol. 2000;14:27–39. doi: 10.1210/mend.14.1.0409. [DOI] [PubMed] [Google Scholar]
- 17.Fugh-Berman A. Herb-drug interactions. Lancet. 2000;355:134–138. doi: 10.1016/S0140-6736(99)06457-0. [DOI] [PubMed] [Google Scholar]
- 18.Barwick JL. Quattrochi LC. Mills AS. Potenza C. Tukey RH. Guzelian PS. Trans-species gene transfer for analysis of glucocorticoid-inducible transcriptional activation of transiently expressed human CYP3A4 and rabbit CYP3A6 in primary cultures of adult rat and rabbit hepatocytes. Mol Pharmacol. 1996;50:10–16. [PubMed] [Google Scholar]
- 19.Bertilsson G. Heidrich J. Svensson K. Asman M. Jendeberg L. Sydow-Bäckman M, et al. Identification of a human nuclear receptor defines a new signaling pathway for CYP3A induction. Proc Natl Acad Sci U S A. 1998;95:12208–12213. doi: 10.1073/pnas.95.21.12208. [DOI] [PMC free article] [PubMed] [Google Scholar]
- 20.Blumberg B. Sabbagh W., Jr Juguilon H. Bolado J., Jr van Meter CM. Ong ES, et al. SXR, a novel steroid and xenobiotic-sensing nuclear receptor. Genes Dev. 1998;12:3195–3205. doi: 10.1101/gad.12.20.3195. [DOI] [PMC free article] [PubMed] [Google Scholar]
- 21.Kocarek TA. Schuetz EG. Strom SC. Fisher RA. Guzelian PS. Comparative analysis of cytochrome P4503A induction in primary cultures of rat, rabbit, and human hepatocytes. Drug Metab Dispos. 1995;23:415–421. [PubMed] [Google Scholar]
- 22.Lehmann JM. McKee DD. Watson MA. Willson TM. Moore JT. Kliewer SA. The human orphan nuclear receptor PXR is activated by compounds that regulate CYP3A4 gene expression and cause drug interactions. J Clin Invest. 1998;102:1016–1023. doi: 10.1172/JCI3703. [DOI] [PMC free article] [PubMed] [Google Scholar]
- 23.Liddle C. Robertson GR. Predicting inductive drug-drug interactions. Pharmacogenomics. 2003;4:141–152. doi: 10.1517/phgs.4.2.141.22639. [DOI] [PubMed] [Google Scholar]
- 24.Glickman JF. Schmid A. Ferrand S. Scintillation proximity assays in high-throughput screening. Assay Drug Dev Technol. 2008;6:433–455. doi: 10.1089/adt.2008.135. [DOI] [PubMed] [Google Scholar]
- 25.Parks DJ. Blanchard SG. Bledsoe RK. Chandra G. Consler TG. Kliewer SA, et al. Bile acids: natural ligands for an orphan nuclear receptor. Science. 1999;284:1365–1368. doi: 10.1126/science.284.5418.1365. [DOI] [PubMed] [Google Scholar]
- 26.Zhou G. Cummings R. Li Y. Mitra S. Wilkinson HA. Elbrecht A, et al. Nuclear receptors have distinct affinities for coactivators: characterization by fluorescence resonance energy transfer. Mol Endocrinol. 1998;12:1594–1604. doi: 10.1210/mend.12.10.0176. [DOI] [PubMed] [Google Scholar]
- 27.http://tools.invitrogen.com/content.cfm?pageid=10512. [Nov;2008 ]. http://tools.invitrogen.com/content.cfm?pageid=10512
- 28.Imbert PE. Unterreiner V. Siebert D. Gubler H. Parker C. Gabriel D. Recommendations for the reduction of compound artifacts in time-resolved fluorescence resonance energy transfer assays. Assay Drug Dev Technol. 2007;5:363–372. doi: 10.1089/adt.2007.073. [DOI] [PubMed] [Google Scholar]
- 29.Jeyakumar M. Katzenellenbogen JA. A dual-acceptor time-resolved Foster resonance energy transfer assay for simultaneous determination of thyroid hormone regulation of corepressor and coactivator binding to the thyroid hormone receptor: mimicking the cellular context of thyroid hormone action. Anal Biochem. 2009;386:73–78. doi: 10.1016/j.ab.2008.11.039. [DOI] [PMC free article] [PubMed] [Google Scholar]
- 30.Inglese J. Auld DS. Jadhav A. Johnson RL. Simeonov A. Yasgar A, et al. Quantitative high-throughput screening: a titration-based approach that efficiently identifies biological activities in large chemical libraries. Proc Natl Acad Sci U S A. 2006;103:11473–11478. doi: 10.1073/pnas.0604348103. [DOI] [PMC free article] [PubMed] [Google Scholar]
- 31.Yasgar A. Shinn P. Jadhav A. Auld D. Michael S. Zheng W, et al. Compound management for quantitative high-throughput screening. JALA Charlottesv Va. 2008;13:79–89. doi: 10.1016/j.jala.2007.12.004. [DOI] [PMC free article] [PubMed] [Google Scholar]
- 32.Niles WD. Coassin PJ. Piezo- and solenoid valve-based liquid dispensing for miniaturized assays. Assay Drug Dev Technol. 2005;3:189–202. doi: 10.1089/adt.2005.3.189. [DOI] [PubMed] [Google Scholar]
- 33.Cleveland PH. Koutz PJ. Nanoliter dispensing for uHTS using pin tools. Assay Drug Dev Technol. 2005;3:213–225. doi: 10.1089/adt.2005.3.213. [DOI] [PubMed] [Google Scholar]
- 34.Eastwood BJ. Farmen MW. Iversen PW. Craft TJ. Smallwood JK. Garbison KE, et al. The minimum significant ratio: a statistical parameter to characterize the reproducibility of potency estimates from concentration-response assays and estimation by replicate-experiment studies. J Biomol Screen. 2006;11:253–261. doi: 10.1177/1087057105285611. [DOI] [PubMed] [Google Scholar]
- 35.Zhang JH. Wu X. Sills MA. Probing the primary screening efficiency by multiple replicate testing: a quantitative analysis of hit confirmation and false screening results of a biochemical assay. J Biomol Screen. 2005;10:695–704. doi: 10.1177/1087057105279149. [DOI] [PubMed] [Google Scholar]
- 36.Zhang JH. Chung TD. Oldenburg KR. A simple statistical parameter for use in evaluation and validation of high throughput screening assays. J Biomol Screen. 1999;4:67–73. doi: 10.1177/108705719900400206. [DOI] [PubMed] [Google Scholar]
- 37.von Ahsen O. Schmidt A. Klotz M. Parczyk K. Assay concordance between SPA and TR-FRET in high-throughput screening. J Biomol Screen. 2006;11:606–616. doi: 10.1177/1087057106288183. [DOI] [PubMed] [Google Scholar]
- 38.Niles WD. Coassin PJ. Cyclic olefin polymers: innovative materials for high-density multiwell plates. Assay Drug Dev Technol. 2008;6:577–590. doi: 10.1089/adt.2008.134. [DOI] [PubMed] [Google Scholar]
- 39.Simeonov A. Jadhav A. Thomas CJ. Wang Y. Huang R. Southall NT, et al. Fluorescence spectroscopic profiling of compound libraries. J Med Chem. 2008;51:2363–2371. doi: 10.1021/jm701301m. [DOI] [PubMed] [Google Scholar]
- 40.Feng BY. Simeonov A. Jadhav A. Babaoglu K. Inglese J. Shoichet BK, et al. A high-throughput screen for aggregation-based inhibition in a large compound library. J Med Chem. 2007;50:2385–2390. doi: 10.1021/jm061317y. [DOI] [PubMed] [Google Scholar]
- 41.Kliewer SA. The nuclear pregnane X receptor regulates xenobiotic detoxification. J Nutr. 2003;133(7 Suppl):2444S–2447S. doi: 10.1093/jn/133.7.2444S. [DOI] [PubMed] [Google Scholar]
- 42.Wang T. Ma X. Krausz KW. Idle JR. Gonzalez FJ. Role of pregnane X receptor in control of all-trans retinoic acid (ATRA) metabolism and its potential contribution to ATRA resistance. J Pharmacol Exp Ther. 2008;324:674–684. doi: 10.1124/jpet.107.131045. [DOI] [PMC free article] [PubMed] [Google Scholar]
- 43.Inglese J. Johnson RL. Simeonov A. Xia M. Zheng W. Austin CP, et al. High-throughput screening assays for the identification of chemical probes. Nat Chem Biol. 2007;3:466–479. doi: 10.1038/nchembio.2007.17. [DOI] [PubMed] [Google Scholar]
- 44.http://www.sigmaaldrich.com/sigma/product%20information%20sheet/r2625pis.pdf. [Dec;2008 ]. http://www.sigmaaldrich.com/sigma/product%20information%20sheet/r2625pis.pdf