Abstract
We demonstrate a three-step assay on a silicon photonic microring resonator-based detection platform that enables the quantitation of the cardiac biomarker C-reactive protein (CRP) over a dynamic range spanning six orders of magnitude. Using antibody-modified microrings, we sequentially monitor primary CRP binding, secondary recognition of bound CRP by a biotinylated antibody, and tertiary signal amplification using streptavidin-functionalized beads. This detection methodology is applied to CRP quantitation in human serum and plasma samples.
Most new biosensor development efforts focus almost exclusively on improving detection sensitivity for a particular target analyte. While this is clearly a vital metric, assay dynamic range is also an important attribute that critically influences clinical utility. The dynamic range challenge is even more pronounced for multiplexed analyses, where both intra- and inter-analyte concentrations can vary widely. For example, the cardiovascular risk biomarker C-reactive protein (CRP) can increase by a factor of 10,000 in serum during an acute phase response.1 Moreover, protein concentrations in human plasma are known to vary over 11 orders of magnitude.2 Whereas single-analyte assays can incorporate repeated dilutions, multiplexed analyses of antigens that natively vary in magnitude represent a significant analytical challenge.
Recently, chip-integrated, silicon photonic microcavities have been developed for a number of biosensing applications.3 Importantly, the scalability and multiplexing capability inherent to these semiconductor-based devices make them attractive for many high volume applications, including in vitro clinical diagnostics. Because they are responsive to binding-induced changes to the refractive index (RI) environment near the resonator surface, these sensors are intrinsically label-free. Our group has previously investigated the applicability of microring optical resonator arrays for protein analysis and demonstrated the detection of analytes in both single4 and multiplexed5 formats using an initial slope-based quantitation technique. This approach features a superior linear dynamic range of ~3 orders of magnitude, while maintaining a limit of detection (LOD) comparable to that of a commercial enzyme-linked immunosorbent assay (ELISA). We also have shown that the incorporation of a secondary antibody recognition event can further lower the limit of detection while also increasing assay specificity in complex sample matrices.6 However, because of surface-saturation effects, quantitation at higher concentrations is restricted, resulting in a more limited dynamic range similar to that of other sandwich immunoassays.7
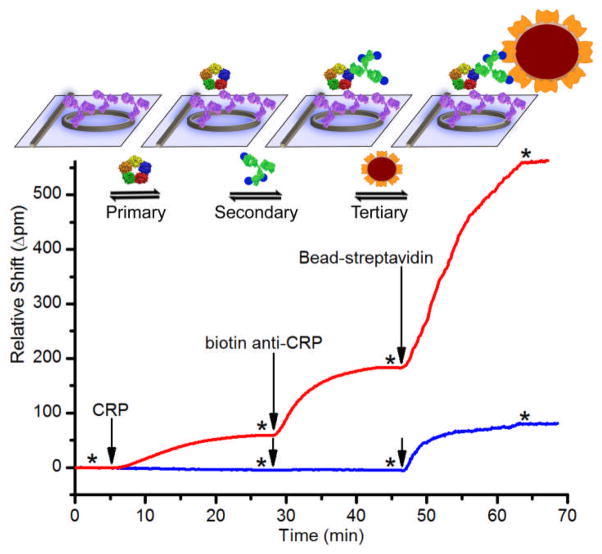
In this paper, we report the analytical utility of a three-step assay format in which primary, secondary, and bead-enhanced tertiary binding events are observed in series in order to sensitively quantitate the presence of an antigen over a broad (~106) dynamic range. As shown in Fig. 1, the primary and secondary measurements are conducted as described previously.4,6 The subsequent tertiary detection event involves the binding of streptavidin (SA)-coated, sub-micron (~100 nm diameter) beads to biotinylated secondary antibodies. Similar to previous reports using nanoparticles,8–10 carbon nanotubes,11 and enzymatic amplification12 to enhance the signal of RI-based sensing devices, our tertiary binding assay lowers the LOD by enhancing the optical signal arising from a single bound antigen. However, more useful here is the integration of a consecutively run assay that includes the real-time observation of all three discrete binding regimes. This methodology broadens the dynamic range to over six orders of magnitude.
Fig. 1.
Schematic and real-time data plot showing sequential addition of CRP, biotinylated secondary antibody, and SA-functionalized beads. The red trace is 10−1 μg/mL CRP. The blue trace is 10−3 μg/mL CRP. * indicates buffer rinse, and arrows indicate solution injection.
As a representative analyte that is known to vary over a wide dynamic range in clinical samples,1 CRP is quantitated via a three-step assay protocol in buffer, human serum, and human plasma. 24-sensor chips were functionalized with a capture antibody against CRP (see ESI†) leaving four sensors on each chip unfunctionalized to serve as controls. For each experiment, two microfluidic channels per chip were used, each having ten active sensors and two controls.
As shown in the red trace in Fig. 1, the addition of 10−1 μg/mL CRP (t = 5 min) resulted in a visible primary binding response. Subsequent addition of biotinylated anti-CRP (t = 28 min) gave a ~3-fold larger response. Finally, addition of 100-nm SA-functionalized beads (t = 46 min) provided an even larger signal enhancement. At this relatively high concentration, secondary and tertiary amplification gave large signals, but they were not required for CRP detection. However, at lower concentrations such as 10−3 μg/mL CRP (blue trace in Fig. 1), amplification was necessary. At or below this concentration, no primary binding was detected, and the secondary binding showed ~1 pm resonance wavelength shift. Notably, addition of the beads gave nearly a 100-fold signal enhancement at this low concentration. Negative control experiments, in which biotinylated antibody and SA-beads were flowed over an anti-CRP-functionalized chip without initial CRP incubation, yielded no appreciable signal (ESI Fig. S1).
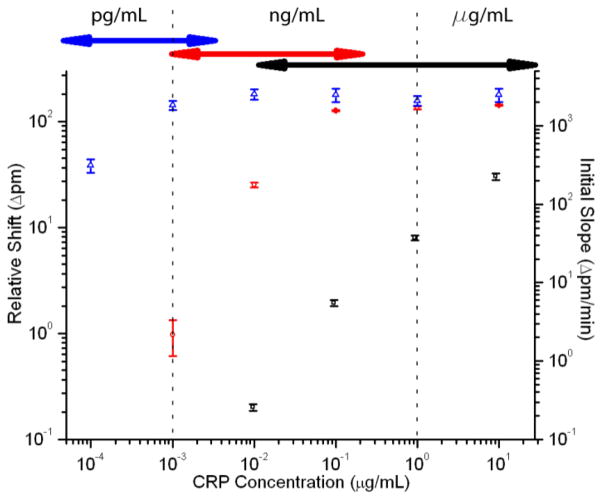
After determining the nature of the three-step signal enhancement process, CRP standards were measured across a 5-order-of-magnitude concentration range using the sequential primary-secondary-tertiary assay protocol. As shown in Fig. 2, the response curves from the primary, secondary, and tertiary binding assays overlap, allowing continuous CRP calibration over a broad dynamic range (10−4 μg/mL to 10 μg/mL). The initial slope of primary binding (black squares) is important because, at high concentrations, the surface is nearly saturated. Thus, it is impossible to distinguish between high concentrations except by the rate at which they approach saturation.4 Using initial slopes, it is possible to quantify concentrations from 10−2 to >10 μg/mL in buffer. The dynamic range is extended (10−3 to >10−1 μg/mL) by measuring the relative shift in resonance wavelength following addition of secondary antibody (red circles) and further expanded down to <10−4 μg/mL though the use of SA-bead enhancement (blue triangles). Using the bead-based enhancement, the overall assay LOD is ~3 × 10⁻⁵ μg/mL (~200 fM).
Fig. 2.
Log-log calibration plot showing the response of the microring resonators to varying concentrations of CRP using the three-step assay. Black squares indicate the initial slope of the primary binding (right axis), red circles indicate secondary antibody shift, and blue triangles indicate bead shift (left axis). Error bars represent 95% CI for n=17–47 rings for each concentration. Arrows at top represent overlap of dynamic ranges for each assay portion.
The dynamic range of each step of the three-part analysis method has a region of overlap with one of the other steps (Fig. 2), providing the opportunity for confirmation of the measurement. For example, 10−3 μg/mL CRP is quantifiable by secondary detection, but tertiary amplification significantly increases the measurement precision (ESI Fig. S2/Table S1).
Following assay calibration, the same three-step detection protocol was applied to the quantitation of CRP in human plasma and serum samples. Because the expected range of concentrations of CRP in human blood is from 10−1 μg/mL to 103 μg/mL, each sample was subjected to the same 1:1000 dilution into buffer, bringing concentrations into the range that could most accurately be quantified. This uniform dilution, as opposed to repeated dilutions, also helped reduce non-specific adsorption of blood proteins and lowered the required sample volumes to less than ten microliters, making the assay amenable to fingerprick sampling.
For the purposes of quantitation we utilized a standard addition method as it is amenable to the complex and variable clinical sample matrices.13 In this method, the diluted serum or plasma was first analysed via the three-step assay, and the response was compared to the calibration curve (Fig. 2) to roughly estimate the CRP concentration range. Three appropriate samples with increasing standard additions were then successively analysed, and the precise CRP concentration was determined via extrapolation. The wide variation in native CRP levels required user input into the standard addition procedure, as opposed to simply adding uniform amounts of standard. However, the overall methodology is amenable to automation; for example, an analytical system pre-programmed with the calibration information could utilize integrated microfluidics to create the appropriate standard additions on demand.
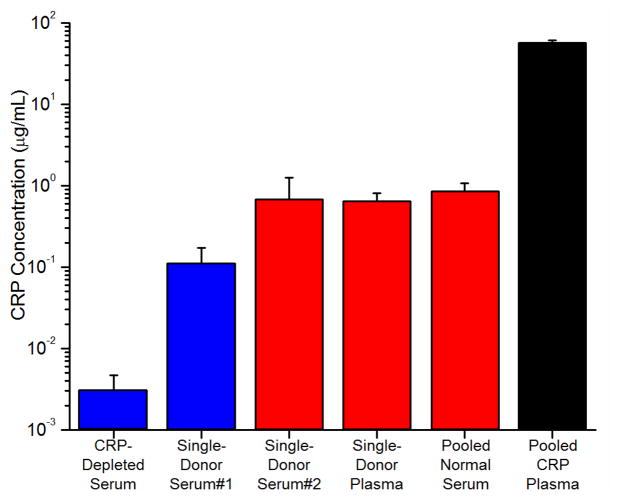
Fig. 3 shows the results of these serum/plasma analyses (see Fig. S3 in ESI for standard addition plots). The colours in the graph indicate the method used to quantify the CRP concentration. The black bar indicates that a commercially obtained pooled plasma sample with elevated CRP was quantified using the primary binding response and found to have a CRP concentration of 57.5 ± 3.3 μg/mL. This value obtained on the microring resonator platform agreed reasonably well with the supplier’s provided value of 69.1 μg/mL. This result was in closer agreement than the results of an ELISA run in parallel, which gave a CRP concentration of 105 ± 11 μg/mL (ESI Table S2). The red bars indicate secondary binding-based detection, which was used to quantitate the CRP values in the pooled-donor normal serum, single-donor serum #2, and single-donor plasma. The blue bars indicate quantitation using the tertiary bead binding, which was necessary to detect CRP within single-donor serum #1 as well as a commercially-available CRP-depleted serum sample (in which CRP had been removed by the vendor). Each of the samples analysed, with the exception of the CRP-elevated pooled plasma, had CRP levels less than 1 μg/mL, placing those donors in the low-risk range for cardiovascular disease.1 Interestingly, for the CRP-depleted sample, analysis of a 1:100 dilution revealed CRP levels at 3×10⁻⁵ μg/mL. While this concentration is far below what would typically be found in human serum, it is noteworthy that this is similar to the lowest levels of CRP present in saliva.14 This means that the three-step assay format on the silicon photonic-based platform is amenable to quantifying CRP in all clinically-relevant sample matrices.
Fig. 3.
Detection of CRP in human serum and plasma samples. All samples are diluted 1:1000 in buffer except for the CRP-depleted serum, which was diluted 1:100. Error bars represent the error in the x-intercept determination used in the standard addition analysis.
In the course of our studies, we observed that several of the serum and plasma samples gave abnormally large signals for primary binding to microrings functionalized with the capture anti-CRP antibody, but a much smaller secondary binding response. These interactions, which we attribute to cross-reactivity between the primary antibody and some unknown component, highlight the fact that sample-to-sample heterogeneity can greatly complicate analysis in clinical samples. In the case of the pooled plasma with elevated CRP, the primary binding signal was much larger than any of the off-target responses, and thus it did not interfere with primary response-based quantitation. However, for the single-donor plasma and serum samples, as well as the pooled normal serum, the primary off-target signal indicated abnormally high CRP content. Fortunately, the proportionally smaller secondary binding response increased the specificity of the assay, giving more reliable levels of CRP. Although some of the complications associated with clinical samples might be reduced by employing alternative antibodies or improved surface treatments, cross-reactivity and non-specific interactions are particularly difficult to completely avoid for multiplexed assays from within complex sample matrices, underscoring the utility of this three-step measurement format that allows analytes to be measured at multiple levels, increasing both the specificity of the assay and reducing false positive responses.
Conclusions
In this paper, we demonstrate a three-step immunoassay on a scalable silicon photonic biosensing platform that enables a protein antigen to be detected over six orders of magnitude of concentration in complex, clinically-relevant sample matrices. While primary binding allows detection at higher concentrations, subsequent secondary and tertiary binding events significantly lower the LOD. The secondary and tertiary binding also increases the specificity of the assay by requiring additional target-specific recognition, allowing discrimination against non-specific interferants. Using this approach in a standard addition format, we determined the concentration of CRP in both human serum and plasma across a broad dynamic range while avoiding the need for multiple serial dilutions. This methodology, which is facilitated by a real-time and modularly multiplexable sensor technology, is applicable beyond the detection of CRP (see Fig. S4 in ESI for of DNA and cytokine assays). The generality of this technique should make it useful in multiplexed analyses where analytes may differ in concentration by orders of magnitude.
Supplementary Material
Acknowledgments
We acknowledge support from the NIH Director’s New Innovator Award Program, part of the NIH Roadmap for Medical Research, through grant number 1-DP2-OD002190-01, and from the Camille and Henry Dreyfus Foundation. M.S.L and A.L.W were supported via National Science Foundation Graduate Research Fellowship. M.S.L. and M.S.M. were supported via Robert C. and Carolyn J. Springborn Fellowships from UIUC.
Notes and references
- 1.McDonnell B, Hearty S, Leonard P, O’Kennedy R. Clin Biochem. 2009;42:549–561. doi: 10.1016/j.clinbiochem.2009.01.019. [DOI] [PubMed] [Google Scholar]
- 2.Anderson NL, Anderson NG. Mol Cell Proteomics. 2002;1:845–867. doi: 10.1074/mcp.r200007-mcp200. [DOI] [PubMed] [Google Scholar]
- 3.Washburn AL, Bailey RC. Analyst. 2011;136:227–236. doi: 10.1039/c0an00449a. [DOI] [PMC free article] [PubMed] [Google Scholar]
- 4.Washburn AL, Gunn LC, Bailey RC. Anal Chem. 2009;81:9499–9506. doi: 10.1021/ac902006p. [DOI] [PMC free article] [PubMed] [Google Scholar]
- 5.Washburn AL, Luchansky MS, Bowman AL, Bailey RC. Anal Chem. 2010;82:69–72. doi: 10.1021/ac902451b. [DOI] [PMC free article] [PubMed] [Google Scholar]
- 6.Luchansky MS, Bailey RC. Anal Chem. 2010;82:1975–1981. doi: 10.1021/ac902725q. [DOI] [PMC free article] [PubMed] [Google Scholar]
- 7.Law B, editor. Immunoassay: A Practical Guide. Taylor & Francis; London: 1996. pp. 186–192. [Google Scholar]
- 8.He L, Musick MD, Nicewarner SR, Salinas FG, Benkovic SJ, Natan MJ, Keating CD. J Am Chem Soc. 2000;122:9071–9077. [Google Scholar]
- 9.Kim S, Lee J, Lee SJ, Lee HJ. Talanta. 2010;81:1755–1759. doi: 10.1016/j.talanta.2010.03.036. [DOI] [PubMed] [Google Scholar]
- 10.Sim HR, Wark AW, Lee HJ. Analyst. 2010;135:2528–2532. doi: 10.1039/c0an00457j. [DOI] [PubMed] [Google Scholar]
- 11.Lee EG, Park KM, Jeong JY, Lee SH, Baek JE, Lee HW, Jung JK, Chung BH. Anal Biochem. 2011;408:206–211. doi: 10.1016/j.ab.2010.09.026. [DOI] [PubMed] [Google Scholar]
- 12.Li Y, Lee HJ, Corn RM. Anal Chem. 2007;79:1082–1088. doi: 10.1021/ac061849m. [DOI] [PMC free article] [PubMed] [Google Scholar]
- 13.Harris DC. Quantitative Chemical Analysis. W H Freeman and Company; New York: 1999. pp. 101–104. [Google Scholar]
- 14.Dillon MC, Opris DC, Kopanczyk R, Lickliter J, Cornwell HN, Bridges EG, Nazar AM, Bridges KG. Biomarker Insights. 2010;5:57–61. doi: 10.4137/bmi.s5305. [DOI] [PMC free article] [PubMed] [Google Scholar]
Associated Data
This section collects any data citations, data availability statements, or supplementary materials included in this article.


