Abstract
In arterial spin labeling (ASL) MRI to measure cerebral blood flow (CBF), pair-wise subtraction of temporally adjacent non-labeled and labeled images often can not completely cancel the background static tissue signal because of temporally fluctuating physiological noise. While background suppression (BS) by inversion nulling improves CBF temporal stability, imperfect pulses compromise CBF contrast. Conventional BS techniques may not be applicable in small animals because the arterial transit time is short. This study presents a novel approach of BS to overcome these drawbacks using a separate ‘neck’ radiofrequency coil for ASL and a ‘brain’ radiofrequency coil for BS with the inversion pulse placed before spin labeling. The use of a separate ‘neck’ coil for ASL should also improve ASL contrast. This approach is referred to as the inversion-recovery BS with the two-coil continuous ASL (IR-cASL) technique. The temporal and spatial contrast-to-noise characteristics of basal CBF and CBF-based fMRI of hypercapnia and forepaw stimulation in rats at 7 Tesla were analyzed. IR-cASL yielded two times better temporal stability and 2.0–2.3 times higher functional contrast-to-noise ratios for hypercapnia and forepaw stimulation compared with cASL without BS in the same animals. The Bloch equations were modified to provide accurate CBF quantification at different levels of BS and for multislice acquisition where different slices have different degree of BS and residual degree of labeling. Improved basal CBF and CBF-based fMRI sensitivity should lead to more accurate CBF quantification and should prove useful for imaging low CBF conditions such as in white matter and stroke.
Keywords: arterial spin labeling, rodents, cerebral blood flow, cerebral perfusion, high fields, inversion recovery
INTRODUCTION
Cerebral blood flow (CBF) is tightly coupled to metabolic function under normal physiologic conditions (1). Perturbations of basal CBF and stimulus-evoked CBF responses have been implicated in many neurological diseases including stroke, brain tumor and neurodegenerative disorders. The arterial spin labeling (ASL) MRI technique (2) is widely utilized to image CBF because it is totally non-invasive. The magnetically tagged water has a short effective half-life (~ blood T1), allowing repeated CBF measurements which can be used to dynamically image CBF changes associated with functional stimulation or to augment spatial resolution and/or the signal-to-noise ratio (SNR). Quantitative CBF can be obtained using MRI at high spatiotemporal resolution. Functional MRI based on CBF changes is less susceptible to inter-subject variations and pathologic perturbations (3), yields better spatial localization to sites of increased neural activities (4) and is easier to interpret compared with the blood-oxygenation-level-dependent (BOLD) fMRI signals.
The major limitation of CBF ASL MRI and ASL-based fMRI is low SNR. Perfusion signal in the brain is only 1–4% compared with the background tissue signal. Importantly, pair-wise subtraction of temporally adjacent non-labeled and labeled images in ASL measurements often could not achieve complete cancellation of the background static tissue signal as a result of physiological noise that fluctuates across time. Background suppression (BS) of a static tissue signal by inversion was initially proposed for MRI angiography (5,6). Ye et al. subsequently applied BS to ASL and reported substantial improvements in the CBF SNR (7). van Osch et al. showed that BS and pseudo-continuous ASL significantly improve detection of white-matter CBF (8). While ideal inversion pulses should not attenuate the ASL signal, signal loss because of T1 recovery, T2 decay and the unwanted magnetization transfer effect in blood associated with BS inversion pulses occur in practice. Duyn et al. reported a 9% reduction in perfusion signal loss with one inversion suppression pulse (9). Ye et al. reported a 17% decrease in the ASL signal with two inversion pulses (7). Garcia et al. evaluated the effects of BS inversion pulses on the ASL signal in blood phantom and in vivo (10) and found that BS attenuated the ASL signal and that the slow magnetization transfer effect in blood dominated the inversion inefficiency. Thus, the advantages of improved BS with inversion pulses need to be carefully weighed against loss of perfusion contrast. Furthermore, conventional BS strategies in ASL techniques that apply inversion pulses during the post-labeling delay (> 1 s) may not be applicable in small animals in which the arterial transit time is very short (~ 200 ms) (11) and thus post-labeling delay is shorter than inversion delay.
This study presents a novel approach to achieve BS without compromising ASL perfusion contrast because of BS inversion pulse imperfection in rodent models. This was achieved by independently modulating BS and tagging arterial spins using two different radiofrequency (RF) coils. BS utilizes inversion-recovery nulling using the ‘brain’ RF coil, whereas continuous ASL utilizes a separate labeling coil at the neck position. BS inversion pulse is applied before the labeling pulse which avoids compromise of ASL perfusion contrast by imperfect inversion pulses and thus should provide improved ASL perfusion contrast compared with the conventional BS scheme (i.e. where BS pulses are placed after the labeling pulse). This approach is referred to as the inversion-recovery BS using the two-coil continuous ASL technique (IR-cASL). The temporal and spatial contrast-to-noise characteristics of basal CBF and CBF-based fMRI of hypercapnic challenge and forepaw stimulation in rats at 7 Tesla were analyzed and compared with conventional two-coil cASL without BS. The Bloch equations were modified to quantify CBF at different levels of background static tissue suppression and applied to calculate CBF in multilice acquisition where different image slices have different degrees of the BS and residual degree of labeling.
THEORY
A schematic of the IR-cASL sequence is shown in Fig. 1. An adiabatic inversion RF pulse is used to suppress the static brain tissue signal via the primary RF channel using a brain surface coil. The adiabatic radiofrequency pulse via the secondary RF channel is used for ASL. The labeling duration (LD), post-labeling delay (PLD), half of the excitation pulse and half of the BS pulse duration together constitute the inversion recovery delay (TI) which can be varied to achieve optimal nulling of the static brain signal. A delay can also be inserted between the BS inversion pulse and the onset of labeling to modulate inversion contrast independent of labeling duration (not shown).
Figure 1.
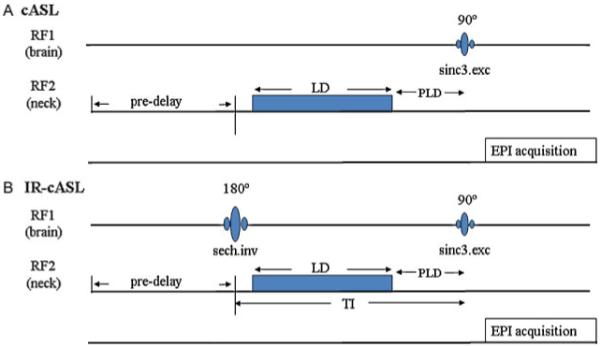
Pulse sequence diagram for (A) continuous arterial spin labeling (cASL) and (B) inversion recovery (IR)-cASL. Inversion pulse for the background suppression is transmitted via the brain coil on the first radiofrequency (RF) channel. The ASL is transmitted via a separate neck coil on the second RF channel. The inversion delay TI is the sum of labeling duration (LD) and post-labeling delay (PLD), half the inversion pulse length and half of the excitation pulse length. The pre-delay is used for magnetization to return to equilibrium. Image acquisition uses gradient-echo echo-planar imaging.
The longitudinal Bloch equation including the effect of tissue perfusion (f) is given by (2):
| [1] |
assuming water is a freely diffusible tracer (Mv=Mb/λ), where Mb=longitudinal magnetization of tissue water protons per gram of brain tissue, , T1=spin-lattice relaxation time of brain water in the absence of flow or exchange between blood and the brain, Ma=arterial magnetization per ml of blood, Mv=venous magnetization per mL of blood and λ=the brain/blood partition coefficient for water defined as [(quantity of water/g of brain)/(quantity of water/mL of blood)].
After a BS inversion pulse applied via a surface brain coil to suppress the brain static background tissue signal and without arterial spin labeling, new blood with positive magnetization enters in the image plane,
| [2] |
Eqn [1] can be rewritten as
| [3] |
| [4] |
With (β is the inversion efficiency), Mb(t) can be solved as
| [5] |
where
| [6] |
After the BS inversion and with arterial spin labeling during t, the neck arterial blood spins are inverted with a labeling efficiency of α (assuming no arterial transit time). Thus,
| [7] |
Then eqn [1] can be rewritten as
| [8] |
| [9] |
With , Mb(t) can be solved as
| [10] |
Solving for blood flow f from eqns [5] and [10] and assuming t=LD, yields,
| [11] |
where blood flow is proportional to ΔM (≡ Mnon-labeled − Mlabeled). Considering arterial transit time from the labeling plane to the perfusion site, the inversion state of the labeled spins at the perfusion site is no longer α, but becomes
| [12] |
where w is the arterial transit time, and T1a is the T1 of arterial blood. For PLD equals to arterial transit time (w=PLD), eqn [11] can be rewritten as
| [13] |
For multislice acquisition, assuming identical arterial transit time cross slices, perfusion contrast loss (with relaxation time of T1app) during multislice acquisition time needs to be compensated. Thus,
| [14] |
where n is the slice number, Ts is the acquisition time for one image slice. If the difference between T1a and T1app is ignored and PLDn=PLD+(n-1)Ts, eqn [14] can be simplified as
| [15] |
T1 recovery of the brain tissue signal across multislice acquisition is already accounted for in eqns [5] and [10].
The equation for conventional cASL acquisition has identical form except the Mnon-labeled and Mlabeled are not inverted.
MATERIALS AND METHODS
Animal preparation
Fifteen male Sprague–Dawley rats (250 to 350 g, Charles River) were initially anesthetized with 2% isoflurane in air. Once the rats were secured in a MRI compatible rat stereotaxic headset, anesthesia was reduced to 1.2% to 1.3% isoflurane. Rats breathed spontaneously without mechanical ventilation. Rectal temperature was maintained at 37.0±0.5°C. Respiration rate was derived from chest motion via a force transducer (SA Instruments, Inc., Stony Brook, NY, USA). Heart rate and blood oxygen saturation level were monitored using the MouseOx system (STARR Life Science Corp., Oakmont, PA, USA). All recorded physiological parameters were maintained within normal physiologic ranges unless otherwise perturbed.
Hypercapnia and forepaw stimulation
Hypercapnic challenges used a premixed gas of 5% CO2 with 21% O2 and balance N2. Air was used as the baseline. Forepaw somatosensory stimulation used the previously optimized parameters under isoflurane anesthesia (12): a 6 mA current with 0.3 ms pulse duration at 3 Hz. Needle electrodes were inserted under the skin of the two forepaws. The electrodes were connected in series to simultaneously stimulate two forepaws. Hypercapnic challenge and forepaw stimulation scans were acquired alternately using IR-cASL or cASL. Each hypercapnic challenge trial consisted of 3 min of data acquired during baseline and 3 min of data acquired during hypercapnic challenge. Forepaw stimulation consisted of 80 s baseline, 40 s stimulation, 80 s baseline and 40 s stimulation. A break of 15 min was given between ‘stimulations’ (i.e. forepaw stimulation and hypercapnic challenge).
MRI
MRI experiments were performed on a 7-T/30-cm magnet, a Biospec Bruker console (Billerica, MA, USA) and a 40-G/cm gradient insert (ID=12 cm, 120-ms rise time). A surface coil (2.3-cm ID) was used for brain imaging and a butterfly neck coil (5-mm ID) for perfusion labeling (13), the labeling gradient was 1.0-G/cm. The center-to-center distance between the image and label coils was 2 cm. Coil-to-coil electromagnetic interaction was actively decoupled. Paired images were acquired alternately: one with arterial spin labeling and the other without. Both cASL and IR-cASL were acquired on the same animals using identical parameters except that the IR-cASL sequence included a non-spatially selective BS inversion pulse of 20-ms hyperbolic secant applied via the brain coil. BS suppression was spatially selective by the surface coil sensitivity profile, thus there was no cross-talk with the labeling coil. A long BS pulse was used to maximize inversion efficiency and minimize RF bandwidth to minimize magnetization transfer effects.
Three types of experiments were performed: (i) basal CBF using variable LD on a single image slice, (ii) basal CBF using a fixed LD on multislice acquisition and (iii) fMRI using a fixed LD on a single image slice. For the basal CBF measurement using variable LD (experiment no. 1), a single-shot, gradient-echo, EPI acquisition of a single 1.5-mm horizontal slice was used with a spectral width=300 kHz, data matrix=64×64, FOV = 3.0×3.0 cm (469×469 μm), TE=10.2 ms, TR=6s (90° flip-angle), and typical variable labeling durations of 0.8, 0.9, 1.0, 1.1, 1.2, 1.3, 1.4, 1.5, 1.6, 1.8, 1.9, 2.0 and 3.0 s.
For multislice acquisition of basal CBF (experiment no. 2), the same parameters were used except that seven transverse 1.5-mm slices were acquired. In addition, a higher resolution (234×234 μm) was also acquired using partial-Fourier (3/4), single-shot GE EPI, data matrix=128×64, FOV=3.0×1.5 cm, 7 transverse 1.5-mm slices, TE=9.8 ms, TR=3 s and LD=1.4 s, and the data readout time for each slice Ts was 41.5 ms. The total acquisition time of both low and high resolutions was 3 min each.
For fMRI using fixed LD (experiment no. 3), hypercapnic challenge and forepaw stimulation fMRI data were acquired using a single-shot, gradient-echo, EPI acquisition of a single 1.5-mm horizontal slice using a spectral width=300 kHz, data matrix=64×64, FOV=3.0×3.0 cm, TE=10.2 ms, TR=2 s (90° flip-angle) and LD of 0.9 s. Hypercapnic challenge was also done with 1.0 s and 1.9 s of LD for IR-cASL. The relative short TR (2 s) is used to improve temporal resolution. Note that the null point for 2 s TR was ~0.7 s and thus these fMRI data were acquired away from the null point.
The PLD was short (i.e. 10 ms) which may affect absolute CBF quantification. Our and previously published data did not show severe large vessel contamination, probably because of the short arterial transit time and relatively fewer large vessels in the rodent brain, compared with the human brain. Future studies should use longer delays (~200 ms in normal tissue) (11).
Data analysis
Data analysis used codes written in Matlab (MathWorks Inc., Natick, MA, USA) and the STIMULATE (University of Minnesota) software. The following analyzes were performed: (i) Normalized Snon-labeled, Slabeled and ΔS/S (where ΔS ≡ Snon-labeled − Slabeled) at a single labeling duration were plotted as a function of labeling durations and compared between cASL and IR-cASL. The normalizations were done by dividing the mean value of Snon-labeled of cASL scans. (ii) Experimental data were modeled using eqns [5] and [10] with f=1 mL/g/min (14), λ=0.9 mL/g (15), T1=1.8 s (16), α=0.8 [measured using a method described in (17)] and β=0.9 [derived from our experimental data)]. (iii) Temporal standard deviation (SD) maps of normalized were derived from the time series data of baseline CBF scans. values were tabulated pixel by pixel and compared between cASL and IR-cASL in whole brain (all available brain tissue in the images) and white matter ROIs, respectively. (iv) Quantitative CBF images were calculated using eqn [11], T1blood of 1.95 s (18) and T1app of 1.74 s. For multislice acquisition, CBF was calculating using eqn [14] and Ts of 41.5 ms. In both cases, the non-labeled images of cASL (without inversion pulse, TR=6 s) were taken as . (v) Hypercapnic challenge and forepaw stimulation CBF fMRI percent changes were derived. Cross-correlation and contrast-to-noise ratio (CNR) analyzes were performed. CNR was defined as, , where is the mean value of stimulation period, is the mean value of baseline period, and is the SD of the baseline period. CNR maps were calculated and group-averaged results were tabulated for 3×3 pixels in the primary somatosensory cortices for forepaw stimulation and whole brain for hypercapnic challenge.
Activation maps for hypercapnic challenges and forepaw stimulations were obtained using cross-correlation analysis with a minimal of four clusters (for display purposes only) with p-values << 0.01. Tabulated values (such as CBF and SD in Table 1) used ROI analysis to avoid bias and are presented as means±SDs. Statistical tests used paired t-tests with p<0.05 indicating statistical significance, unless other stated.
Table 1.
Comparison of temporal standard deviations (SDs), contrast-to-noise ratios (CNR) and cross correlation coefficient (CCC) between inversion recovery continuous arterial spin labeling (IR-cASL) and continuous arterial spin labeling (cASL). For the hypercapnic challenge, the CNR was obtained from the whole-brain region of interest (ROI). For forepaw stimulation, CNR was obtained from 3×3 pixel ROIs of the primary somatosensory cortices
| Standard deviation |
|||||
|---|---|---|---|---|---|
| whole brain | white matter | CO2 fMRI CNR | Forepaw fMRI CNR | Forepaw CCC | |
| IR-cASL | 0.32±0.04 a | 0.45±0.02 b | 6.3±1.0 c | 6.3±2.8 d | 0.47±0.07 e |
| cASL | 0.57±0.11 a | 0.90±0.19 b | 3.2±0.5 c | 2.8±2.3 d | 0.30±0.10 e |
p=0.01 (n=6)
p=0.0002 (n=6)
p=0.01 (n=5)
p=0.02 (n=4)
p=0.01 (n=4) for comparison between IR-cASL and cASL.
Note that non-labeled time-series data, which are often taken as BOLD fMRI data, were not shown because the results were not reliable as the echo times were not optimized for BOLD contrast.
RESULTS
Figure 2A shows the normalized whole-brain signal intensities of non-labeled and labeled signals from one animal as a function of different labeling durations. The raw signal intensities of the IR-cASL signal were substantially lower than those of cASL because of BS. The difference between Snon-labeled and Slabeled (ΔS) increased slightly with increased labeling durations, but did not appear to differ significantly between cASL and IR-cASL. The sign of ΔS reversed at LD below the inversion null point (i.e.<1 s) as expected. Figure 2B shows the group-averaged ΔS/Snon-labeled in percentage changes were larger for IR-cASL compared with cASL (5% to 24% versus 2% to 4%).
Figure 2.
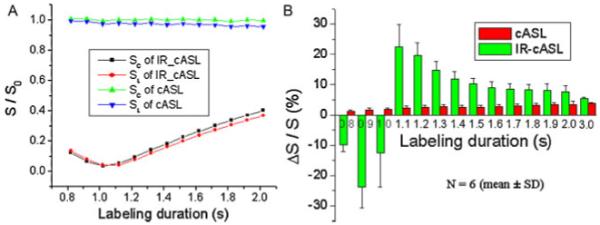
(A) Normalized Snon-labeled and Slabeled signal intensities as a function of labeling durations for inversion recovery continuous arterial spin labeling (IR-cASL) and cASL acquisition from one animal. Normalization was taken with respective to the mean value of Snon-labeled of cASL scans. (B) Group-averaged ΔS/S in percentage as a function of labeling durations of the cASL and IR-cASL acquisition. Normalization was taken with respective to each method’s non-labeled signal.
We modeled the experimental data at different inversion delays using eqns [5] and [10]. Figure 3 shows the theoretical values (lines) of normalized signal intensities versus labeling durations from eqns [5] and [10] using f=1.0 mL/g/min, λ=0.9 mL/g, T1=1.8 s, T1app=1.74 s, α=0.8 and β=0.9. They consistent with the experimental data (data points).
Figure 3.
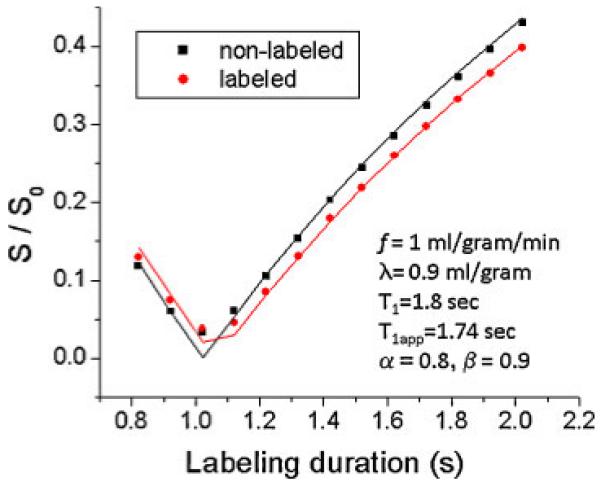
Modeling of eqns [5] and [10] on experimental data. Snon-labeled and Slabeled signal intensities are plotted as a function of labeling duration of the inversion recovery continuous arterial spin labeling (IR-cASL) experiments. Data points were experimental data. Lines were derived from eqns [5] and [10] using parameters as shown.
Representative CBF maps of cASL and IR-cASL with LD=2 s are shown in Fig. 4A. By visual inspection, cASL and IR-cASL showed similarly good CBF contrast. Whole-brain CBF values were similar across different labeling durations (Fig. 4B), supporting the validity of eqn [11]. CBF values for LD <1.4 s were not analyzed because they were close to the null point. To quantify the potential improvement, temporal standard deviation (SD) maps of normalized perfusion contrast were analyzed pixel by pixel (Fig. 4C). The whole-brain temporal SD for different LDs (from 1.4 to 3.0 s) was plotted in Fig. 4D. The whole-brain temporal SD of IR-cASL was significantly (p<0.05) smaller than that of cASL for LD=1.4–2.0 s because of the BS effect. At LD=3.0 s, magnetization mostly recovered towards equilibrium and thus IR-cASL and cASL yielded similar temporal SD as expected (p=0.09). For cASL, there was a trend that the longer LD yielded lower perfusion temporal SD (r=−0.77, p=0.025). No trend was observed for IR-cASL (r=0.35, p=0.39). Table 1 summarizes the average temporal SDs for LDs=1.4 to 3.0 s. The temporal SDs were 44% lower in whole brain and 50% lower in the white matter of IR-cASL than those of cASL.
Figure 4.
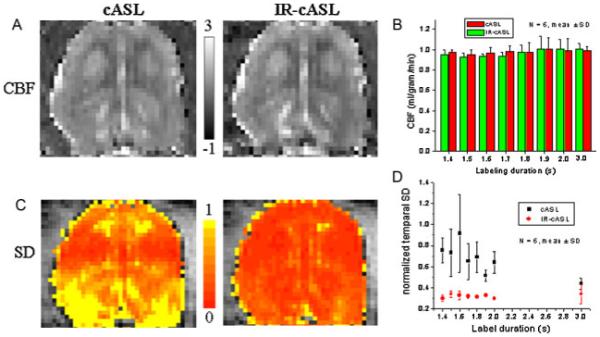
(A) Cerebral blood flow (CBF) images of the continuous arterial spin labeling (cASL) and inversion recovery (IR)-cASL acquisition (horizontal view). (B) CBF values versus labeling durations. Scale bars indicate CBF units in mL/g/min. (C) Temporal standard deviation (SD) maps of cASL and IR-cASL acquisition. (D) Temporal SDs of cASL and IR-cASL versus labeling durations.
Multislice CBF images were determined using eqn [14], accounting for the effects of multislice acquisitions (Fig. 5). CBF images at two different spatial resolutions are shown. The acquisition time was 3 mins each for both low- and high-resolution datasets.
Figure 5.
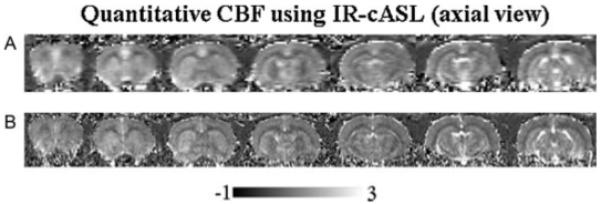
Multislice cerebral blood flow (CBF) images (ml/g/min) by inversion recovery continuous arterial spin labeling (IR-cASL) at (A) 490×490 μm and (B) 245×245 μm (transverse view). The total acquisition time was 3 mins for each resolution.
Representative CNR maps associated with hypercapnic challenge are shown in Fig. 6. The whole-brain CNR of IR-cASL was significantly higher than that of cASL. Hypercapnia-induced CBF percent changes were 42±1, 45±2 and 42±9 for TI of 921 ms, 1021 ms, 1921 ms, respectively, which were not statistically different over the range of inversion delays (p>0.05).
Figure 6.
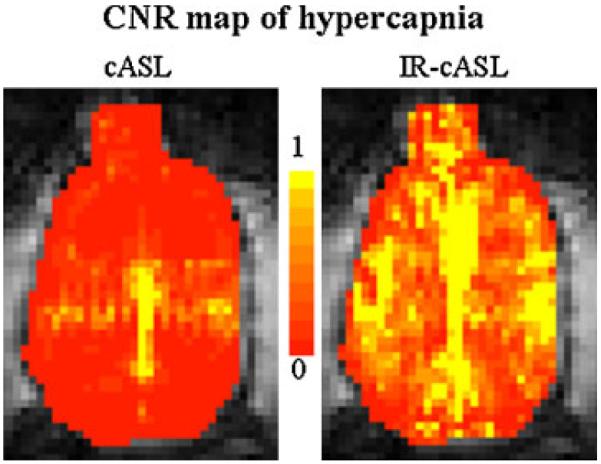
Contrast-to-noise ratio (CNR) maps associated with hypercapnic challenges of the continuous arterial spin labeling (cASL) and inversion recovery (IR)-cASL acquisition (horizontal view).
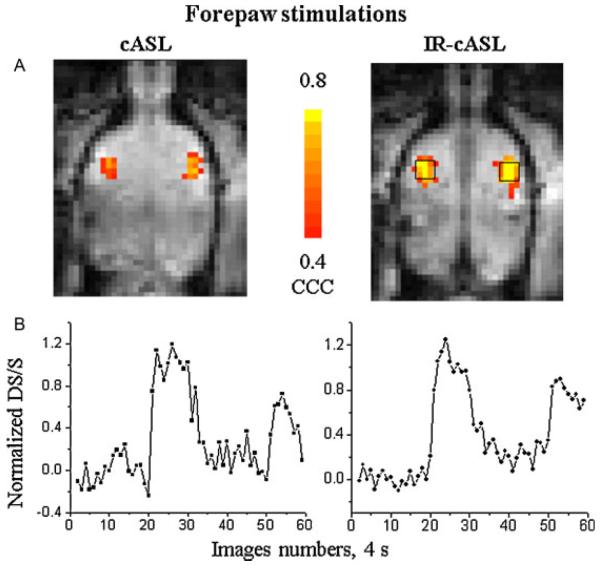
Figure 7 shows representative cross-correlation activation maps and time courses of the forepaw stimulation from the same animal at the same statistical threshold. Both the activation maps and time courses revealed that IR-cASL yielded higher functional contrast than cASL. The group-averaged comparisons of temporal SDs and fMRI CNRs are also summarized in Table 1. For the hypercapnic challenge, CNR was obtained from the whole-brain ROI. For forepaw stimulation, CNR was obtained from the 3×3 pixels ROI of the primary somatosensory cortices. IR-cASL showed overall improved temporal stability and functional CNR compared with cASL.
Figure 7.
(A) Cerebral blood flow (CBF) fMRI activation maps and (B) time courses associated with forepaw stimulations of the continuous arterial spin labeling (cASL) and inversion recovery (IR)-cASL acquisition (horizontal view). These maps were obtained using identical statistical threshold. Time courses were obtained from the same region of interest for both cASL and IR-cASL as shown.
DISCUSION
This study presents a novel approach utilizing a separate labeling coil to achieve background static tissue signal suppression without compromising ASL perfusion contrast caused by imperfect BS inversion pulses. While background suppression strategy has been widely used in humans, such a background suppression approach with a single coil or a separate neck coil for cASL has not been reported in rodent studies to our knowledge. This approach is particularly relevant for CBF studies of rodents and other small animals because of the short arterial transit time in rodent. The major findings were: (i) A simple but practical theoretical framework for the IR-cASL approach was derived by modifying the Bloch equations to account for variable BS and residual degree of labeling. (ii) We experimentally validate the approach and formalism by showing quantitative CBF and CBF-based fMRI were consistent with cASL without background suppression. (iii) Compared with cASL, IR-cASL provides more temporally stable perfusion measurement for basal CBF and a significantly higher perfusion CNR for CBF-based fMRI. (iv) This approach has immediate applications in rodents where the labeling duration of the cASL approximates the inversion delay used for BS. This approach is also expected to be helpful in suppressing the vitreous signal for blood flow MRI of the retina. In summary, while there are some shortcomings and further improvements in modeling and pulse sequence are expected, we believe this simplistic approach has merits and is practical for improving rodent CBF MRI studies.
BS yielded improved temporal ASL signal stability and CBF-based fMRI sensitivity. This finding is in qualitative agreement with previous studies using the single-coil technique (6-9). Our approach differed from previous approaches in that IR-cASL can independently modulate BS and ASL. As such it has the additional advantage that ASL perfusion contrast is not compromised by imperfect inversion pulses because BS is independent of labeling and is applied before ASL. Improvements in BS ASL have also been reported in human studies. For example, Duyn et al. reported that the BS improved SDs of the perfusion signal by 35–40% (8). Ye et al. reported that background suppression reduced temporal SDs by ~50% from whole brain ROI (6). Garcia et al. reported background suppression yielded a gain of 23–110% of the CBF SNR (9). Duyn et al. reported the average gain of 64±33% at 1.5T and 128±29% at 3T in t-scores for fMRI data (8). In the present study, IR-cASL is 2.0 times higher than fMRI CNR for hypercapnic challenge and 2.3 times higher than fMRI CNR for forepaw stimulation compared with cASL without BS in the same subjects. Talagala et al. also reported a background suppression approach in cASL with a separate labeling coil (19), where one inversion pulse was applied between two labeling durations and two inversion pulses were applied after labeling, which are susceptible to loss of CBF contrast as a result of imperfect BS pulses.
A major drawback of IR-cASL is that the labeling duration is constrained by brain T1. Gray matter T1 at 7T is 1.8 s. Thus, the longest nulling point (and thus labeling duration) is 1.24 s for ideal single inversion and infinite TR. In the presence of inverted arterial blood, the inversion null point is when the background and the inverted blood signal in a given voxel cancel each other – not the null point of brain tissue. This experimental inversion null point was ~1.05 s for whole brain for the given parameters. In subsequent experiments to measure CBF, we purposely used an inversion delay that was slightly longer than the tissue null point to stay on the positive side of magnetization recovery. This also allowed a sufficiently long labeling duration to increase perfusion contrast albeit at the expense of imperfect BS. Longer T1 at higher magnetic fields would benefit IR-cASL.
While IR-cASL in principle can also be done using a single volume-coil setup without a separate neck coil for spin labeling, it is expected to yield lower CBF contrast compared with a separate coil approach because of the unwanted magnetization transfer effect present in the single-coil approach. The current IR-cASL scheme is ideal for rodent studies where the arterial transit time is short (~200 ms). In humans, the long arterial transit time (~1 s) necessitates a long post-labeling delay and is incompatible with IR-cASL in its current form. To overcome this limitation, additional inversion pulses can be used and is currently being explored. Similarly, multiple inversion pulses can also be used to null multiple tissue T1 species although complete BS is unnecessary.
IR-cASL CBF values were not statistically different from those of cASL in the same animals, both are consistent with whole-brain CBF values reported previously using cASL in animal models (12,13). The stimulus-induced CBF percent changes over a wide range of inversion delays were not statistically different from each other. These stimulus-induced CBF percent changes are also consistent with those reported previously on animal models (12,13). In multislice acquisition, background suppression and residual degree of labeling will vary for different slices. The use of a three-dimensional acquisition scheme or multiple inversion pulses could circumvent this problem. The IR-cASL CBF values showed no significant variations across multiple (up to 7) image slices or drop offs in CBF contrast sensitivity. Together, these observations support the modified Bloch equations to describe IR-cASL. Future studies could include multiple inversion pulses, account for transit time (20,21) and water exchange (22-24), and could include vessel-selective CBF MRI to target specific perfusion territory (25,26).
IR-cASL could have important applications. Increased sensitivity of IR-cASL would help improve detection and quantification at low flow conditions, such as in white matter and ischemic tissue (28-30). This is important because WM CBF measurement reliability has been a contentious issue (27). van Gelderen argued that ASL MRI does not have enough sensitivity to detect CBF in WM reliably because of partial voluming and transit time issues. A recent study by van Osche et al. (7) using pseudo-continuous ASL with background suppression indicated that WM CBF can be reliably detected. Improved CBF sensitivity would undoubtedly be helpful. Moreover, another application for IR-cASL is that it can be applied to improve blood flow MRI sensitivity of the retina (31-33) by suppressing the overwhelmingly strong vitreous signal.
In conclusion, we demonstrated a novel cASL MRI approach to suppress the background static tissue signal to improve sensitivity, contrast and reproducibility of basal CBF and CBF-based fMRI measurements. The IR-cASL approach could benefit by higher magnetic field scanners. Increased CBF sensitivity of IR-cASL would help improve CBF measurements for a variety of biomedical applications, particularly for imaging low CBF tissue.
Acknowledgements
This work was supported in part by the NIH (R01-NS45879, R01EY014211 and R01EY018855), the American Heart Association (SDG-0430020N and SDG-0830293N) and a VA MERIT award.
Abbreviations used
- ASL
arterial spin labeling
- CBF
cerebral blood flow
- SNR
signal-to-noise ratio
- BS
background suppression
- BOLD
blood oxygenation level dependent
- IR-cASL
inversion recovery continuous arterial spin labeling
- LD
labeling duration
- PLD
post-labeling delay
- TI
inversion recovery delay
- CNR
contrast-to-noise ratio
- WM
white matter
- GM
gray matter
- RF
radiofrequency
REFERENCES
- 1.Roy CS, Sherrington CS. On the regulation of blood supply of the brain. J. Physiol. 1890;1:85–108. doi: 10.1113/jphysiol.1890.sp000321. [DOI] [PMC free article] [PubMed] [Google Scholar]
- 2.Williams DS, Detre JA, Leigh JS, Korestsky AP. Magnetic resonance imaging of perfusion using spin inversion of arterial water. Proc. Natl. Acad. Sci. USA. 1992;89:212–216. doi: 10.1073/pnas.89.1.212. [DOI] [PMC free article] [PubMed] [Google Scholar]
- 3.Barbier EL, Lamalle L, Decorps M. Methodology of brain perfusion imaging. J. Magn. Reson. Imaging. 2001;13:496–520. doi: 10.1002/jmri.1073. [DOI] [PubMed] [Google Scholar]
- 4.Duong TQ, Kim D-S, Ugurbil K, Kim S-G. Localized blood flow response at sub-millimeter columnar resolution. Proc. Natl. Acad. Sci. USA. 2001;98:10904–10909. doi: 10.1073/pnas.191101098. [DOI] [PMC free article] [PubMed] [Google Scholar]
- 5.Dixon WT, Sardashti M, Castillo M, Stomp GP. Multiple inversion recovery reduces static tissue signal in angiograms. Magn. Reson. Med. 1991;18:257–268. doi: 10.1002/mrm.1910180202. [DOI] [PubMed] [Google Scholar]
- 6.Mani S, Pauly J, Conolly S, Meyer C, Nishimura D. Background suppression with multiple inversion recovery nulling: applications to projective angiography. Magn. Reson. Med. 1997;37:898–905. doi: 10.1002/mrm.1910370615. [DOI] [PubMed] [Google Scholar]
- 7.Ye FQ, Frank JA, Weinberger DR, McLaughlin AC. Noise reduction in 3D perfusion imaging by attenuaion and static signal in arterial spin tagging (ASSIST) Magn. Reson. Med. 2000;44:92–100. doi: 10.1002/1522-2594(200007)44:1<92::aid-mrm14>3.0.co;2-m. [DOI] [PubMed] [Google Scholar]
- 8.van Osch MJ, Teeuwisse WM, van Walderveen MA, Hendrikse J, Kies DA, van Buchem MA, Van Laar PJ, Mali WP, Moll FL, van der Worp HB, van der Grond J, Golay X, Bakker CJ, Rutgers DR, Kappelle LJ. Can arterial spin labeling detect white matter perfusion signal? Magn. Reson. Med. 2009;62:165–173. doi: 10.1002/mrm.22002. [DOI] [PubMed] [Google Scholar]
- 9.Duyn JH, Tan CX, van Gelderen P, Yongbi MN. High-sensitivity single-shot perfusion-weighted fMRI. Magn. Reson. Med. 2001;46:88–94. doi: 10.1002/mrm.1163. [DOI] [PubMed] [Google Scholar]
- 10.Garcia DM, Duhamel G, Alsop DC. Efficiency of inversion pulses for background suppressed arterial spin labeling. Magn. Reson. Med. 2005;54:366–372. doi: 10.1002/mrm.20556. [DOI] [PubMed] [Google Scholar]
- 11.Thomas DL, Lythgoe MF, van der Weerd L, Ordidge RJ, Gadian DG. Regional variation of cerebral blood flow and arterial transit time in the normal and hypoperfused rat brain measured using continuous arterial spin labeling MRI. J. Cereb. Blood Flow Metab. 2006;26:274–282. doi: 10.1038/sj.jcbfm.9600185. [DOI] [PMC free article] [PubMed] [Google Scholar]
- 12.Liu ZM, Schmidt KF, Sicard KM, Duong TQ. Imaging oxygen consumption in forepaw somatosensory stimulation in rats under isoflurane anesthesia. Magn. Reson. Med. 2004;52:277–285. doi: 10.1002/mrm.20148. [DOI] [PMC free article] [PubMed] [Google Scholar]
- 13.Shen Q, Ren H, Cheng H, Fisher M, Duong TQ. Functional, perfusion and diffusion MRI of acute focal ischemic brain injury. J. Cereb. Blood Flow Metab. 2005;25:1265–1279. doi: 10.1038/sj.jcbfm.9600132. [DOI] [PMC free article] [PubMed] [Google Scholar]
- 14.Todd MM, Weeks JB, Warner DS. Microwave fixation for the determination of cerebral blood volume in rats. J. Cereb. Blood Flow Metab. 1993;13:328–336. doi: 10.1038/jcbfm.1993.41. [DOI] [PubMed] [Google Scholar]
- 15.Herscovitch P, Raichle ME. What is the correct value for the brain-blood partition coefficient for water? J. Cereb. Blood Flow Metab. 1985;5:65–69. doi: 10.1038/jcbfm.1985.9. [DOI] [PubMed] [Google Scholar]
- 16.Barbier EL, Liu L, Grillon E, Payen JF, Lebas JF, Segebarth C, Rémy C. Focal brain ischemia in rat: acute changes in brain tissue T1 reflect acute increase in brain tissue water content. NMR Biomed. 2005;18:499–506. doi: 10.1002/nbm.979. [DOI] [PubMed] [Google Scholar]
- 17.Silva AC, Zhang W, Williams DS, Koretsky AP. Multi-slice MRI of rat brain perfusion during amphetamine stimulation using arterial spin labeling. Magn. Reson. Med. 1995;33:209–214. doi: 10.1002/mrm.1910330210. [DOI] [PubMed] [Google Scholar]
- 18.Francis ST, Bowtell R, Gowland PA. Modeling and optimization of look-locker spin labeling for measuring perfusion and transit time changes in activation studies taking into account arterial blood volume. Magn. Reson. Med. 2008;59:316–325. doi: 10.1002/mrm.21442. [DOI] [PubMed] [Google Scholar]
- 19.Talagala SL, Ye FQ, Ledden PJ, Chesnick S. Whole-brain 3D perfusion MRI at 3.0 T using CASL with a separate labeling coil. Magn. Reson. Med. 2004;52:131–140. doi: 10.1002/mrm.20124. [DOI] [PubMed] [Google Scholar]
- 20.Zhou J, van Zijl PC. Effect of transit times on quantification of cerebral blood flow by the FAIR T1-difference approach. Magn. Reson. Med. 1999;42:890–894. doi: 10.1002/(sici)1522-2594(199911)42:5<890::aid-mrm8>3.0.co;2-8. [DOI] [PubMed] [Google Scholar]
- 21.Yang Y, Engelien W, Xu S, Gu H, Silbersweig DA, Stern E. Transit time, trailing time, and cerebral blood flow during brain activation: measurement using multislice, pulsed spin-labeling perfusion imaging. Magn. Reson. Med. 2000;44:680–685. doi: 10.1002/1522-2594(200011)44:5<680::aid-mrm4>3.0.co;2-q. [DOI] [PubMed] [Google Scholar]
- 22.St. Lawrence KS, Frank JA, McLaughlin AC. Effect of restricted water exchange on cerebral blood flow values calculated with arterial spin tagging: a theoretical investigation. Magn. Reson. Med. 2000;44:440–449. doi: 10.1002/1522-2594(200009)44:3<440::aid-mrm15>3.0.co;2-6. [DOI] [PubMed] [Google Scholar]
- 23.Zhou J, Wilson DA, Ulatowski JA, Traystman RJ, van Zijl PC. Two-compartment exchange model for perfusion quantification using arterial spin tagging. J. Cereb. Blood Flow Metab. 2001;21:440–455. doi: 10.1097/00004647-200104000-00013. [DOI] [PubMed] [Google Scholar]
- 24.Silva A, Williams D, Koretsky A. Evidence for the exchange of arterial spin-labeled water with tissue water in rat brain from diffusion-sensitized measurements of perfusion. Magn. Reson. Med. 1997;38:232–237. doi: 10.1002/mrm.1910380211. [DOI] [PubMed] [Google Scholar]
- 25.Davies NP, Jezzard P. Selective arterial spin labeling (SASL): perfusion territory mapping of selected feeding arteries tagged using two-dimensional radiofrequency pulses. Magn. Reson. Med. 2003;49:1133–1142. doi: 10.1002/mrm.10475. [DOI] [PubMed] [Google Scholar]
- 26.Werner R, Norris DG, Alfke K, Mehdorn HM, Jansen O. Continuous artery-selective spin labeling (CASSL) Magn. Reson. Med. 2005;53:1006–1012. doi: 10.1002/mrm.20475. [DOI] [PubMed] [Google Scholar]
- 27.van Gelderen P, de Zwart JA, Duyn JH. Pittfalls of MRI measurement of white matter perfusion based on arterial spin labeling. Magn. Reson. Med. 2008;59:788–795. doi: 10.1002/mrm.21515. [DOI] [PubMed] [Google Scholar]
- 28.Shen Q, Meng X, Fisher M, Sotak CH, Duong TQ. Pixel-by-pixel spatiotemporal progression of focal ischemia derived using quantitative perfusion and diffusion imaging. J Cereb. Blood Flow Metab. 2003;23:1479–1488. doi: 10.1097/01.WCB.0000100064.36077.03. [DOI] [PMC free article] [PubMed] [Google Scholar]
- 29.Shen Q, Fisher M, Sotak CH, Duong TQ. Effects of reperfusion on ADC and CBF pixel-by-pixel dynamics in stroke: characterizing tissue fates using quantitative diffusion and perfusion imaging. J Cereb. Blood Flow Metab. 2004;24:280–290. doi: 10.1097/01.WCB.0000110048.43905.E5. [DOI] [PMC free article] [PubMed] [Google Scholar]
- 30.Meng X, Fisher M, Shen Q, Sotak CH, Duong TQ. Characterizing the diffusion/perfusion mismatch in experimental focal cerebral ischemia. Ann. Neurol. 2004;55:207–212. doi: 10.1002/ana.10803. [DOI] [PMC free article] [PubMed] [Google Scholar]
- 31.Li Y, Cheng H, Duong TQ. Blood-flow magnetic resonance imaging of the retina. Neuroimage. 2008;39:1744–1751. doi: 10.1016/j.neuroimage.2007.10.030. [DOI] [PMC free article] [PubMed] [Google Scholar]
- 32.Li Y, Cheng H, Shen Q, Kim M, Thule PM, Olson DE, Pardue MT, Duong TQ. Blood-Flow Magnetic Resonance Imaging of Retinal Degeneration. Invest. Ophthalmol. Vis. Sci. 2009;50:1824–1830. doi: 10.1167/iovs.08-2188. [DOI] [PMC free article] [PubMed] [Google Scholar]
- 33.Muir ER, Duong TQ. MRI of retinal and choroidal blood flow with laminar resolution. NMR Biomed. 2010 doi: 10.1002/nbm.1576. In press. online Sep 6. [DOI] [PMC free article] [PubMed] [Google Scholar]


