

Abstract
Differentiation status in neuroblastoma strongly affects clinical outcomes and inducing differentiation is a treatment strategy in this disease. However, the molecular mechanisms that control neuroblastoma differentiation are not well understood. Here we show that high-level HOXC9 expression is associated with neuroblastoma differentiation and is prognostic for better survival in neuroblastoma patients. HOXC9 induces growth arrest and neuronal differentiation in neuroblastoma cells by directly targeting both cell cycle-promoting and neuronal differentiation genes. HOXC9 expression is upregulated by retinoic acid (RA) and knockdown of HOXC9 expression confers resistance to RA-induced growth arrest and differentiation. Moreover, HOXC9 expression is epigenetically silenced in RA-resistant neuroblastoma cells and forced HOXC9 expression is sufficient to inhibit their proliferation and tumorigenecity. These findings identify HOXC9 as a key regulator of neuroblastoma differentiation and suggest a therapeutic strategy for RA-resistant neuroblastomas through epigenetic activation of HOXC9 expression.
Keywords: Differentiation, HOX, Neuroblastoma, Prognosis, Retinoic Acid
Introduction
Neuroblastoma is a common childhood malignant tumor of the sympathetic nervous system. Histologically, neuroblastoma is a heterogeneous group of tumors, ranging from tumors with predominantly poorly differentiated neuroblasts to those largely consisting of fully differentiated sympathetic neurons (1, 2). It has long been recognized that neuroblastoma differentiation states are of prognostic significance: patients with neuroblastomas of differentiating histology have significantly better survival than those with poorly differentiated neuroblastomas (3–6). This positive correlation between neuroblastoma differentiation and favorable outcome has also been confirmed at the molecular level by microarray studies (7, 8).
Retinoic acid (RA) is an effective inducer of neuroblastoma cell differentiation (9, 10). As a result, RA has been used in clinic as a differentiation agent for treatment of high-risk neuroblastomas (11, 12). Importantly, high-risk neuroblastoma patients treated with 13-cis-RA after bone-marrow transplant showed a significant improvement in event-free survival (13, 14). However, resistance to RA has been observed in both neuroblastoma cell lines and patients, which presents a major barrier to successful RA-based therapy (11, 12). Identification of downstream mediators of the RA-induced differentiation program may offer opportunities to bypass resistance to RA.
Homeobox (HOX) proteins are key mediators of RA action in the development of nervous systems (15, 16). The HOX family of transcription factors function as master regulators of morphogenesis and cell fate specification (17–19). RA-induced differentiation of neuroblastoma cells is associated with increased HOX expression (20–22). However, the roles of HOX genes in RA-induced differentiation and the underlying molecular mechanisms are not well understood. In the present study, we identify HOXC9 as a regulator of neuroblastoma cell proliferation and differentiation, a mediator of RA action in neuroblastoma cells, and a prognostic marker for survival in neuroblastoma patients.
Materials and Methods
Cell Lines and Culture
The human neuroblastoma cell lines BE(2)-C (CRL-2268, ATCC, Manassas, VA), IMR32 (CCL-127, ATCC) and SK-N-SH (HTB-11, ATCC) were cultured in a 1:1 mixture of DMEM and Ham’s nutrient mixture F12, SK-N-AS (CRL-2137, ATCC), SK-N-DZ (CRL-2149, ATCC) and SK-N-F1 (CRL-2141, ATCC) cells in DMEM, and SMS-KCNR cells (gift from C. Patrick Reynolds at the Children’s Hospital of Los Angeles) in RPMI 1640. All culture media were supplemented with 10% fetal bovine serum (Invitrogen, Carlsbad, CA). All the cell lines had been tested within 3 months before and during the conduction of this study for morphologic features of neuroblastoma cells by light microscopy, for expression of neuroblastoma-associated genes (e.g. MYCN, PHOX2B, RET, and tyrosine hydroxylase) by quantitative reverse-transcription PCR (qRT-PCR) and immunoblotting, and for the ability to undergo RA-induced neuronal differentiation and to generate tumors in immunodeficient mice with histological features of neuroblastoma by H&E staining of tumor sections. For differentiation assay, all trans-RA (Sigma-Aldrich, St Louis, MO) was dissolved in DMSO and 10 mM stock solutions were prepared. BE(2)-C, IMR32, SK-N-AS, SK-N-DZ and SK-N-F1 cells were treated with 10 μM RA, SMS-KCNR cells with 5 μM RA, and SK-N-SH cells with 1 μM RA. DMSO (0.01–0.1%) was used as negative control (untreated). Cells were examined and phase contrast images captured using an Axio Observer microscope and the software AxioVision (Carl Zeiss MicroImaging, Thornwood, NY).
Quantitative RT-PCR
Cells were lysed with Trizol (Invitrogen) for total RNA purification. Reverse transcription was performed using SuperScript II Reverse Transcriptase (Invitrogen). qRT-PCR was performed using either a TaqMan gene expression assay kit (Applied Biosystems, Foster City, CA) or a RT2 SYBR green/Fluorescein PCR master mix (SABiosciences, Frederick, MD). Primer sequences are described in Supplementary Materials and Methods. PCR reactions in triplicate were performed using an iQ5 real-time PCR system (Bio-Rad, Hercules, CA).
Analyses of Patient Data
Patient data used in this study were described previously (23, 24). Gene expression datasets were obtained from the Oncogenomics Database (http://pob.abcc.ncifcrf.gov/cgi-bin/JK) (25). Cluster analysis was performed using geWorkbench (version 2.0.0) and total linkage with Spearman’s rank correlation. Kaplan-Meier analysis was conducted online, and the resulting survival curves and p values (log-rank test) were downloaded. All cutoff values for separating high and low expression groups were determined by the online Oncogenomics algorithm (25).
Immunoblotting and Immunofluorescence
Immunoblotting was conducted according to standard procedures using primary antibodies detailed in Supplementary Materials and Methods. Horseradish peroxidase-conjugated goat anti-mouse and goat anti-rabbit IgG (Santa Cruz Biotechnology) were used as secondary antibodies. Proteins were visualized using a SuperSignal West Pico chemiluminescence kit (Pierce, Rockford, IL) and quantified using ImageJ (version 1.42q). Films were exposed for various times for quantification of target proteins within their linear range of detection. Alternatively, proteins levels were quantified using the Odyssey system and software (LI-COR Biosciences, Lincoln, NE). For immunofluorescence, cells were fixed either with 4% paraformaldehyde or with 5% acetic acid and 95% ethanol, and stained with primary antibodies (Supplementary Materials and Methods). All secondary fluorescence antibodies were from Molecular Probes and used at 1:800 dilutions for goat anti-mouse (Alexa Fluor 488) and goat anti-rabbit (Alexa Fluor 594). Nuclei were stained with DAPI. Fluorescent images were captured with a fluorescence microscope (Carl Zeiss Axio Observer).
Chromatin Immunoprecipitation (ChIP)
ChIP assays were performed using a ChIP assay kit (Millipore, Billerica, MA) and primary antibodies detailed in Supplementary Materials and Methods. Quantitative real-time PCR (qPCR) was used to analyze precipitated genomic DNA in triplicate. Primer sequences for CCNB1, NEFM, and HOXC9 5′ and 3′ flanking regions are listed in Supplementary Table S4.
Statistical Analysis
For luciferase reporter, soft agar colony formation and xenograft assays, values were obtained from at least three independent experiments or 4 to 10 tumor samples for each cell line. For KI67 immunofluorescence staining, approximately 400 cells (DAPI-positive) were counted from at least 5 randomly selected 400× fields, and the percentage of KI67+ cells was determined. Data were analyzed using two-tailed Student’s t-test, and a p value < 0.05 was considered to be statistically significant.
Additional methods for inducible HOXC9 expression, cell cycle analysis, RNA interference, proliferation, soft agar colony formation and xenograft assays, luciferase reporter assay, and microarray analysis are listed in Supplementary Materials and Methods.
Results
High HOXC9 expression is associated with neuroblastoma differentiation
To gain insight into the molecular mechanisms that control the differentiation of neuroblastoma cells, we have undertaken a microarray-based search for RA-induced genes encoding transcription factors, particularly members of the HOX gene family, based on the assumption that these genes might have a role in driving neuroblastoma differentiation. Microarray analysis with BE(2)-C cells, a RA-sensitive neuroblastoma cell line (26, 27) (see also Supplementary Fig. S1A and B), revealed a significant upregulation of HOXC9, HOXD1, D8 and D9 following RA treatment (≥1.5 fold, p < 0.05). The investigation of HOXD1, D8 and D9 is currently underway. Here we present our findings on HOXC9. Quantitative RT-PCR confirmed HOXC9 induction by RA in BE(2)-C and other RA-sensitive neuroblastoma cell lines including IMR32, SK-N-DZ, SK-N-F1, SK-N-SH, and SMS-KCNR (Fig. 1A). These cell lines displayed morphologic changes characteristics of neuronal differentiation and/or apoptosis in response to RA (Supplementary Fig. S1C). By contrast, RA failed to induce HOXC9 in SK-N-AS cells (Fig. 1A), a RA-resistant neuroblastoma cell line (28, 29) (Supplementary Fig. S1C). These findings suggest a correlation between RA responsiveness and HOXC9 induction in human neuroblastoma cells.
Figure 1.

High HOXC9 expression is associated with neuroblastoma differentiation. A, qRT-PCR analysis of HOXC9 mRNA levels in neuroblastoma cell lines following RA treatment (error bars, s.d., n=3). B, A hierarchical cluster analysis of Oberthuer dataset with a select set of differentiation and proliferation markers. The genes are shown in columns and individual tumors in rows. Differentiation markers: GAP43 (axonal growth-associated protein 43), ENO2 (neuronal enolase 2), TH (tyrosine hydroxylase) and DBH (dopamine-β hydroxylase); proliferation markers: CCNA2 (cyclin A2), CCNB1, CCNE1, CDK1, CDC25C, E2F1 and KI67. C, Box plots of individual gene expression levels in tumors of HOXC9 high and low groups (Oberthuer dataset) using the HOXC9 expression cutoff value 0. Data were analyzed using two-tailed Student’s t-test with p values indicated.
We then investigated the correlation of HOXC9 expression levels with differentiation states in primary neuroblastomas, using the Oberthuer microarray dataset available from the online Oncogenomics Database (25). The dataset includes a cohort of 251 patients with neuroblastomas representative of various tumor stages and genetic alterations (24). A hierarchical cluster analysis revealed an association of HOXC9 with differentiation markers (Fig. 1B). When the tumors were separated into HOXC9 high and low expression groups, tumors of the high HOXC9 group expressed significantly higher levels of differentiation markers and lower levels of proliferation markers (Fig. 1C). Together, these results indicate an association of high HOXC9 expression with neuroblastoma differentiation characterized by high expression of differentiation markers and low expression of proliferation markers.
High HOXC9 expression is prognostic for better survival in neuroblastoma patients
As high HOXC9 expression is associated with neuroblastoma differentiation, we investigated the possibility of HOXC9 as a prognostic marker in neuroblastoma. Kaplan-Meier analysis of progression-free survival for the Oberthuer dataset showed that high HOXC9 expression was associated with good prognosis, whereas low HOXC9 expression was associated with poor outcome (Fig. 2A). Moreover, decreased HOXC9 expression correlated significantly with advanced tumor stages (Fig. 2B). Interestingly, Stage 4S tumors expressed HOXC9 at levels similar to those of Stage 1 tumors (Fig. 2B). It is known that Stage 4S patients have a high degree of spontaneous regression and favorable prognosis (30, 31). We confirmed that high HOXC9 expression is prognostic for favorable outcome with the Seeger dataset (Fig. 2C and D), which includes a cohort of 102 neuroblastoma patients with metastatic tumors lacking MYCN amplification (23). Together, our analyses of two independent microarray datasets indicate that HOXC9 is a prognostic marker in neuroblastoma, independent of the status of MYCN amplification.
Figure 2.

High HOXC9 expression is prognostic for better survival in neuroblastoma patients. A, Kaplan-Meier analysis of progression-free survival for the Oberthuer dataset with the log-rank test p value indicated. B, Box plot of HOXC9 expression levels in Stage (ST) 1-4S tumors. C, Kaplan-Meier analysis of the Seeger dataset with the log-rank test p value indicated. D, Box plot of HOXC9 expression levels in tumors of good and poor prognosis groups. E, Kaplan-Meier analysis of the Oberthuer dataset according to the age at diagnosis (<18 months vs >18 months) with the log-rank test p value indicated. F, Box plot of HOXC9 expression levels in tumors of <18-month and >18-month groups. For data in A and C, the HOXC9 cutoff value 0 was used to separate the patients into high and low HOXC9 expression groups. Data in B (ST1 vs ST2, 3, 4 or 4S), D, and F were analyzed using two-tailed Student‘s t-test with p values indicated.
We also examined the prognostic values of HOXD1, HOXD8, and other member of the HOX-9 paralog group, HOXA9, HOXB9 and HOXD9, using data available from the Seeger dataset. Kaplan-Meier analysis revealed no significant correlation between their expression levels and disease outcome (Supplementary Fig. S2). These results indicate the specificity of HOXC9 as a prognostic marker for neuroblastoma.
As HOX genes are expressed during embryonic development in a time sequence from 3′ to 5′ according to their physical positions along the chromosomes, known as temporal colinearity (32), and younger patient age at diagnosis is associated with good prognosis (5), we examined the correlation of HOXC9 expression levels with patient age at diagnosis using information available from the Oberthuer dataset (24). We chose the cutoff at 18 months of age as it gave the most significant p value for prognostic evaluation (1) (Fig. 2E). The younger age group expressed significantly higher levels of HOXC9 than the older age group (Fig. 2F), demonstrating a correlation of high HOXC9 expression with younger age at diagnosis.
HOXC9 induces G1 arrest
We next examined the functional consequence of high HOXC9 expression in neuroblastoma cells using a “Tet-Off” inducible system (Supplementary Fig. S3A). The level of HOXC9 expression in BE(2)-C/Tet-Off/HOXC9 cells cultured in the absence of doxycycline was comparable to those induced by RA in BE(2)-C, IMR32 and SK-N-SH cells, as determined by qRT-PCR (data not shown, see also Fig. 1A and Fig. 4A).
Figure 4.

HOXC9 represses the expression of cell cycle genes. A, qRT-PCR analysis of mRNA levels of cyclins, CDK1 and HOXC9 in BE(2)-C cells with or without HOXC9 induction for 5 days (error bars, s.d., n=3). B, Time-course immunoblot analysis of cyclins and CDKs in BE(2)-C cells following HOXC9 induction. α-tubulin levels are shown as loading control. C, ChIP-qPCR analysis showing HOXC9 interaction with the CCNB1 promoter region (−430 to −178) following HOXC9 induction (error bars, s.d., n=3). Percentage of input indicates bound/input × 100. D, Top: schematic representation of the CCNB1 promoter luciferase reporter construct and its mutated version. Bottom: luciferase reporter assays in the absence or presence of a HOXC9-expressing plasmid (error bars, s.d., n=3). Data were analyzed using two-tailed Student’s t-test with p values indicated. E, ChIP-qPCR analysis of H3K4me3 and H3K27me3 levels at the CCNB1 promoter (−231 to +6) in BE(2)-C cells following HOXC9 induction (error bars, s.d., n=3). Percentage of input indicates bound/input × 100.
HOXC9 induction in BE(2)-C cells completely blocked cell proliferation, with 90% of cells arrested in the G1 phase (Fig. 3A and B). This growth arrest phenotype could be reversed and re-induced by adding and removing doxycycline, respectively (Supplementary Fig. S3B), indicating that the phenotype is dependent on continuous HOXC9 expression. In addition, HOXC9 induction markedly inhibited the growth of BE(2)-C cells in soft agar and in immunodeficient mice (Fig. 3C and D). We obtained similar results with SK-N-DZ and SK-N-F1 cells (Supplementary Fig. S4). By contrast, overexpression of HOXB4, B5 or B6 either enhanced (HOXB4 and B5) or had no apparent effect (HOXB6) on the growth of BE(2)-C cells in culture (data not shown) and in soft agar (Supplementary Fig. S5). Together, these findings indicate a specific anti-growth activity for HOXC9 in neuroblastoma cells.
Figure 3.
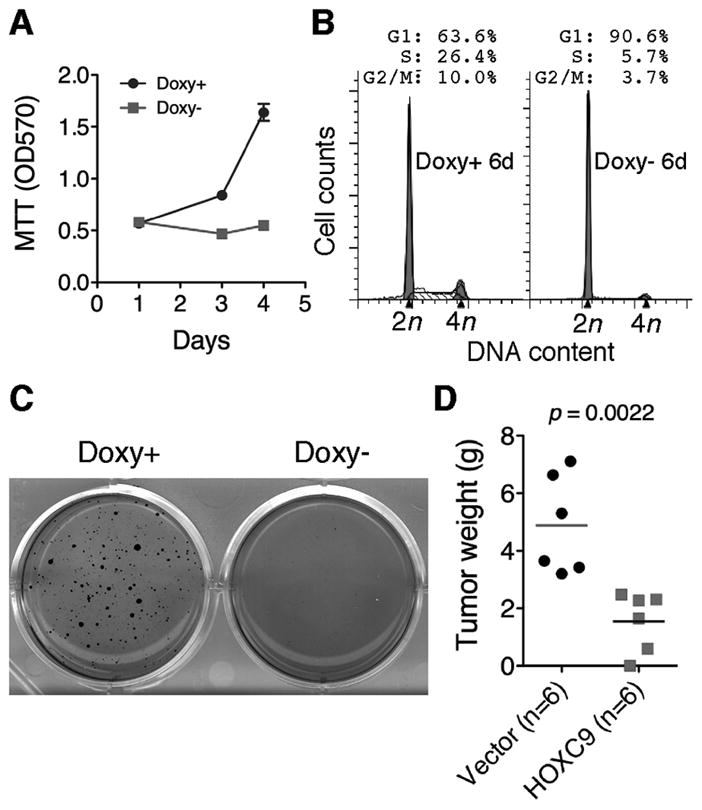
HOXC9 induces G1 arrest. A, Proliferation assays of BE(2)-C cells with or without HOXC9 induction (error bars, s.d., n=6). B–C, Cell cycle analysis (B) and soft agar clonogenic assays (C) of BE(2)-C cells with or without HOXC9 induction. D, Scatter plot of xenograft tumor weight with horizontal lines indicating the mean per group. Data were analyzed with two-tailed Student’s t-test with the p value indicated.
HOXC9 represses cell cycle-promoting genes
HOX proteins can act as both transcriptional activators and repressors (17, 33). To gain insight into the molecular mechanism underlying HOXC9-induced G1 arrest, we analyzed the gene expression profiles of BE(2)-C cells with or without HOXC9 induction. Ectopic HOXC9 expression either decreased or had no significant effect on the transcription of genes encoding CDK inhibitors (CDKNs) (Supplementary Table S1). In addition, overexpression of CDKN1A/p21 or CDKN1B/p27 had little impact on the proliferation of BE(2)-C cells (Supplementary Fig. S6). Thus, regulation of CDKN expression is unlikely a major mechanism for HOXC9-induced G1 arrest. By contrast, HOXC9 induction led to a marked downregulation of cyclin A2, B1, E2, CDK1 and CDK2, which, collectively, are required for the cell cycle progression through S to M phases, as determined by microarray (Supplementary Table S2), qRT-PCR (Fig. 4A), and immunoblotting (Fig. 4B). We obtained similar results with SK-N-DZ and SK-N-F1 cells (Supplementary Fig. S7). Protein stability assays showed that HOXC9 induction had no significant effects on the half-life of cyclin A2, B1 and E2 (Supplementary Fig. S8). Together, these results demonstrate that HOXC9-induced downregulation of cyclins and CDKs occurred primarily at the transcription level.
The transcription of cyclin genes is regulated in a cell cycle-dependent manner (34). Thus, the observed downregulation of cyclins could be a consequence of cell cycle arrest in G1. Alternatively, HOXC9 may directly repress the transcription of cyclin genes, given the well-documented transcriptional repressor activity of HOX proteins (17). Since we failed to identify any CDKNs that may function downstream of HOXC9 to induce G1 arrest, we investigated the possibility of cyclin genes as direct targets of HOXC9, using cyclin B1 as an example. HOX proteins bind DNA sequences with a conserved TAATT/AA-motif (17, 33). Sequence examination revealed multiple potential HOX-binding sites within the human CCNB1 promoter. ChIP-qPCR analysis revealed specific interaction of HOXC9 with the promoter region spanning from -430 to -178 (7.7 fold enrichment relative to IgG control) (Fig. 4C), demonstrating that HOXC9 directly interacts with the CCNB1 promoter in the context of chromatin.
We next performed luciferase reporter assays. The parental promoter-less firefly luciferase construct (pLuc2P) showed minimal activity in BE(2)-C cells. Placing the CCNB1 promoter sequence (-820 to +175) upstream of the luciferase gene (CCNB1-pLuc2P) led to a more than 20-fold increase in the luciferase activity. Co-transfection of CCNB1-pLuc2P with a HOXC9-expressing construct strongly repressed the luciferase expression (Fig. 4D, CCNB1-pLuc2P). Importantly, a 3-base mutation of the putative HOX-binding site (-382 to -377) from TATTAA to GCTGAA largely abrogated the repressive activity of HOXC9 (Fig. 4D, CCNB1mut3-pLuc2P). Taken together, these data demonstrate that HOXC9 directly targets CCNB1 for repression.
We further examined the chromatin state of the CCNB1 promoter by ChIP-qPCR assays using antibodies against trimethylated histone H3 at lysine 4 (H3K4me3) or H3K27me3, which marks a transcriptionally active or silenced state, respectively (35). Consistent with the observed transcriptional repression of CCNB1, ChIP-qPCR assays revealed a marked increase (47-fold) in the level of H3K27me3 associated with the transcriptional start site of CCNB1 following HOXC9 induction (Fig. 4E). We observed no significant levels of H3K4me3 at the CCNB1 promoter before and after HOXC9 induction (Fig. 4E). These findings indicate that ectopic expression of HOXC9 confers a transcriptionally silenced state on the CCNB1 promoter.
HOXC9 induces neuronal differentiation
BE(2)-C cells cultured under the condition of HOXC9 induction for an extended period of time displayed morphologic features of neuronal differentiation, such as small and rounded cell bodies, and extensive neurite outgrowth (Fig. 5A). The differentiation was confirmed at the molecular level. HOXC9 induction in BE(2)-C (Fig. 5B) and other neuroblastoma cell lines (Supplementary Fig. S7B and C) resulted in marked downregulation of paired-like homeobox 2B (PHOX2B), a sympathetic neuronal progenitor marker that is downregulated during sympathetic neuron differentiation (36) and RA-induced differentiation (Supplementary Fig. S9A and B). HOXC9 induction also led to significant upregulation of neuronal differentiation markers including neurofilament medium (NEFM) and RET, the receptor for glial cell-derived neurotrophic factor (Fig. 5B and C). Both NEFM and RET are target genes of RA in neuroblastoma cells (37, 38) (Supplementary Fig. S9A-C). Additional neuronal genes that were upregulated by HOXC9 include those encoding neurofilament light (NEFL), neural cell adhesion molecule 2 (NCAM2) and neurexin 1 (NRXN1) and proteins functioning in the induction of neurite outgrowth, such as neurofascin (NFASC) and neurensin (NRSN1) (39, 40) (Supplementary Table S3). Together, these findings suggest that HOXC9 induces neuronal differentiation by transcriptional activation of neuronal genes.
Figure 5.

HOXC9 induces neuronal differentiation. A, Morphologic examination of BE(2)-C cells with or without HOXC9 induction for 12 days. Scale bars, 50 μm. B, Immunoblot analysis of PHOX2B and NEFM in BE(2)-C cells following HOXC9 induction. α-tubulin levels are shown as loading control. C, qRT-PCR analysis of RET mRNA levels in BE(2)-C cells with or without HOXC9 induction for 3 days (error bars, s.d., n=3). D, Top: schematic representation of the NEFM locus. Locations of putative HOX-binding sites (5P1, 5P2 and 3P1) are indicated. Bottom: ChIP-qPCR analysis of HOXC9 interaction with NEFM following HOXC9 induction (error bars, s.d., n=3). Percentage of input indicates bound/input × 100.
We next investigated whether HOXC9 can directly target neuronal genes, using NEFM as a model. Examination of NEFM 5′ and 3′ flanking sequences revealed three potential HOX-binding sites with a perfect match to the consensus TAATT/AA-motif (Fig. 5D). ChIP-qPCR analysis demonstrated specific interaction of HOXC9 with the 5P2 and 3P1 sites (40- and 16-fold enrichment, respectively, relative to IgG control) (Fig. 5D). These results suggest that NEFM is a direct target gene of HOXC9.
HOXC9 is a mediator of RA action
Since RA induced HOXC9 and ectopic HOXC9 expression largely recapitulated the phenotype of growth arrest and neuronal differentiation induced by RA at both the cellular and molecular levels (Supplementary Fig. S1 and S9), we investigated the possibility of HOXC9 as a mediator of RA action. We tested three lentiviral constructs expressing short hairpin RNA (shRNA) sequences against human HOXC9 (HOXC9sh) and they all significantly reduced HOXC9 expression in BE(2)-C cells (Supplementary Fig. S10A). The functional specificity of these HOXC9sh constructs was demonstrated by their rescue of the G1-arrest phenotype induced by HOXC9 (Supplementary Fig. S10B and data not shown). Since we failed to obtain a significant number of viable BE(2)-C cells expressing HOXC9sh-10, we performed the following experiments with BE(2)-C cells expressing either HOXC9sh-9 or −12, with essentially the same results. BE(2)-C cells with HOXC9 knockdown were highly resistant to RA-induced neuronal differentiation and growth arrest, as determined by morphology, cell cycle analysis, proliferation and soft agar clonogenic assays (Fig. 6A-C). In addition, knockdown of HOXC9 expression markedly inhibited the ability of RA to downregulate cyclins (Fig. 6D). We obtained similar results with the neuroblastoma cell line SK-N-SH. HOXC9 knockdown largely abrogated the ability of RA to induce morphologic differentiation and to upregulate RET expression (Supplementary Fig. S11). Collectively, these results demonstrate that HOXC9 is a key mediator of RA action in neuroblastoma cells.
Figure 6.

HOXC9 is a mediator of RA action. A, Morphologic examination and cell cycle analysis of BE(2)-C cells expressing GFPsh, HOXC9sh-9 or HOXC9sh-12 that were treated with RA for 24 and 14 days, respectively. Scale bar, 100 μm. B, Proliferation assays of BE(2)-C cells expressing GFPsh, HOXC9sh-9 or HOXC9sh-12 in the presence of RA (error bars, s.d., n=3). C, Soft agar clonogenic assays of BE(2)-C cells expressing either GFPsh or HOXC9sh-9. Cells were treated with RA for 7 days before soft agar assays. D, Immunoblot analysis of cyclins in BE(2)-C cells expressing either GFPsh or HOXC9sh-9 that were treated with RA for various times. α-tubulin levels are shown as loading control.
HOXC9 inhibits the proliferation and tumorigenicity of RA-resistant neuroblastoma cells
The neuroblastoma cell line SK-N-AS is highly resistant to RA (28, 29) (Supplementary Fig. S12A). Interestingly, although BE(2)-C and SK-N-AS cells expressed similar levels of RA receptors (Supplementary Fig. S12B), RA failed to induce HOXC9 and RET in SK-N-AS cells (Fig. 1A and Supplementary Fig. S12C). This observation prompted us to examine the epigenetic state of the HOXC9 promoter in SK-N-AS cells in comparison with BE(2)-C cells. ChIP-qPCR analysis revealed an exclusive association of the HOXC9 promoter with H3K4me3 in BE(2)-C cells and with H3K27me3 in SK-N-AS cells in the absence or presence of RA (Fig. 7A). These findings suggest that the HOXC9 promoter is epigenetically primed into an active state in RA-sensitive neuroblastoma cells and a silenced state in RA-resistant neuroblastoma cells, providing an explanation for the inability of RA to induce HOXC9 in SK-N-AS cells. Consistent with these findings, SK-N-AS cells expressed significantly lower basal levels of HOXC9 mRNA than RA-sensitive neuroblastoma cell lines (Supplementary Fig. S12D).
Figure 7.

HOXC9 inhibits the proliferation and tumorigenicity of SK-N-AS cells. A, ChIP-qPCR analysis of H3K4me3 and H3K27me3 levels at the HOXC9 promoter in BE(2)-C and SK-N-AS cells either untreated or treated with RA for 24 hours (error bars, s.d., n=3). Percentage of input indicates bound/input × 100. B, Proliferation assays of SK-N- AS cells with or without HOXC9 induction (error bars, s.d., n=4). C, qRT-PCR analysis of RET mRNA levels in SK-N-AS cells with or without HOXC9 induction for 3 days (error bars, s.d., n=3). D, Scatter plot of xenograft tumor weight with horizontal lines indicating the mean per group. Data were analyzed with two-tailed Student’s t-test with the p value indicated.
Using SK-N-AS cells with inducible expression of HOXC9 in the absence of doxycycline (Supplementary Fig. S13A), we found that HOXC9 induction completely inhibited the growth of SK-N-AS cells (Fig. 7B), with a marked reduction in the number of KI67+ cells (Supplementary Fig. S13B). HOXC9 also significantly upregulated RET expression (Fig. 7C) and exhibited a marked anti-tumorigenic activity in SK-N-AS cells (Fig. 7D). Together, these data indicate that the resistance of SK-N-AS cells to RA is associated with epigenetic silencing of the HOXC9 promoter and forced HOXC9 induction is sufficient to inhibit the proliferation of RA-resistant cells.
Discussion
The present study provides several lines of evidence for HOXC9 as a key regulator of neuroblastoma differentiation. First, HOXC9 is expressed at significantly higher levels in differentiated neuroblastomas and in neuroblastoma cells undergoing RA-induced differentiation. Second, HOXC9 induction is required for RA-induced growth arrest and differentiation. Third, ectopic HOXC9 expression is sufficient to induce growth arrest and neuronal differentiation in neuroblastoma cells. Finally, HOXC9 can both repress growth-promoting genes and activate neuronal differentiation genes, providing a molecular mechanism for linking cell cycle exit and neuronal differentiation. These findings suggest that HOXC9 may have a tumor suppression function in neuroblastoma pathogenesis. In support of this model, in two independent gene expression datasets of 353 neuroblastoma tumors, we found that high HOXC9 expression is prognostic for favorable outcome. Particularly interesting is the observation that Stage 4S neuroblastoma tumors displayed relatively high levels of HOXC9 expression. As Stage 4S patients have a high degree of spontaneous regression (30, 31), our findings suggest that HOXC9 may play a role in spontaneous differentiation and regression of neuroblastomas.
Our findings also provide new insight into the molecular mechanisms by which HOX proteins mold morphology. It has long been proposed that HOX proteins control morphogenesis by regulating expression of “realizator” genes that affect cell division, death, adhesion and migration (41). Our identification of CCNB1 as a direct target gene of HOXC9 provides evidence for cyclins as potential morphological effectors of HOX proteins.
It is well established that during embryonic development, the expression of HOX genes is spatially and temporally regulated, showing a direct correlation between their linear arrangement along the chromosomes and the timing and anterior-posterior boundaries of their expression (42). This colinearity is essential for the developmental function of HOX genes in specifying positional identities of tissues along the anterior-posterior axis. We speculate that HOXC9 expression might also be spatially and temporally regulated in neuroblastomas. We found that tumors from younger patients (<18 months) expressed HOXC9 mRNA at significantly higher levels than tumors from older patients (>18 months), suggesting that neuroblastomas initiated during early embryonic development are more likely to express higher levels of HOXC9. It has also been noted that the site of the primary tumor is of prognostic value: tumors developed in the neck and thorax are associated with better outcome, whereas those of adrenal or abdominal origin are associated with worse outcome (4, 5). In addition, it has been reported that higher proportions of neuroblastomas in the neck and thorax are of differentiating histology as compared with other sites (43). Although no information is currently available regarding the correlation of HOXC9 expression levels and the primary sites of neuroblastomas, based on the strong association of HOXC9 expression with neuroblastoma differentiation states and outcome, we suspect that tumors developed in the neck and thorax might express higher levels of HOXC9 compared with tumors developed at other sites.
In this study, we found that the HOXC9 promoter was exclusively associated with the chromatin silencing marker H3K27me3 in the RA-resistant SK-N-AS cells and with the transcriptionally active marker H3K4me3 in the RA-sensitive BE(2)-C cells. Thus, it appears that the HOXC9 promoter is epigenetically primed into a RA-responsive and RA-unresponsive state in RA-sensitive and RA-resistant neuroblastoma cells, respectively. Further studies are needed to determine whether this represents a common mechanism underlying RA responsiveness or resistance in neuroblastoma cells. Epigenetic therapy using drugs that target specific enzymes involved in the epigenetic regulation of gene expression is emerging as an effective treatment strategy for cancer (44, 45). As the HOXC9 promoter is in an epigenetically silenced state in RA-resistant neuroblastoma cells, epigenetic activation of HOXC9 may offer an opportunity to bypass RA resistance for neuroblastoma treatment. We also suggest that HOXC9 epigenetic states and expression levels might be useful as a marker in the prediction of patient responses to RA- or other differentiation-based therapies.
Supplementary Material
Acknowledgments
Grant Support: NIH grant CA124982 and Georgia Cancer Coalition Distinguished Scholar Award (H.-F.D.).
We thank R. Mulligan for providing pHDM-G and pMD.MLVogp and J. Khan for gene expression datasets from the Oncogenomics Database.
References
- 1.Shimada H, Ambros IM, Dehner LP, Hata J, Joshi VV, Roald B, et al. The International Neuroblastoma Pathology Classification (the Shimada system) Cancer. 1999;86:364–72. [PubMed] [Google Scholar]
- 2.Brodeur GM. Neuroblastoma: biological insights into a clinical enigma. Nat Rev Cancer. 2003;3:203–16. doi: 10.1038/nrc1014. [DOI] [PubMed] [Google Scholar]
- 3.Beckwith JB, Martin RF. Observations on the histopathology of neuroblastomas. J Pediatr Surg. 1968;3:106–10. doi: 10.1016/0022-3468(68)90989-5. [DOI] [PubMed] [Google Scholar]
- 4.Hughes M, Marsden HB, Palmer MK. Histologic patterns of neuroblastoma related to prognosis and clinical staging. Cancer. 1974;34:1706–11. doi: 10.1002/1097-0142(197411)34:5<1706::aid-cncr2820340519>3.0.co;2-j. [DOI] [PubMed] [Google Scholar]
- 5.Shimada H, Chatten J, Newton WA, Jr, Sachs N, Hamoudi AB, Chiba T, et al. Histopathologic prognostic factors in neuroblastic tumors: definition of subtypes of ganglioneuroblastoma and an age-linked classification of neuroblastomas. J Natl Cancer Inst. 1984;73:405–16. doi: 10.1093/jnci/73.2.405. [DOI] [PubMed] [Google Scholar]
- 6.Ambros IM, Hata J, Joshi VV, Roald B, Dehner LP, Tuchler H, et al. Morphologic features of neuroblastoma (Schwannian stroma-poor tumors) in clinically favorable and unfavorable groups. Cancer. 2002;94:1574–83. doi: 10.1002/cncr.10359. [DOI] [PubMed] [Google Scholar]
- 7.Ohira M, Oba S, Nakamura Y, Isogai E, Kaneko S, Nakagawa A, et al. Expression profiling using a tumor-specific cDNA microarray predicts the prognosis of intermediate risk neuroblastomas. Cancer Cell. 2005;7:337–50. doi: 10.1016/j.ccr.2005.03.019. [DOI] [PubMed] [Google Scholar]
- 8.Fredlund E, Ringner M, Maris JM, Pahlman S. High Myc pathway activity and low stage of neuronal differentiation associate with poor outcome in neuroblastoma. Proc Natl Acad Sci U S A. 2008;105:14094–9. doi: 10.1073/pnas.0804455105. [DOI] [PMC free article] [PubMed] [Google Scholar]
- 9.Sidell N. Retinoic acid-induced growth inhibition and morphologic differentiation of human neuroblastoma cells in vitro. J Natl Cancer Inst. 1982;68:589–96. [PubMed] [Google Scholar]
- 10.Sidell N, Altman A, Haussler MR, Seeger RC. Effects of retinoic acid (RA) on the growth and phenotypic expression of several human neuroblastoma cell lines. Exp Cell Res. 1983;148:21–30. doi: 10.1016/0014-4827(83)90184-2. [DOI] [PubMed] [Google Scholar]
- 11.Reynolds CP, Matthay KK, Villablanca JG, Maurer BJ. Retinoid therapy of high-risk neuroblastoma. Cancer Lett. 2003;197:185–92. doi: 10.1016/s0304-3835(03)00108-3. [DOI] [PubMed] [Google Scholar]
- 12.Volchenboum SL, Cohn SL. Progress in defining and treating high-risk neuroblastoma: lessons from the bench and bedside. J Clin Oncol. 2009;27:1003–4. doi: 10.1200/JCO.2008.20.2739. [DOI] [PubMed] [Google Scholar]
- 13.Matthay KK, Villablanca JG, Seeger RC, Stram DO, Harris RE, Ramsay NK, et al. Treatment of high-risk neuroblastoma with intensive chemotherapy, radiotherapy, autologous bone marrow transplantation, and 13-cis-retinoic acid. Children’s Cancer Group. N Engl J Med. 1999;341:1165–73. doi: 10.1056/NEJM199910143411601. [DOI] [PubMed] [Google Scholar]
- 14.Matthay KK, Reynolds CP, Seeger RC, Shimada H, Adkins ES, Haas-Kogan D, et al. Long-term results for children with high-risk neuroblastoma treated on a randomized trial of myeloablative therapy followed by 13-cis-retinoic acid: a children’s oncology group study. J Clin Oncol. 2009;27:1007–13. doi: 10.1200/JCO.2007.13.8925. [DOI] [PMC free article] [PubMed] [Google Scholar]
- 15.Alexander T, Nolte C, Krumlauf R. Hox genes and segmentation of the hindbrain and axial skeleton. Annu Rev Cell Dev Biol. 2009;25:431–56. doi: 10.1146/annurev.cellbio.042308.113423. [DOI] [PubMed] [Google Scholar]
- 16.Maden M. Retinoic acid in the development, regeneration and maintenance of the nervous system. Nat Rev Neurosci. 2007;8:755–65. doi: 10.1038/nrn2212. [DOI] [PubMed] [Google Scholar]
- 17.Pearson JC, Lemons D, McGinnis W. Modulating Hox gene functions during animal body patterning. Nat Rev Genet. 2005;6:893–904. doi: 10.1038/nrg1726. [DOI] [PubMed] [Google Scholar]
- 18.Moens CB, Selleri L. Hox cofactors in vertebrate development. Dev Biol. 2006;291:193–206. doi: 10.1016/j.ydbio.2005.10.032. [DOI] [PubMed] [Google Scholar]
- 19.Shah N, Sukumar S. The Hox genes and their roles in oncogenesis. Nat Rev Cancer. 2010;10:361–71. doi: 10.1038/nrc2826. [DOI] [PubMed] [Google Scholar]
- 20.Peverali FA, D’Esposito M, Acampora D, Bunone G, Negri M, Faiella A, et al. Expression of HOX homeogenes in human neuroblastoma cell culture lines. Differentiation. 1990;45:61–9. doi: 10.1111/j.1432-0436.1990.tb00458.x. [DOI] [PubMed] [Google Scholar]
- 21.Manohar CF, Furtado MR, Salwen HR, Cohn SL. Hox gene expression in differentiating human neuroblastoma cells. Biochemistry and molecular biology international. 1993;30:733–41. [PubMed] [Google Scholar]
- 22.Manohar CF, Salwen HR, Furtado MR, Cohn SL. Up-regulation of HOXC6, HOXD1, and HOXD8 homeobox gene expression in human neuroblastoma cells following chemical induction of differentiation. Tumour Biol. 1996;17:34–47. doi: 10.1159/000217965. [DOI] [PubMed] [Google Scholar]
- 23.Asgharzadeh S, Pique-Regi R, Sposto R, Wang H, Yang Y, Shimada H, et al. Prognostic significance of gene expression profiles of metastatic neuroblastomas lacking MYCN gene amplification. J Natl Cancer Inst. 2006;98:1193–203. doi: 10.1093/jnci/djj330. [DOI] [PubMed] [Google Scholar]
- 24.Oberthuer A, Berthold F, Warnat P, Hero B, Kahlert Y, Spitz R, et al. Customized oligonucleotide microarray gene expression-based classification of neuroblastoma patients outperforms current clinical risk stratification. J Clin Oncol. 2006;24:5070–8. doi: 10.1200/JCO.2006.06.1879. [DOI] [PubMed] [Google Scholar]
- 25.Chen QR, Song YK, Wei JS, Bilke S, Asgharzadeh S, Seeger RC, et al. An integrated cross-platform prognosis study on neuroblastoma patients. Genomics. 2008;92:195–203. doi: 10.1016/j.ygeno.2008.05.014. [DOI] [PMC free article] [PubMed] [Google Scholar]
- 26.Cui H, Ma J, Ding J, Li T, Alam G, Ding HF. Bmi-1 regulates the differentiation and clonogenic self-renewal of I-type neuroblastoma cells in a concentration-dependent manner. J Biol Chem. 2006;281:34696–704. doi: 10.1074/jbc.M604009200. [DOI] [PubMed] [Google Scholar]
- 27.Ross RA, Spengler BA, Domenech C, Porubcin M, Rettig WJ, Biedler JL. Human neuroblastoma I-type cells are malignant neural crest stem cells. Cell Growth Differ. 1995;6:449–56. [PubMed] [Google Scholar]
- 28.Holzel M, Huang S, Koster J, Ora I, Lakeman A, Caron H, et al. NF1 is a tumor suppressor in neuroblastoma that determines retinoic acid response and disease outcome. Cell. 2010;142:218–29. doi: 10.1016/j.cell.2010.06.004. [DOI] [PMC free article] [PubMed] [Google Scholar]
- 29.Cohen PS, Letterio JJ, Gaetano C, Chan J, Matsumoto K, Sporn MB, et al. Induction of transforming growth factor beta 1 and its receptors during all-trans-retinoic acid (RA) treatment of RA-responsive human neuroblastoma cell lines. Cancer Res. 1995;55:2380–6. [PubMed] [Google Scholar]
- 30.Evans AE, D’Angio GJ, Randolph J. A proposed staging for children with neuroblastoma. Children’s cancer study group. A Cancer. 1971;27:374–8. doi: 10.1002/1097-0142(197102)27:2<374::aid-cncr2820270221>3.0.co;2-g. [DOI] [PubMed] [Google Scholar]
- 31.Haas D, Ablin AR, Miller C, Zoger S, Matthay KK. Complete pathologic maturation and regression of stage IVS neuroblastoma without treatment. Cancer. 1988;62:818–25. doi: 10.1002/1097-0142(19880815)62:4<818::aid-cncr2820620430>3.0.co;2-k. [DOI] [PubMed] [Google Scholar]
- 32.Izpisua-Belmonte JC, Falkenstein H, Dolle P, Renucci A, Duboule D. Murine genes related to the Drosophila AbdB homeotic genes are sequentially expressed during development of the posterior part of the body. Embo J. 1991;10:2279–89. doi: 10.1002/j.1460-2075.1991.tb07764.x. [DOI] [PMC free article] [PubMed] [Google Scholar]
- 33.Svingen T, Tonissen KF. Hox transcription factors and their elusive mammalian gene targets. Heredity. 2006;97:88–96. doi: 10.1038/sj.hdy.6800847. [DOI] [PubMed] [Google Scholar]
- 34.Satyanarayana A, Kaldis P. Mammalian cell-cycle regulation: several Cdks, numerous cyclins and diverse compensatory mechanisms. Oncogene. 2009;28:2925–39. doi: 10.1038/onc.2009.170. [DOI] [PubMed] [Google Scholar]
- 35.Schuettengruber B, Chourrout D, Vervoort M, Leblanc B, Cavalli G. Genome regulation by polycomb and trithorax proteins. Cell. 2007;128:735–45. doi: 10.1016/j.cell.2007.02.009. [DOI] [PubMed] [Google Scholar]
- 36.Alam G, Cui H, Shi H, Yang L, Ding J, Mao L, et al. MYCN promotes the expansion of Phox2B-positive neuronal progenitors to drive neuroblastoma development. Am J Pathol. 2009;175:856–66. doi: 10.2353/ajpath.2009.090019. [DOI] [PMC free article] [PubMed] [Google Scholar]
- 37.Hahn CK, Ross KN, Warrington IM, Mazitschek R, Kanegai CM, Wright RD, et al. Expression-based screening identifies the combination of histone deacetylase inhibitors and retinoids for neuroblastoma differentiation. Proc Natl Acad Sci U S A. 2008;105:9751–6. doi: 10.1073/pnas.0710413105. [DOI] [PMC free article] [PubMed] [Google Scholar]
- 38.Huang S, Laoukili J, Epping MT, Koster J, Holzel M, Westerman BA, et al. ZNF423 is critically required for retinoic acid-induced differentiation and is a marker of neuroblastoma outcome. Cancer Cell. 2009;15:328–40. doi: 10.1016/j.ccr.2009.02.023. [DOI] [PMC free article] [PubMed] [Google Scholar]
- 39.Hortsch M. The L1 family of neural cell adhesion molecules: old proteins performing new tricks. Neuron. 1996;17:587–93. doi: 10.1016/s0896-6273(00)80192-0. [DOI] [PubMed] [Google Scholar]
- 40.Suzuki H, Tohyama K, Nagata K, Taketani S, Araki M. Regulatory expression of Neurensin-1 in the spinal motor neurons after mouse sciatic nerve injury. Neuroscience letters. 2007;421:152–7. doi: 10.1016/j.neulet.2007.03.077. [DOI] [PubMed] [Google Scholar]
- 41.Garcia-Bellido A. Homoeotic and atavic mutations in insects. Amer Zool. 1977;17:613–29. [Google Scholar]
- 42.Duboule D. The rise and fall of Hox gene clusters. Development. 2007;134:2549– 60. doi: 10.1242/dev.001065. [DOI] [PubMed] [Google Scholar]
- 43.Joshi VV, Cantor AB, Altshuler G, Larkin EW, Neill JS, Shuster JJ, et al. Recommendations for modification of terminology of neuroblastic tumors and prognostic significance of Shimada classification. A clinicopathologic study of 213 cases from the Pediatric Oncology Group. Cancer. 1992;69:2183–96. doi: 10.1002/1097-0142(19920415)69:8<2183::aid-cncr2820690828>3.0.co;2-c. [DOI] [PubMed] [Google Scholar]
- 44.Bhalla KN. Epigenetic and chromatin modifiers as targeted therapy of hematologic malignancies. J Clin Oncol. 2005;23:3971–93. doi: 10.1200/JCO.2005.16.600. [DOI] [PubMed] [Google Scholar]
- 45.Yoo CB, Jones PA. Epigenetic therapy of cancer: past, present and future. Nat Rev Drug Discov. 2006;5:37–50. doi: 10.1038/nrd1930. [DOI] [PubMed] [Google Scholar]
Associated Data
This section collects any data citations, data availability statements, or supplementary materials included in this article.