

Abstract
Our guiding hypothesis is that ecto-enzymatic conversion of extracellular ATP to adenosine activates A1 adenosine receptors, reducing resistance to aqueous humor outflow and intraocular pressure. The initial step in this purinergic regulation is ATP release from outflow-pathway cells by mechanisms unknown. We measured similar ATP release from human explant-derived primary trabecular meshwork (TM) cells (HTM) and a human TM cell line (TM5). Responses to 21 inhibitors indicated that pannexin-1 (PX1) and connexin (Cx) hemichannels and P2X7 receptors (P2RX7) were comparably important in modulating ATP release induced by hypotonic swelling, whereas vesicular release was insignificant. Consistent with prior studies of PX1 activity in certain other cells, ATP release was lowered by the reducing agent dithiothreitol. Overexpressing PX1 in HEK293T cells promoted, while partial knockdown (KD) in both HEK293T and TM5 cells inhibited hypotonicity-activated ATP release. Additionally, KD reduced the pharmacologically-defined contribution of PX1 and enhanced those of Cx and P2RX7. ATP release was also triggered by raising intracellular Ca2+ activity with ionomycin after a prolonged lag time and was unaffected by the PX1 blocker probenecid, but nearly abolished by P2RX7 antagonists. We conclude that swelling-stimulated ATP release from human TM cells is physiologically mediated by PX1 and Cx hemichannels and P2X7 receptors, but not by vesicular release. PX1 appears not to be stimulated by intracellular Ca2+ in TM cells, but can be modulated by oxidation-reduction state. The P2RX7-dependent component of swelling-activated release may be mediated by PX1 hemichannels or reflect apoptotic magnification of ATP release, either through itself and/or hemichannels.
Keywords: Pannexin-1, Connexins, Hemichannels, P2X7 ATP receptors, Aqueous humor outflow
INTRODUCTION
Glaucoma is a major worldwide cause of irreversible blindness. Currently, the onset of glaucomatous blindness can be delayed and progression retarded solely by lowering the eye’s hydrostatic pressure (intraocular pressure, IOP) (Collaborative Normal-Tension Glaucoma Study Group, 1998a; Collaborative Normal-Tension Glaucoma Study Group, 1998b; Kass et al., 2002; The AGIS investigators, 2000). The IOP depends directly on the rate of aqueous humor formation by the ciliary epithelium and the exit resistance from the eye through the trabecular outflow pathway (Krupin and Civan, 1996). Reducing outflow resistance is a major therapeutic strategy for lowering IOP.
The trabecular outflow pathway comprises the trabecular meshwork (TM), juxtacanalicular tissue (JCT), inner wall of Schlemm’s canal (SC), collector channels and aqueous veins in series (Tamm, 2009). The site of highest resistance remains uncertain (Freddo and Johnson, 2008; Kumar and Epstein, 2010; Tamm, 2009), but likely resides at the confluence of the TM, JCT and SC inner wall (Ethier, 2002; Freddo and Johnson, 2008; Johnson and Erickson, 2000; Tamm, 2009). In this small area, the TM consists of flat beams or plates of ground-substance, collagenous and elastin-like fibers covered by a complete layer of endothelial cells (Lütjen-Drecoll and Rohen, 1996). The JCT consists of a 5–10 μm-thick array of fibroblast-like cells intermingled and attached to each other, to the SC inner wall and to surrounding fine collagen and elastin-like fibrils (Johnson and Erickson, 2000; Lütjen-Drecoll and Rohen, 1996). The SC endothelial cells are connected by unusually leaky tight junctions (Raviola and Raviola, 1981), but aqueous humor likely crosses the inner wall through giant vacuoles associated with transendothelial pores (Johnson and Erickson, 2000; Pedrigi et al., 2010; Tripathi, 1996).
The total outflow resistance is remarkably low, suggesting that fluid exits between, rather than through the cells (Johnson and Erickson, 2000). However, cells in the outflow pathway must play a major regulatory role. Cell swelling raises, and cell shrinkage lowers, outflow resistance in calf, nonhuman primate and human eyes (Al-Aswad et al., 1999; Gual et al., 1997; Rohen, 1963). One mechanism for cellular regulation of outflow resistance is through cell-dependent remodeling of the extracellular matrix (Aga et al., 2008). Specifically, TM cells are thought to release components of extracellular matrix, matrix metalloproteinases (MMPs) and their inhibitors (TIMPs) (Crosson, 1992; Crosson, 1995; Crosson, 2001; Crosson and Gray, 1996; Crosson et al., 2000; Crosson et al., 2005; Crosson et al., 2004; Shearer and Crosson, 2002). TM cells display podosome- or invadapodia-like structures that have been suggested to be the surface foci for turnover of extracellular matrix (Aga et al., 2008).
Release of MMP-2 by TM cells is modulated by A1 adenosine receptors (ARs) (Shearer and Crosson, 2002). Stimulation of A1ARs reduces outflow resistance in cynomolgus monkeys (Tian et al., 1997) and perfused bovine anterior segments (Crosson et al., 2005), and reduces IOP in multiple species (Avila et al., 2001; Crosson, 1995; Crosson and Gray, 1996; Tian et al., 1997). The A1-stimulated fall in outflow resistance is markedly inhibited by blocking MMP activity (Crosson et al., 2005). The source of the adenosine delivered to the TM cells is likely ecto-enzymatic metabolism of ATP that can be released by the cells, themselves (Fleischhauer et al., 2003) (Fig. 1). Like most or all other mammalian cells (Lévesque et al., 2007; Yegutkin, 2008; Zimmermann, 2000), TM cells functionally express ecto-enzymatic activity (Chow et al., 2007) whose molecular basis has been unknown. Unpublished RT-PCR analyses indicate gene expression of one or more isoforms of the following: ENTPDase2 (CD39L1), ENTPDase8, ENPP1, ENPP2, ENPP3, and ecto-57prime;-nucleotidase (CD73) (Li, A. and Civan, M.M.). Despite the persuasive data linking A1ARs to regulation of outflow resistance and IOP, information has been unavailable concerning the first step in that regulation. The current study focuses specifically and exclusively on this first step, and identifies the mechanisms for ATP release by human TM cells.
Fig. 1. Purinergic regulation of aqueous humor outflow.

The present aim was to identify which of the mechanisms thought to subserve ATP release in other preparations might underlie release by TM cells. The current results indicate that PX1, Cxs and P2RX7 play major roles, but not CFTR, VSOR, the maxi-anion channel or vesicular release. Following release, ATP can directly activate multiple P2X and P2Y receptors to initiate downstream purinergic signaling, or can be ecto-enzymatically degraded into adenosine, stimulating A1AR-mediate matrix metalloproteinase 2 (MMP-2) secretion. The MMP-2 lowers outflow resistance, thereby reducing intraocular pressure.
MATERIALS AND METHODS
Cellular models
Transformed normal human trabecular meshwork cells (TM5, Alcon Research Inc., Fort Worth, TX) (Pang et al., 1994) and HEK293T cells (ATCC, Manassas, VA) were maintained in DMEM high-glucose media supplemented with 10% fetal bovine serum, 2 mM L-glutamine and 50 μg/mL of gentamicin at 37°C in a humidified atmosphere of 5% CO2 and 95% air. Culture media were changed every three days and cells were subcultivated 1:5 upon reaching 90% confluence, and were studied from passages 20 to 35. Primary human trabecular meshwork cells (HTM) (Stamer et al., 1995) were maintained in DMEM low-glucose media containing the same supplements; cells from passages 4 to 7 were used in the experiments.
Solutions and pharmacological reagents
The isotonic solution (295–305 mOsm/kg) with 2.5 mM extracellular free Ca2+ ([Ca2+]ex) was composed of (in mM): 110 NaCl, 4.7 KCl, 2.5 CaCl2, 1.2 MgCl2, 30 NaHCO3, 1.2 KH2PO4, 15 HEPES, and 10 glucose. Selectively omitting NaCl reduced osmolality to ~100 mOsm/kg (67% hypotonicity). Intermediate osmolalities were generated by appropriate mixing of the iso- and hypotonic solutions. In some experiments, the [Ca2+]ex was reduced to 0.1 mM with 5.1 mM CaCl2 and 5 mM EGTA, or to zero by adding 5 mM EGTA without CaCl2. The final osmolalities were verified and pH values adjusted to 7.4 before each experiment. Biochemical reagents were purchased from Sigma-Aldrich (St Louis, MO), except for lavendustin C (Calbiochem, San Diego, CA), probenecid (Alfa Aesar, War Hill, MA), 8-(4-chloro-phenylthio)-cAMP (cpt-cAMP) (Roche Diagnostics, Indianapolis, IN), dithiothreitol (Fisher Scientific, Pittsburg, PA), mefloquine (BioBlocks Inc, San Diego, CA), A438079 and DCPIB (Tocris Bioscience, Ellisville, MO). The cAMP-stimulating mixture contained (in μM): 10 forskolin, 500 cpt-cAMP, and 100 IBMX (3-isobutyl-1-methylxanthine). Chemicals and media for cell culture were obtained from GIBCO (Invitrogen, Carlsbad, CA). DMSO (<0.5%) was used to solubilize hydrophobic drugs, exposing controls to the same concentration of vehicle. Unless otherwise noted, all experiments were conducted at room temperature.
ATP measurement
ATP release was measured by bioluminescent luciferin-luciferase reaction with light emission recorded using a microplate luminometer (Synergy 2, BioTEK, Winooski, VT) as previously described (Li et al., 2010). In brief, cells were trypsinized and plated onto 96-well microplates (Corning Costar, Corning, NY) at 0.1 million per well, resulting in confluence within 1–3 days. To minimize ATP release in the course of pre-incubations, culture media were removed and replaced by 100 μL isotonic solutions with or without drugs 1 hr before experiment. Thereafter, 75 μL of isotonic solution were replaced by an equal volume of test solution to establish the final osmolalities and drug concentrations. The plate was placed in the luminometer 30–60 sec after addition of test solutions, and 10 μL of the ATP assay solution were injected into each well through the internal dispenser system. Measurements were begun immediately after dispensing the solutions, and taken at 2-min intervals for each well for 2 hrs, with an integration time of 0.2 sec/measurement. ATP levels were calculated at each time point from a standard curve transforming arbitrary light units into ATP concentrations. Separate standard curves were utilized in experiments involving either changes in ionic strength or test substances at concentration high enough to interfere with the ATP assay. In particular, separate calibrations were performed when either disodium 4-acetamido-4′-isothiocyanato-stilben-2,2′-disulfonate (SITS) or disodium 4,4′-diisothiocyanatostilbene-2,2′-disulfonate (DIDS) was added. Inhibition of the hypotonicity-induced enhancement of ATP release was calculated from Eq. 1.
| (1) |
Cmax was the maximal ATP concentration (C) after hypotonic treatment without inhibitor, Ccon was the control value of ATP concentration in the isotonic bath at the same time point, and Cexp was the maximal ATP concentration (C) after hypotonic treatment in the presence of inhibitor.
As illustrated by the time courses of Figs. 2A–B, the extracellular ATP concentration reached a peak value ~20 min after applying hypotonicity. Time-to-peak ATP values varied over a range of approximately 6 min among different wells of a single experiment. Cmax for each experiment was calculated as the mean of individually measured peak concentrations in a given experiment. In contrast to the release from hypotonically-challenged cells, ATP release from cells in isotonic solution were highly stable over the period of measurement (Figs. 2A–B) and, as discussed in the Results, were unaffected by the inhibitors applied. Ccon was calculated as the mean ATP concentration over the 10–40 min after initiating measurement, averaged over all wells of each experiment. This approach ensured that the isotonic ATP release subtracted from Cmax (Eq. 1) was measured during the same time period as the measurements of the swelling-activated peak concentrations. Percentage inhibition was calculated individually with Eq. 1 for each drug-treated well, using the measured swelling-triggered peak ATP concentration (Cexp). The swelling-produced peak concentrations appeared within the same relatively narrow range of times (~6 min) in the presence or absence of inhibitors (Figs. 2A–B). An illustration of the calculation of percentage inhibition is provided in the traces and legend of Fig. 2A.
Fig. 2. Time courses of ATP concentration in solutions bathing HEK293T (A) and TM5 cells (B).

The inhibitions calculated for the single wells were pooled and averaged to generate the final percentage inhibitions presented in the figures and tables.
Fig. 2B illustrates the similar time courses of ATP release by TM5 cells in isotonic solution, hypotonic solution and hypotonic solution containing 1 mM heptanol. The data are the means ± SE of measurements obtained with 40–77 wells from five experiments.
The release rate of ATP after ionomycin stimulation was measured as the slope (S) of the approximately linear increase in the ATP concentration over a 10-min period at 50% maximal ATP release. Inhibition of the ionomycin-induced ATP release was calculated from Eq. 2.
| (2) |
“stim” refers to cells stimulated with ionomycin without inhibitor, “exp” refers to stimulated cells in the presence of inhibitor(s), and “con” refers to cells in isotonic solutions without ionomycin.
Cell viability assays
To quantify cell viability after treatment, the lactose dehydrogenase (LDH) assay and the thiazolyl blue tetrazolium bromide (MTT) assay were adopted. Release of LDH from damaged cells was measured as previously described (Li et al., 2010). Briefly, aliquots of cells were similarly challenged with the stimuli specified, and 50 μL of supernatant were collected from each well at the end of the experiment. Activity of released LDH was measured with the Cytotoxicity Detection Kit (Roche Diagnostic) following the manufacturer’s instructions. The MTT assay was performed at the end of the ATP measurements, with assay solutions completely removed and replaced with 100-μL isotonic solution per well containing 0.5 mg/mL MTT, followed by 3-hr incubation at 37°C. Thereafter, 100 μL of the lysis buffer composed of 20% SDS and 50% DMSO were added into each well to dissolve MTT formazan with constant shaking at room temperature for 2 hrs until the formazan precipitate was no longer visible. Dye absorbances at 562 and 650 nm (reference wavelength) were obtained with the Vmax Microplate Spectrophotometer (Molecular Devices, Sunnyvale, CA). Cell viability (%) by the MTT method was calculated according to Eq. 3.
| (3) |
where “OD” refers to the background-subtracted optical density, “pos-ctrl” refers to cells bathed in control isotonic solution, “neg-ctrl” refers to cells treated with 0.5% Triton X-100, and “sample” refers to cells challenged with either hypotonicity or ionomycin at the specified [Ca2+]ex.
Reverse transcription polymerase chain reaction (RT-PCR)
Total RNA was isolated from cells using the RNeasy Mini Kit (Qiagen, Valencia, CA) and treated with RNase-free DNase I to avoid possible genomic DNA contamination, followed by reverse-transcription into cDNA by use of Taqman Reverse Transcription Reagents [Applied Biosystems (ABI), Foster City, CA], according to the manufacturer’s instructions. PCR was performed with the AccuPrime Taq DNA polymerase High Fidelity Kit (Invitrogen) under the recommended conditions. Primers used for gene-specific amplification are shown in Supplementary Table 1A. PCR products were separated on 1% agarose gels containing 0.05% ethidium bromide. Bands were visualized under ultraviolet light, sized, and photographed by the Molecular Imager Gel Doc XR+ System (Bio-Rad, Hercules, CA). The successfully amplified products were recovered by gel extraction and further verified by sequencing in the DNA Sequencing Facility of the University of Pennsylvania.
Real-time quantitative PCR
Cell cDNA templates were obtained as described above. The Taqman gene expression assay was performed at least in quadruplicate for each cDNA sample. Assays were run with Fast Universal Taqman Master Mix on the Applied Biosystems Prism 7500 Fast Sequence Detection System using the fast ramping protocol. FAM-labeled MGB Taqman probes utilized in the assays are listed in Supplementary Table 1B. The expression levels of indicated genes were all normalized to that of PX1 in specified control cells after 2−Δ ΔCt calculation, with human glyceraldehyde 3-phosphate dehydrogenase (GAPDH) as the endogenous control.
Western immunoblotting
Cells were lysed with RIPA buffer (Pierce, Rockford, IL) supplemented with proteinase inhibitor cocktail (Complete Mini Tablets, Roche Diagnostics). Samples were sonicated for 30 sec with a 50% pulse and cleared by centrifugation (10,000 g) at 4°C for 30 min. Supernatant protein concentrations were determined by BCA protein assay reagent (Pierce). Homogenate containing 20 μg of protein per lane was separated by SDS-PAGE and transferred to polyvinylidene fluoride membranes (Millipore, Billerica, MA). Nonspecific binding was blocked with Protein-Free Blocking Buffers (Pierce) for 1 hr. Blots were then probed overnight at 4°C with primary antibodies, followed by 1-hr incubations with secondary antibodies conjugated to horseradish peroxidase (HRP), and then developed by chemiluminescence detection (SuperSignal West Pico Substrate, Pierce). The antibodies used for detection were mouse anti-myc (1/5,000) and mouse anti-6×His (1/6,000, Invitrogen); rabbit anti-PX1 (1/2,000) and mouse anti-GAPDH (1/10,000, Abcam, Cambridge, MA); and sheep anti-mouse and goat anti-rabbit IgG-HRP (1/8,000, Amersham, GE health Life Science).
Plasmid preparation and PX1 overexpression in HEK293T Cells
The whole coding sequence of human PX1 was amplified from pCMV-SPORT6-PX1 (BC016931, Mammalian Gene Collection, NIH) by PCR using primers 5′-GCGAATTCGGCAGCGAGCGCGAGAG-3′ (sense) and 5′-GCCTCGAGGGCAAGAAGAATCCAGAAGTCTC-3′ (antisense), with addition of restrictive enzyme digestion sites and deletion of stop condon. PCR was performed as follows: one cycle of 94°C for 2 min, 40 cycles of 94°C for 15 sec, 57°C for 30 sec, 68°C for 2 min, and one cycle of 68°C for 10 min. The expected product was inserted into pcDNA3.1-myc-6×His type C (Invitrogen) with EcoRI/XhoI double digestion (Promega, Madison, WI) and ligation (Fast Ligation Kit, Roche Diagnostics). The new construct PX1-myc-6×His was confirmed by full DNA sequencing. For PX1 overexpression, HEK293T cells were seeded 24 hrs prior to experiment and reached 80% confluence on the day of transfection. Plasmids (5 μg per million cells) were delivered into the cells by Lipofectamine 2000 (15 μL, Invitrogen) following the manufacturer’s suggestion. Detection of the PX1-myc-6×His protein overexpressed in HEK293T cells was carried out two days later by western-blotting and immunocytochemistry, and pharmacological tests were performed within four days post-transfection.
Confocal microscopy of PX1-overexpressed HEK293T cells
Cells were trypsinized and reseeded on poly-L-Lysine-coated coverslips 48 hrs post-transfection and were allowed to attach firmly to the underlying surface for 4 hrs before fixation. As previously reported (Li et al., 2010), due to the relatively short time period between seeding and fixation, the cells appeared round, rather than polygonal. The HEK293T cells were fixed with 4% paraformaldehyde for 10 min and permeated with 100 μM digitonin for 10 min, followed by blocking with 1% bovine serum albumin-PBS for 1 hr.
Samples were probed with diluted primary antibodies in a humidified chamber overnight at 4°C. Coverslips were rinsed with PBS three times, and then incubated with fluorophore-conjugated secondary antibodies for 1 hr. DAPI (0.15 μg/mL) was added to counterstain the nuclei fluorescently. Coverslips mounted with Prolong Gold Antifade Reagent (Invitrogen) were observed by confocal laser scanning microscope (Olympus FluoView 1000, Olympus America, Center Valley, PA). Single layers of 0.4-μm thickness were photographed. The antibodies used for detection were mouse anti-myc (1/500), mouse anti-6×His (1/500), and rabbit-anti mouse IgG Alexa Fluor-594 (1/1,000), all from Invitrogen.
Knockdown of PX1 in HEK293T and TM5 cells
The lentiviral shRNA construct targeting human PX1 was purchased from Open Biosystems (TRCN0000156046, Thermo Fisher Scientific, Huntsville, AL). The plasmids were extracted using the EndoFree Plasmid Maxi Kit (Qiagen) and delivered into HEK293T cells by the same transfection method mentioned above. Puromycin (5 μg/mL) was added to the culture medium three days after transfection, and the efficiency of knockdown (KD) was evaluated by real-time PCR one week later. The PX1-KD HEK293T cells tested for ATP release were under puromycin selection constantly, and monitored for their PX1 mRNA levels. High-titer lentiviral particles derived from the same construct were packaged by Sigma-Aldrich, and non-targeted lentiviral particles (SHC002V, Sigma-Aldrich) were used as the mock control. TM5 cells plated onto 96-well microplates at a density of 0.04 million/well were initially transduced with the viral particles (0.4 TU/cell) and Polybrene (8 μg/mL). The stable PX1-KD TM5 cell line was similarly generated by puromycin selection (0.5 μg/mL), verified by real-time PCR and western-blotting.
Statistics
Student’s t-test, paired or unpaired as appropriate, was applied in comparing two sets of data, and one-way ANOVA was applied to compare three or more sets of data. Statistical analyses were performed with SigmaStat (Aspire Software International). Unless otherwise stated, the results are presented as means ± SE, with n and N indicating the number of wells studied and the number of independent experiments performed, respectively. A probability (P) less than 0.05 was considered statistically significant.
RESULTS
Swelling-activated ATP release from human trabecular meshwork cells
The ATP concentrations in the control isotonic solutions with 0.1 mM [Ca2+]ex were 11.1 ± 0.1 nM (n=1,878 wells) and 13.6 ± 0.7 nM (n=96) after incubation of TM5 and HTM cells, respectively. These low baseline levels were stable during the 2-hr measurement. Bathing TM5 cells in the isotonic solutions with increased 2.5 mM [Ca2+]ex did not significantly shift the baseline (11.6 ± 0.8 nM, n=64, P>0.05). Hypotonicity (50%) with 0.1 mM [Ca2+]ex triggered ATP release from TM5 cells (Fig. 2B), raising the concentration by 4.8-fold to 63.7 ± 0.7 nM (n=1,904, P<0.001), with a time to half-peak response (τ) of 8.5 ± 0.1 min. Similarly, hypotonicity elevated bath concentrations of ATP by 2.7 ± 0.1-fold (n=209, P<0.001) in HTM cells.
Cell viability estimated by the LDH assay was nearly 100% after 2 hrs of incubation in control isotonicity or 50% hypotonicity, at [Ca2+]ex of 0, 0.1, or 2.5 mM (Suppl. Fig. 1). The >99.5% viability of cells following treatment indicated, but did not prove, that ATP release during the period of measurement was physiological. The consistent results of the MTT assay also demonstrated an unchanged cell metabolic state after hypotonic exposure compared to isotonicity (Suppl. Fig. 1), suggesting that the release were mediated through physiological conduits, whose pharmacological profiles were next ascertained.
Mechanisms supporting hypotonicity-induced ATP release from TM5 cells
Multiple pathways are thought to subserve hypotonicity-induced ATP release from other preparations (Fig. 1). To identify the release mechanisms in the outflow-pathway cells, 24 inhibitors and stimuli were utilized in the initial probing with 2,930 drug-treated and 3,974 control wells of TM5 cells (Fig. 2B, Table 1, Suppl. Table 2).
TABLE 1.
Effects of inhibitors on swelling-induced ATP release from TM5 cells.
| Target Pathway | Drug (Concentration in μM) | Inhibition % ± SE % (wells) |
|---|---|---|
| PX1 | PRO (100) | 36.5 ± 1.6 (378)* |
| MFQ (0.03) | 24.3 ± 2.4 (100)* | |
| CBX (3) | 36.0 ± 3.8 (21)* | |
| CBX (30) | 53.6 ± 1.9 (192)* | |
| DTT (10,000) | 26.4 ± 1.2 (102)* | |
| DTT (10,000) + PRO (100) | 39.9 ± 2.0 (96)* | |
| DTT (10,000) + CBX (30) | 53.0 ± 1.4 (120)* | |
| CBX (30) + MFQ (0.03) | 51.6 ± 3.3 (54)* | |
| Cx | HEP (1,000) | 44.4 ± 2.9 (53)* |
| NFA (30) | 29.3 ± 3.1 (54)* | |
| External Ca2+ (2,500) | 36.1 ± 6.9 (72)* | |
| PX1+Cx | CBX (30) + HEP (1,000) | 80.4 ± 5.3 (54)* |
| DTT (10,000) + HEP (1,000) | 69.4 ± 0.9 (94)* | |
| P2RX7 | KN-62 (1) | 32.7 ± 2.6 (124)* |
| BBG (0.5) | 31.6 ± 3.1 (54)* | |
| A438079 (3) | 29.2 ± 4.0 (50)* | |
| PX1+Cx+P2RX7 | CBX (30) + HEP (1,000) + KN62 (1) | 96.2 ± 0.6 (56)* |
| CFTR | GLY (100) | 2.9 ± 3.8 (54) |
| VSOR and VSAC | DIDS (200) | 4.1 ± 5.5 (144) |
| DCPIB (10) | 9.0 ± 3.1 (96) | |
| Ca/CaMKII | LAC (1) | 5.8 ± 5.4 (54) |
| Vesicular Release | MON (100) | −9.1 ± 3.1 (54) |
| BAF (2) | 3.9 ± 3.8 (36) | |
| Maxi-anion channels | Gd3+ (50) | 3.1 ± 3.5 (54) |
| SITS (100) | 2.4 ± 3.1 (72) | |
| P-glycoprotein | VER (100) | 0.9 ± 3.0 (88) |
Note: Numbers in parentheses indicate numbers of wells measured. The inhibitors are grouped according to their putative major targets: pannexin-1 (PX1) hemichannels, connexin (Cx) hemichannels, P2X7 ionotropic ATP receptors (P2RX7), cystic fibrosis transmembrane conductance regulator (CFTR), volume-sensitive outwardly-rectifying chloride channel (VSOR), volume-sensitive anion channel (VSAC), and calcium/calmodulin-dependent protein kinase II (Ca/CaMKII). Positive and negative values indicate inhibition and stimulation, respectively. PRO, probenecid; MFQ, mefloquine; CBX, carbenoxolone; DTT, dithiothreitol; HEP, heptanol; NFA, niflumic acid; BBG, brilliant blue G; BAF: bafilomycin A1; Gd3+, gadolinium; GLY, glybenclamide; VER, verapamil; LAC, lavendustin C; MON, monensin.
P<0.001 vs hypotonicity controls.
Currently, the most informative blocker in discriminating the newly-identified pannexin-1 (PX1) from the long-known connexin (Cx) hemichannels is probenecid (PRO), which inhibits only PX1, but not Cx hemichannels (Silverman et al., 2008). In comparison to drug-untreated hypotonic controls, 0.1 mM PRO reduced hypotonicity-triggered ATP release from TM5 cells by 37 ± 2% (n=378). The anti-malarial drug mefloquine (MFQ) has also been discovered to be a selective inhibitor of PX1 at low concentrations (10–100 nM) by some, yet not all researchers. This discrepancy has recently been attributed to the source of the drug (Iglesias et al., 2009). In the current study, MFQ at 10 and 30 nM decreased swelling-stimulated ATP release by 17 ± 2% (n=84) and 24 ± 2% (n=100), respectively. Another relatively specific inhibitor of PX1 hemichannels is carbenoxolone (CBX) (Bruzzone et al., 2005), with a reported IC50 value of ~5 μM against PX1, 5- to 20-fold lower than that required to block Cx hemichannels. In the present study, CBX concentrations of 1 μM, 3 μM, 10 μM, and 30 μM inhibited hypotonicity-elicited ATP release by 20 ± 6% (n=11), 36 ± 4% (n=21), 55 ± 3% (n=37), and 54 ± 2% (n=192), respectively, with a calculated IC50 of 1.7 ± 0.5 μM. The reducing agent dithiothreitol (DTT, 10 mM) also lowered the release by 26 ± 1% (n=120), in accordance with its known partial inhibition of PX1 hemichannels (Bunse et al., 2009). Application of DTT together with PRO (0.1 mM) did not enhance the inhibition produced by 0.1 mM PRO, alone (40 ± 2%, n=96, P>0.05). Similar results were obtained when CBX (30 μM) was applied with 30 nM MFQ (52 ± 3%, n=54, P>0.05) or with 10 mM DTT (53 ± 1%, n=120, P>0.05). The outcomes of these drug-combinative tests suggest that ~40% of swelling-evoked ATP release was potentially mediated through PX1 hemichannels.
The relatively selective blocker of Cx hemichannels, heptanol (HEP, 1 mM) (Ma et al., 2009), and niflumic acid (NFA, 30 μM) (Eskandari et al., 2002; Ma et al., 2009), inhibited hypotonically-stimulated ATP release from TM5 cells by 44 ± 4% (n=53) and 29 ± 3% (n=54), respectively. As anticipated from the putative effects of [Ca2+]ex on Cx hemichannel activity (Ebihara et al., 2003), increasing [Ca2+]ex from 0.1 to 2.5 mM reduced the hypotonicity-induced ATP release by 36 ± 7% (n=72). In contrast, the complete removal of external Ca2+ in isotonic solutionsconsiderably elevated external ATP concentration over baseline by 16.5 ± 0.8-fold (n=80), which was substantially blocked by 1 mM HEP (89 ± 1%, n=16). We also adopted two approaches to inhibit PX1 and Cx hemichannels concurrently. Combining 1 mM HEP with either 30 μM CBX or 10 mM DTT further enhanced the inhibition of hypotonically-initiated ATP release to 80 ± 5% (n=54), and 69 ± 1% (n=94), respectively. Hence, the expected blockage of PX1 along with Cx hemichannels decreased swelling-elicited ATP release by ~80%. These data, taken together with the above estimated contribution by PX hemichannels of ~40%, suggest that Cx hemichannels might provide conduits for ~40% of the total hypotonicity-triggered ATP release.
We likewise inspected other suggested candidates’ role as the release conduit. Blockers of maxi-anion channels [Gd3+ (50 μM) and SITS (100 μM or 1 mM)] or of ATP transfer through vesicular release [monensin (MON, 100 μM) and bafilomycin A1 (BAF, 2 μM)] did not affect swelling-stimulated ATP release (Table 1, Suppl. Table 2). Blockers of volume-sensitive outwardly rectifying chloride channels (VSOR) and volume-sensitive anion channels (VSAC) [including DIDS (100 μM or 200 μM) and DCPIB (10 μM)] were ineffective in reducing hypotonically-evoked ATP release (Table 1, Suppl. Table 2). Similarly, the P-glycoprotein inhibitor verapamil (VER, 100 μM) and cystic fibrosis transmembrane conductance regulator (CFTR) blocker glybenclamide (GLY, 100 μM) did not alter hypotonicity-triggered release (Table 1). Moreover, raising intracellular cAMP activity by administering foskolin (FSK, 10 μM, n=29, P=0.29), cpt-cAMP (500 μM, n=34, P=0.67), or the cAMP-stimulating mixture (n=30, P=0.36) did not trigger ATP release under isotonic conditions, which further excluded the possibility that CFTR plays a part in regulating ATP release from TM5 cells.
Incubating cells with P2X7 receptor (P2RX7) antagonists, including KN-62 (1 μM), brilliant blue G (BBG, 0.5 μM), and A438079 (3 μM), significantly decreased swelling-activated ATP release by 33 ± 3% (n=124, P<0.001), 32 ± 3% (n=54, P<0.001), and 29 ± 4% (n=50, P<0.001), respectively (Table 1). While KN-62 is also a blocker of calcium/calmodulin-dependent protein kinase II (Ca/CaMKII), no such inhibition was detected with the selective Ca/CaMKII blocker lavendustin C (LAC, 1 μM), implying that P2RX7 provides or regulates a third hypotonicity-induced ATP-release conduit in TM5 cells. Nearly complete inhibition (96 ± 1%, n=54) of the swelling-evoked ATP release from TM5 cells was achieved by simultaneously blocking PX1, Cx hemichannels and P2RX7 using a combination of 30 μM CBX, 1 mM HEP, and 1 μM KN-62. This result, together with the findings from the LDH and MTT assays, suggested that there was no measurable loss of cell viability in TM5 cells under our experimental conditions.
Comparison of mechanisms supporting hypotonicity-induced ATP release from TM5 and from primary HTM cells
The results acquired from HTM cells were similar to those measured with TM5 cells, with only minor differences in drug efficacies and potencies (Suppl. Table 2). The closeness of the similarity is illustrated by Fig. 3, in which inhibitions observed with HTM cells are plotted as functions of the inhibitions noted with TM5 cells following applications of the same drugs. The pharmacological profiles suggest that swelling-triggered ATP release in trabecular meshwork cells was largely mediated through three conduits: PX1 and Cx hemichannels, and P2RX7 receptors. We next probed whether the molecular conduits indicated by the pharmacologic studies were expressed by the TM cells.
Fig. 3. Linear correlation between inhibition of ATP release from a normal human TM cell line (TM5) and human explant-derived primary TM Cells (HTM).

Filled squares (■) reflect measurements after hypotonic exposure in the presence of 0.1 mM PRO, 1 mM HEP, 1 μM KN-62, 2 μM BAF, 50 μM Gd3+, 1 μM LAC, 100 μM GLY, or 30 μM CBX + 1 mM HEP + 1 μM KN-62. Open circles (○) refer to data obtained after exposure to ionomycin together with 0.1 mM PRO, 1 mM HEP, 1 μM KN-62, or 1 μM LAC. The linear regression line relates inhibition of HTM cells (y) to inhibition of the TM5 cell line (x) by the same drug at the identical concentration after the same stimulation: y = (−2.57 ± 1.53) + (1.04 ± 0.03)· x, with a correlation coefficient (R) of 0.99 (P<0.0001).
Molecular identification of ATP-permeable conduits in human trabecular meshwork cells
No information has been previously reported regarding the ATP-release channels of TM cells. In the present investigation, we first documented expression of PX1 and Cx hemichannels (Cx26, Cx31, Cx43), P2RX7 and CFTR in both TM5 and HTM cells, by RT-PCR (Fig. 4A) and subsequent DNA sequencing. Additionally, the expression of PX1 protein in TM5 and HTM cells was verified by western immunoblotting, using HEK293T cells as a positive control (Fig. 4C).
Fig. 4. Molecular identification of multiple ATP-permeable conduits from two preparations of human TM cells.
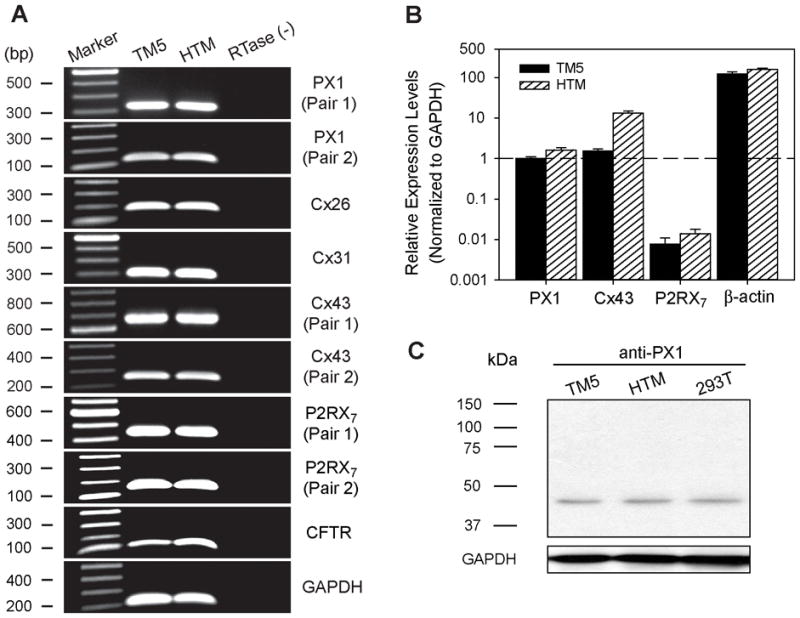
RT-PCR with subsequent DNA sequencing verified that both TM5 and HTM cells express PX1, Cx26, Cx31, Cx43, P2RX7, and CFTR. No product was detectable upon omitting reverse-transcriptase [RTase (−)], confirming that the cDNA derived from total RNA was free of genomic DNA contamination (A). The relative expressions of PX1, Cx43, P2RX7, and beta-actin genes in the two cell preparations were quantified by real-time PCR (N=5–7 independent experiments), using GAPDH as the internal control (B). The expression of PX1 protein in TM5 and HTM cells was further verified by western-blotting, taking HEK293T cells as the positive control (C).
The relative expression levels of genes generating swelling-evoked ATP-release pathways were quantified by real-time PCR (Fig. 4B). PX1 and Cx43 were in similar abundance, while P2RX7 was ~1% that of PX1 in TM5 cells. Expression levels of PX1 and P2RX7 were comparable in HTM cells, and Cx43 was ~8-fold higher than in TM5 cells.
Overexpression of human PX1 in HEK293T cells
Due to their intrinsic intractability to transfection, TM5 and HTM cells were resistant to overexpression or siRNA-mediated knockdown (KD) of PX1. To test the function of human PX1 in hypotonicity-elicited ATP release under overexpressed conditions, we transfected HEK293T cells with PX1-myc-6×His plasmids. The treatment succeeded in transiently overexpressing tagged PX1, verified by western-blotting (Fig. 5A). Single-layer confocal microscopy confirmed that the overexpressed PX1 proteins with small myc-6×His tags were localized nearly exclusively at or near the plasma membranes (Fig. 5B).
Fig. 5. Heterologous expression of PX1 in HEK293T cells.
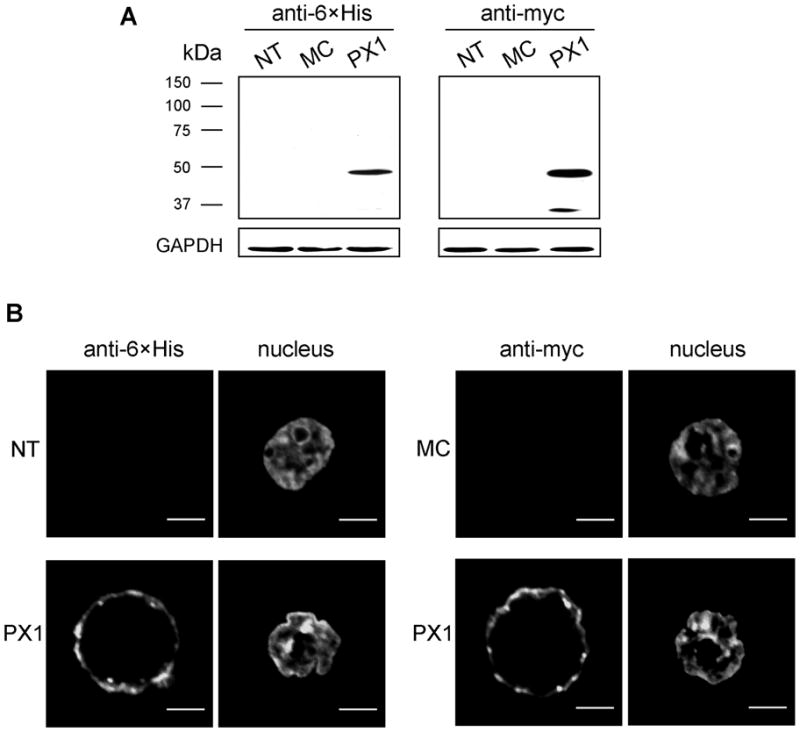
Western-blotting confirmed the expression of human PX1 proteins tagged with myc-6×His, using anti-myc and anti-6×His monoclonal antibodies. No band was visible in either non-treated (NT) or mock control (MC, transfected with blank vector) cells (A). Confocal microscopic images demonstrated the localization of the PX1 close to or within the plasma membrane. No such staining was observed in NT or MC cells (B).
We then tested whether the overexpressed PX1 protein was functional in releasing ATP after swelling stimulation from HEK293T cells. Hypotonicity (50%) increased the ATP level over baseline by 4.1 ± 0.2-fold (n=424) in HEK293T cells transfected with blank vector (Fig. 2A). Overexpression of PX1 did not alter the ATP levels in isotonic solutions (n=128, P>0.05), but raised the hypotonically-elicited ATP release by 48 ± 9% (n=96, P<0.001 compared with the mock cells). Correspondingly, PX1 overexpression increased efficacy of PRO (0.1 mM) from 24 ± 2% (n=84) to 40 ± 2% (n=77, P<0.001), and decreased inhibition efficacy of HEP (1 mM) from 47 ± 2% (n=118) to 29 ± 5% (n=104, P<0.01). The results demonstrate that PX1 can be functionally overexpressed to regulate swelling-initiated ATP release, in support of our prior conclusion based on pharmacological data that PX1 is a major release mechanism for hypotonicity-evoked ATP release by trabecular meshwork cells.
Knockdown of human PX1 in HEK293T and TM5 cells
We complemented the overexpression experiments by transfecting normal HEK293T cells with shRNA plasmids targeting PX1. The pilot data identified the most effective construct (TRCN0000156046) among a set of 5 clones from Open Biosystems. By means of puromycin selection, the expression level of PX1 was greatly reduced by 60 ± 3% (N=14 independent experiments), estimated by real-time PCR. The sequential functional tests displayed that PX1 KD did not interfere with the isotonic ATP baseline (n=64, P>0.05) compared with that of the mock cells. The inhibition of HEP at 1 mM to hypotonically-induced ATP release was enhanced from 47 ± 2% to 67 ± 4% (n=48, P<0.001) after PX1 KD, in contrast to its compromised efficacy after PX1 overexpression.
We extended the PX1-KD work to TM5 cells by adopting the lentiviral-based shRNA system. In comparison to the traditional transfection method, lentiviral transduction greatly promoted both the efficiency as well as cell viability following treatment. In combination with puromycin selection, the expression of PX1 hemichannels was not only substantially reduced, but also stably maintained at low levels over a two-month period, indicated by the reduction of PX1 mRNA by 71 ± 4% (N=12) (Fig. 6A) and protein by 39 ± 6% (N=8) (Figs. 6A, 6B). Successful knockdown of PX1 did not change the isotonic bath ATP level (n=489, P>0.05), but significantly decreased hypotonicity-stimulated ATP release by 31 ± 2% (n=321, P<0.001) in comparison to mock controls. In addition, PX1 KD altered pharmacological profiles of ATP release, shifting the inhibitory efficacies of PRO (0.1 mM), HEP (1 mM), and KN-62 (1 μM) from 42 ± 2% (N=246), 39 ± 3% (n=61), and 33 ± 3% (n=120) in mock control TM5 cells, to 12 ± 2% (n=377), 63 ± 2% (n=160), and 44 ± 3% (n=120), respectively, in PX1-KD TM5 cells (Fig. 7). The reduced efficacy of PRO and enhanced efficacies of HEP and KN-62 produced by PX1 KD support the idea that PX1 provides a P2RX7-independent conduit, in parallel with Cx hemichannels and a P2RX7-mediated pathway, for swelling-activated ATP release.
Fig. 6. PX1 knock-down (KD) in TM5 cells by lentivirus-mediated RNA interference.

The successful KD of PX1 mRNA and protein in TM5 cells was verified by real-time PCR (A) and semi-quantitative immunoblotting (B), respectively. The stable PX1 KD in the TM5 cell line lasted over 2 months after transduction (A). N refers to numbers of independent experiments performed. *P< 0.01 compared with mock controls (MC) by Student’s t-test.
Fig. 7. Alteration of pharmacologic profile of ATP release from TM5 cells after PX1 knockdown (KD).

The decrease of the inhibitory effect of PRO after Px1 KD indicated the involvement of PX1, consistent with the accordingly enhanced efficacies of HEP and KN-62. In contrast, KN-62 abolished ionomycin-induced ATP release in both mock control (MC) and KD, suggesting that PX1-independent P2RX7 predominated in the Ca2+ triggered release. Numbers along the abscissa are numbers of wells measured. *P<0.01 compared with MC controls by Student’s t-test.
Mechanism underlying ionomycin-induced ATP release by TM5 and HTM cells
Increasing intracellular calcium ([Ca2+]in) activity with 10 μM ionomycin triggered ATP release from both TM5 and HTM cells to an even greater extent than hypotonicity (P<0.001). At a [Ca2+]ex of 0.1 mM, ionomycin raised ATP concentrations in isotonic bath by 11.5 ± 0.3-fold (TM5, n=913), and 21.5 ± 1.5-fold (HTM, n=64). Unlike the time course of ATP release induced by hypotonicity, ionomycin-elicited ATP release had a much delayed half-peak time (τ=74.9 ± 0.7 min, P<0.001) in TM5 cells, even though a large increase in [Ca2+]in appeared almost instantaneously after the application (Data not shown).
LDH release after ionomycin treatment was not significantly changed (n=32, P=0.135) (Suppl. Fig. 1). The index of the cell metabolic state estimated by the MTT assay, gave some suggestion of reduced cell viability (Suppl. Fig. 1), but the reduction from 100 ± 1% (n=94) to 97 ± 1% was not statistically significant (n=54, P=0.062).
The drugs most efficacious in reducing hypotonically-evoked ATP release by TM5 cells had no effect on ionomycin-activated ATP release (Suppl. Fig. 2). Those drugs included: PRO (0.1 mM), MFQ (30 nM), CBX (3 μM) and HEP (1 mM). Other chemicals, such as MON (100 μM), BAF (2 μM), Gd3+ (50 μM), SITS (100 μM) and LAC (1 μM), were ineffective, as well (Suppl. Fig. 2). The only inhibitors that blocked ionomycin-induced ATP release were P2RX7 antagonists (Suppl. Fig. 2). BBG inhibited the release by 81 ± 2% at 5 μM (n=54), with an IC50 of 1.91 ± 0.02 μM. The specific P2RX7 blocker A438079 reduced release by 68 ± 2% at 10 μM (n=54), with an IC50 =0.77 ± 0.01 μM. At 1 μM, KN-62 nearly abolished the release (96 ± 2%, n=276, P<0.001). The results of HTM cells were identical, with KN-62 inhibiting the release by 96 ± 1% (1 μM, n=48), and with PRO (0.1 mM), HEP (1 mM) and LAC (1 μM) displaying little effect (Fig. 3 and Suppl. Table 3).
Raising [Ca2+]in has been reported to activate PX1 hemichannels by some (Locovei et al., 2006), but not by all investigators (Ma et al., 2009). In the present study, ATP release induced by the elevated [Ca2+]in was not blocked by PX1 inhibitors. Similarly, the Cx inhibitor HEP exerted no inhibition. Notably, KN-62 abolished ionomycin-triggered ATP release in both PX1-KD (98.4 ± 0.4%, n=120) and mock TM5 cells (99.8 ± 0.6%, n=80), strongly pointing to a release mechanism distinct from PX1. Elevating the [Ca2+]ex to 2.5 mM, further raised release 148 ± 9-fold (n=80) and reduced both τ (23.1 ± 0.7 min) and the efficacies of KN-62 (3 μM, 90 ± 2%, n=32) and BBG (5 μM, 61 ± 1%, n=24) in blocking ATP release. As at the lower [Ca2+]ex, only P2RX7 inhibitors blocked ionomycin-induced ATP release. No significant effect was noted on that release by: PRO (0.1 mM), HEP (1 mM), or LAC (3 μM) (Suppl. Table 3).
Correspondingly, viability of TM5 cells fell from 100.0 ± 0.1% (n=32) to 69.3 ± 0.1% (n=32) in isotonic solution after ionomycin application in the presence of 2.5 mM external Ca2+ (Suppl. Fig. 1). The MTT index of cell metabolism indicated an even greater deterioration of the cells (Suppl. Fig. 1), with a calculated viability of only 7.1 ± 0.2% (n=64). These data support the possibility that the P2RX7-dependent ATP release triggered by ionomycin might reflect apoptotic magnification of ATP release through membrane compromised by high cytosolic calcium.
DISCUSSION
The initial step in purinergic regulation of aqueous humor dynamics is the cellular release of ATP. We previously noted that human TM cells release ATP in response to anisosmotic swelling (Fleischhauer et al., 2003), but the release mechanisms were unknown and pannexins had not yet been cloned (Baranova et al., 2004). The present results indicate that PX1, connexins and P2RX7 all participate in swelling-activated ATP release by TM cells. The great bulk of the measurements was conducted with TM5 cells, but the pharmacologic profile of ATP release was identical with that of native, human explant-derived HTM cells (Fig. 3).
Estimation of relative contributions of ATP-release pathways
The pharmacologic results permit an approximate estimation of the relative contributions of PX1, Cxs and P2RX7 to swelling-activated ATP release. PX1 likely underlies ~40% since the relatively selective inhibitor probenecid (Silverman et al., 2008) reduced release by 37 ± 2%. This estimate is consistent with the inhibition of 31 ± 2% produced by partial knockdown of PX1 in TM5 cells. The relatively selective Cx blocker HEP (Ma et al., 2009) produced a comparable inhibition of swelling-activated ATP release (44 ± 4%). Blocking PX1 and Cx hemichannels simultaneously with CBX and heptanol, respectively, produced an additive inhibition of 80 ± 5%. Quantifying the role of P2RX7 receptors was more problematic. Applying the P2RX7 blocker KN-62 together with CBX and HEP further raised the inhibition to 96 ± 1%, which might suggest that P2RX7 mediates ~16% of the ATP release. However, separate application of each of three different P2RX7 blockers (KN-62, BBG or A438079) produced twice as great inhibitions (of ~30%) when PX1 and Cx hemichannels were not blocked. Evidently, the contribution of P2RX7 depended on the unrestricted activity of hemichannels. At least two possible mechanisms are plausible. First, P2RX7 has been reported to trigger activation of both PX1-mediated and PX1-independent large-bore channels (Pelegrin and Surprenant, 2007). Whether the large-bore conduit associated with P2RX7 is intrinsic to the receptor (Yan et al., 2008) or reflects the associated PX1 hemichannel (Pelegrin and Surprenant, 2006) (Locovei et al., 2007) has been controversial (Khakh and North, 2006). In principle, the reduced P2RX7 contribution noted when PX1 was blocked might arise from ATP permeation through the receptor itself, whereas the higher P2RX7 contribution could reflect ATP release through P2RX7-modulated PX1 hemichannels in parallel with P2RX7. Second, the larger P2RX7 contribution could also reflect sustained activation of the receptor by ATP released from the PX1 and Cx hemichannels, leading to caspase-mediated apoptosis (Virginio et al., 1999) and ATP release. The high viability and unimpaired mitochondrial function indicated by the LDH and MTT assays argue against the latter interpretation, but a very small undetected portion of apoptotic cells (<1%) could account for the P2RX7-inhibitable, PX1-dependent fraction of the swelling-activated ATP released. The two interpretations are not mutually exclusive.
Molecular verification of release pathways
We verified that the hemichannels and P2RX7 are expressed in the HTM and TM5 cells. PX1, Cx26, Cx31, Cx43, P2RX7, and CFTR were identified by RT-PCR. Real-time PCR of TM5-cell RNA indicated that PX1 and Cx43 were approximately equally expressed and that P2RX7 was expressed 100-fold less. The gene expressions were similar in HTM cells, except for the approximately 10-fold higher expression of Cx43. Connexins have been previously identified in trabecular meshwork (Kimura et al., 2000; Paper et al., 2008; Zhuo et al., 2010), but not pannexins or P2RX7.
The functional significance of the recently discovered PX1 (Panchin et al., 2000) in releasing ATP was assayed in two ways. Given the resistance of TM5 and HTM cells to overexpression, we overexpressed HEK293T cells with PX1. As anticipated, overexpression of PX1 increased probenecid-inhibitable, swelling-activated ATP release. Correspondingly, stable partial knockdown of PX1 with lentiviral transduction of shRNA reduced the probenecid-inhibitable swelling-activated ATP release. The effects of overexpression and KD support the functional significance of PX1 in ATP release by human TM cells.
Physiologic regulation
At least five modulators are known to stimulate ATP release and activate hemichannels in other cells. First, anisosmotic cell swelling is a commonly-used experimental approach we have exploited in triggering ATP release by TM (Fleischhauer et al., 2003) and other cells (Mitchell et al., 1998), and cell swelling may be an important regulator of release in some cells (Li et al., 2010). Second, hypoxia and hypercapnia have been reported to increase ATP release (Bergfeld and Forrester, 1992) and ischemia increases Cx36 and Cx43 hemichannel activity (Orellana et al., 2009), possibly through generation of reactive oxygen species (Wheaton and Chandel, 2010). Conversely, the reducing agent dithiothreitol partially inhibits PX1 (Bunse et al., 2009) and reduced ATP release by TM cells in the present study. Third, increased intracellular Ca2+ activity has been found to activate PX1 channels in heterologously expressed frog oocytes (Locovei et al., 2006), but not when expressed in mammalian cells (Ma et al., 2009). The documented PX1 activation appeared well within seconds after applying micromolar concentrations of intracellular Ca2+ to inside-out patches (Locovei et al., 2006). In contrast, the current data indicate that intracellular Ca2+ does not regulate PX1 in TM cells. Application of ionomycin did increase ATP release, but only after a lag time, and the increased release could not be blocked by the PX1 inhibitor probenecid. Fourth, growth factors have recently been implicated. Basic fibroblast growth factor (FGF-2) stimulates Cx hemichannels (De Vuyst et al., 2007) and acidic fibroblast growth factor (FGF-1) enhances both PX1 and Cx hemichannel activity (Garré et al., 2010). Fifth, both connexins (Bao et al., 2004b) and pannexins (Bao et al., 2004a) are mechanosensitive. Mechanical perturbation may be particularly relevant to TM cells since the intraocular pressure undergoes pulsations of 2.4 ± 0.7 mm Hg in normal human subjects in synchrony with the cardiac cycle (Evans et al., 2002), which can thereby displace and stretch the outflow pathway. Cyclic mechanical stress of human TM cells also increases genetic expression of MMP-3 (Luna et al., 2009).
Downstream cascade triggered by ATP release
Once released, ATP can be metabolized by ecto-ATPases to adenosine, which can then activate A1 ARs. In human TM cells, agonist occupancy triggers the following sequential cascade of activations: Gi/o, phospholipase C, protein kinase Cα, c-Raf kinase, mitogen-activated protein kinase kinase, extracellular signal-regulated kinase (ERK1/2), and finally secretion of matrix metalloproteinase (MMP-2) (Husain et al., 2007). The regulatory role of MMP-2 may well be dependent on the integrated action of different, neighboring cell types. Cells of the juxtacanalicular tissue (JCT) tether cells of the inner wall of Schlemm’s canal through both cytoplasmic connections (Johnstone, 1979) and matrix interactions (Gong et al., 1996). MMPs are expected to interrupt the matrix interactions, leading to physical separation of the JCT and inner-wall SC cells. Such separation leads to displacement of the SC cells, and can permit the inner SC wall to collapse against the outer wall. However, even when luminal obstruction is observed in some local regions (Lu et al., 2008), separation of JCT and inner-wall SC cells reduces the resistance to aqueous humor outflow (Lu et al., 2008; Overby et al., 2002; Scott et al., 2007). The effect of separating JCT from the inner-wall SC cells has been interpreted in terms of the funneling hypothesis. This hypothesis ascribes outflow resistance largely to hydrodynamic constraints on aqueous flow through the JCT in order to leave through pores between and through the inner-wall SC cells (Johnson et al., 1992). Separation of JCT from Schlemm’s canal inner wall may relieve these constraints, reducing outflow resistance.
Future possibilities
ATP-derived adenosine delivery to the inflow pathway, the ciliary epithelium, and to the trabecular outflow pathway can exert opposing effects on intraocular pressure. Adenosine stimulates A3AR-mediated increase of Cl− and fluid inflow of aqueous humor, and thereby increases intraocular pressure. As discussed above, adenosine binds to A1ARs of the trabecular meshwork to reduce outflow resistance, and thereby reduce intraocular pressure. The initial step in these purinergic effects is the cellular release of ATP. The present results indicate that the ATP release from TM cells is through PX1-, Cx- and P2RX7-mediated mechanisms, but not through vesicular release. In contrast, ciliary epithelial cells release ATP through PX1- and Cx-mediated mechanisms together with vesicular release, but not through P2RX7-mediated mechanisms. This suggests that applying blockers of vesicular ATP release to the eye might reduce adenosine-dependent inflow without affecting adenosine-dependent reduction in outflow resistance. This novel strategy for reducing intraocular pressure is now under study.
Supplementary Material
Acknowledgments
Contract grant sponsor:
National Institute of Health of United States of America
Contract grant numbers:
EY13624 (to M.M. Civan), EY17007 (to W.D. Stamer), EY15537 (to C.H. Mitchell), and a Core Grant EY01583 (to the Univ. of Pennsylvania).
Supported by NIH Research Grants EY13624 (to M.M. Civan), EY17007 (to W.D. Stamer), EY15537 (to C.H. Mitchell), and a Core Grant EY01583 to the University of Pennsylvania. We thank Dr. Iok-hou Pang and Alcon Laboratories Inc. for generously providing the TM5 cell line, Dr. Yuanquan Song for suggestions on molecular cloning, Wulan Deng for lentiviral transduction assistance, and Yuting Zhao for gel documentation.
LITERATURE CITED
- Aga M, Bradley JM, Keller KE, Kelley MJ, Acott TS. Specialized podosome- or invadopodia-like structures (PILS) for focal trabecular meshwork extracellular matrix turnover. Invest Ophthalmol Vis Sci. 2008;49(12):5353–5365. doi: 10.1167/iovs.07-1666. [DOI] [PMC free article] [PubMed] [Google Scholar]
- Al-Aswad LA, Gong H, Lee D, O’Donnell ME, Brandt JD, Ryan WJ, Schroeder A, Erickson KA. Effects of Na-K-2Cl cotransport regulators on outflow facility in calf and human eyes in vitro. Invest Ophthalmol Vis Sci. 1999;40(8):1695–1701. [PubMed] [Google Scholar]
- Avila MY, Stone RA, Civan MM. A(1)-, A(2A)- and A(3)-subtype adenosine receptors modulate intraocular pressure in the mouse. Br J Pharmacol. 2001;134(2):241–245. doi: 10.1038/sj.bjp.0704267. [DOI] [PMC free article] [PubMed] [Google Scholar]
- Bao L, Locovei S, Dahl G. Pannexin membrane channels are mechanosensitive conduits for ATP. FEBS Lett. 2004a;572(1–3):65–68. doi: 10.1016/j.febslet.2004.07.009. [DOI] [PubMed] [Google Scholar]
- Bao L, Sachs F, Dahl G. Connexins are mechanosensitive. Am J Physiol Cell Physiol. 2004b;287(5):C1389–1395. doi: 10.1152/ajpcell.00220.2004. [DOI] [PubMed] [Google Scholar]
- Baranova A, Ivanov D, Petrash N, Pestova A, Skoblov M, Kelmanson I, Shagin D, Nazarenko S, Geraymovych E, Litvin O, Tiunova A, Born TL, Usman N, Staroverov D, Lukyanov S, Panchin Y. The mammalian pannexin family is homologous to the invertebrate innexin gap junction proteins. Genomics. 2004;83(4):706–716. doi: 10.1016/j.ygeno.2003.09.025. [DOI] [PubMed] [Google Scholar]
- Bergfeld GR, Forrester T. Release of ATP from human erythrocytes in response to a brief period of hypoxia and hypercapnia. Cardiovasc Res. 1992;26(1):40–47. doi: 10.1093/cvr/26.1.40. [DOI] [PubMed] [Google Scholar]
- Bruzzone R, Barbe MT, Jakob NJ, Monyer H. Pharmacological properties of homomeric and heteromeric pannexin hemichannels expressed in Xenopus oocytes. J Neurochem. 2005;92(5):1033–1043. doi: 10.1111/j.1471-4159.2004.02947.x. [DOI] [PubMed] [Google Scholar]
- Bunse S, Locovei S, Schmidt M, Qiu F, Zoidl G, Dahl G, Dermietzel R. The potassium channel subunit Kvb3 interacts with pannexin 1 and attenuates its sensitivity to changes in redox potentials. Febs J. 2009;276:6258–6270. doi: 10.1111/j.1742-4658.2009.07334.x. [DOI] [PubMed] [Google Scholar]
- Chow J, Liton PB, Luna C, Wong F, Gonzalez P. Effect of cellular senescence on the P2Y-receptor mediated calcium response in trabecular meshwork cells. Mol Vis. 2007;13:1926–1933. [PMC free article] [PubMed] [Google Scholar]
- Collaborative Normal-Tension Glaucoma Study Group. Comparison of glaucomatous progression between untreated patients with normal-tension glaucoma and patients with therapeutically reduced intraocular pressures. Am J Ophthalmol. 1998a;126(4):487–497. doi: 10.1016/s0002-9394(98)00223-2. [DOI] [PubMed] [Google Scholar]
- Collaborative Normal-Tension Glaucoma Study Group. The effectiveness of intraocular pressure reduction in the treatment of normal-tension glaucoma. Am J Ophthalmol. 1998b;126(4):498–505. doi: 10.1016/s0002-9394(98)00272-4. [DOI] [PubMed] [Google Scholar]
- Crosson CE. Ocular hypotensive activity of the adenosine agonist (R)-phenylisopropyladenosine in rabbits. Curr Eye Res. 1992;11(5):453–458. doi: 10.3109/02713689209001799. [DOI] [PubMed] [Google Scholar]
- Crosson CE. Adenosine receptor activation modulates intraocular pressure in rabbits. J Pharmacol Exp Ther. 1995;273(1):320–326. [PubMed] [Google Scholar]
- Crosson CE. Intraocular pressure responses to the adenosine agonist cyclohexyladenosine: evidence for a dual mechanism of action. Invest Ophthalmol Vis Sci. 2001;42(8):1837–1840. [PubMed] [Google Scholar]
- Crosson CE, Gray T. Characterization of ocular hypertension induced by adenosine agonists. Invest Ophthalmol Vis Sci. 1996;37(9):1833–1839. [PubMed] [Google Scholar]
- Crosson CE, Kent AR, Daines B, MSM Elevated adenosine levels in the aqueous humor of ocular hypertensive individuals. Invest Ophthalmol Vis Sci. 2000;41(4):S576. (Abstr #3061) [Google Scholar]
- Crosson CE, Sloan CF, Yates PW. Modulation of conventional outflow facility by the adenosine A1 agonist N6-cyclohexyladenosine. Invest Ophthalmol Vis Sci. 2005;46(10):3795–3799. doi: 10.1167/iovs.05-0421. [DOI] [PubMed] [Google Scholar]
- Crosson CE, Yates PW, Bhat AN, Mukhin YV, Husain S. Evidence for multiple P2Y receptors in trabecular meshwork cells. J Pharmacol Exp Ther. 2004;309(2):484–489. doi: 10.1124/jpet.103.060319. [DOI] [PubMed] [Google Scholar]
- De Vuyst E, Decrock E, De Bock M, Yamasaki H, Naus CC, Evans WH, Leybaert L. Connexin hemichannels and gap junction channels are differentially influenced by lipopolysaccharide and basic fibroblast growth factor. Mol Biol Cell. 2007;18(1):34–46. doi: 10.1091/mbc.E06-03-0182. [DOI] [PMC free article] [PubMed] [Google Scholar]
- Ebihara L, Liu X, Pal JD. Effect of external magnesium and calcium on human connexin46 hemichannels. Biophys J. 2003;84(1):277–286. doi: 10.1016/S0006-3495(03)74848-6. [DOI] [PMC free article] [PubMed] [Google Scholar]
- Eskandari S, Zampighi GA, Leung DW, Wright EM, Loo DD. Inhibition of gap junction hemichannels by chloride channel blockers. J Membr Biol. 2002;185(2):93–102. doi: 10.1007/s00232-001-0115-0. [DOI] [PubMed] [Google Scholar]
- Ethier CR. The inner wall of Schlemm’s canal. Exp Eye Res. 2002;74(2):161–172. doi: 10.1006/exer.2002.1144. [DOI] [PubMed] [Google Scholar]
- Fleischhauer JC, Mitchell CH, Stamer WD, Karl MO, Peterson-Yantorno K, Civan MM. Common actions of adenosine receptor agonists in modulating human trabecular meshwork cell transport. J Membr Biol. 2003;193(2):121–136. doi: 10.1007/s00232-002-2013-5. [DOI] [PubMed] [Google Scholar]
- Freddo TF, Johnson M. Aqueous Humor Outflow Resistance. In: Civan MM, editor. The Eye’s Aqueous Humor. 2. San Diego: Elsevier; 2008. pp. 161–192. [Google Scholar]
- Garré JM, Retamal MA, Cassina P, Barbeito L, Bukauskas FF, Sáez JC, Bennett MV, Abudara V. FGF-1 induces ATP release from spinal astrocytes in culture and opens pannexin and connexin hemichannels. Proc Natl Acad Sci U S A. 2010;107(52):22659–22664. doi: 10.1073/pnas.1013793107. [DOI] [PMC free article] [PubMed] [Google Scholar]
- Gong H, Tripathi RC, Tripathi BJ. Morphology of the aqueous outflow pathway. Microsc Res Tech. 1996;33(4):336–367. doi: 10.1002/(SICI)1097-0029(19960301)33:4<336::AID-JEMT4>3.0.CO;2-N. [DOI] [PubMed] [Google Scholar]
- Gual A, Llobet A, Gilabert R, Borras M, Pales J, Bergamini MV, Belmonte C. Effects of time of storage, albumin, and osmolality changes on outflow facility (C) of bovine anterior segment in vitro. Invest Ophthalmol Vis Sci. 1997;38(10):2165–2171. [PubMed] [Google Scholar]
- Husain S, Shearer TW, Crosson CE. Mechanisms linking adenosine A1 receptors and extracellular signal-regulated kinase 1/2 activation in human trabecular meshwork cells. J Pharmacol Exp Ther. 2007;320(1):258–265. doi: 10.1124/jpet.106.110981. [DOI] [PubMed] [Google Scholar]
- Iglesias R, Spray DC, Scemes E. Mefloquine blockade of Pannexin1 currents: resolution of a conflict. Cell Commun Adhes. 2009;16(5–6):131–137. doi: 10.3109/15419061003642618. [DOI] [PMC free article] [PubMed] [Google Scholar]
- Johnson M, Erickson K. Mechanisms and routes of aqueous humor drainage. In: Albert DM, Jakobiec FA, editors. Principles and Practice of Ophthalmology. Philadelphia: WB Saunders; 2000. pp. 2577–2595. [Google Scholar]
- Johnson M, Shapiro A, Ethier CR, Kamm RD. Modulation of outflow resistance by the pores of the inner wall endothelium. Invest Ophthalmol Vis Sci. 1992;33(5):1670–1675. [PubMed] [Google Scholar]
- Johnstone MA. Pressure-dependent changes in nuclei and the process origins of the endothelial cells lining Schlemm’s canal. Invest Ophthalmol Vis Sci. 1979;18(1):44–51. [PubMed] [Google Scholar]
- Kass MA, Heuer DK, Higginbotham EJ, Johnson CA, Keltner JL, Miller JP, Parrish RK, 2nd, Wilson MR, Gordon MO. The Ocular Hypertension Treatment Study: a randomized trial determines that topical ocular hypotensive medication delays or prevents the onset of primary open-angle glaucoma. Arch Ophthalmol. 2002;120(6):701–713. doi: 10.1001/archopht.120.6.701. discussion 829–730. [DOI] [PubMed] [Google Scholar]
- Khakh BS, North RA. P2X receptors as cell-surface ATP sensors in health and disease. Nature. 2006;442(7102):527–532. doi: 10.1038/nature04886. [DOI] [PubMed] [Google Scholar]
- Kimura S, Suzuki K, Sagara T, Nishida T, Yamamoto T, Kitazawa Y. Regulation of connexin phosphorylation and cell-cell coupling in trabecular meshwork cells. Invest Ophthalmol Vis Sci. 2000;41(8):2222–2228. [PubMed] [Google Scholar]
- Krupin T, Civan MM. The physiologic basis of aqueous humor formation. In: Ritch R, Shields MB, Krupin T, editors. The Glaucomas. 2. St Louis: Mosby; 1996. pp. 251–280. [Google Scholar]
- Kumar J, Epstein DL. Rho-GTPase mediated cytoskeletal organization in schlemm’s canal cells play a critical role in the regulation of aqueous humor outflow facility. J Cell Biochem. 2010 doi: 10.1002/jcb.22950. [DOI] [PubMed] [Google Scholar]
- Lévesque SA, Lavoie EG, Lecka J, Bigonnesse F, Sévigny J. Specificity of the ecto-ATPase inhibitor ARL 67156 on human and mouse ectonucleotidases. Br J Pharmacol. 2007;152(1):141–150. doi: 10.1038/sj.bjp.0707361. [DOI] [PMC free article] [PubMed] [Google Scholar]
- Li A, Leung CT, Peterson-Yantorno K, Mitchell CH, Civan MM. Pathways for ATP release by bovine ciliary epithelial cells, the initial step in purinergic regulation of aqueous humor inflow. Am J Physiol Cell Physiol. 2010;299(6):C1308–1317. doi: 10.1152/ajpcell.00333.2010. [DOI] [PMC free article] [PubMed] [Google Scholar]
- Locovei S, Scemes E, Qiu F, Spray DC, Dahl G. Pannexin1 is part of the pore forming unit of the P2X(7) receptor death complex. FEBS Lett. 2007;581(3):483–488. doi: 10.1016/j.febslet.2006.12.056. [DOI] [PMC free article] [PubMed] [Google Scholar]
- Locovei S, Wang J, Dahl G. Activation of pannexin 1 channels by ATP through P2Y receptors and by cytoplasmic calcium. FEBS Lett. 2006;580(1):239–244. doi: 10.1016/j.febslet.2005.12.004. [DOI] [PubMed] [Google Scholar]
- Lu Z, Overby DR, Scott PA, Freddo TF, Gong H. The mechanism of increasing outflow facility by rho-kinase inhibition with Y-27632 in bovine eyes. Exp Eye Res. 2008;86(2):271–281. doi: 10.1016/j.exer.2007.10.018. [DOI] [PMC free article] [PubMed] [Google Scholar]
- Luna C, Li G, Qiu J, Challa P, Epstein DL, Gonzalez P. Extracellular release of ATP mediated by cyclic mechanical stress leads to mobilization of AA in trabecular meshwork cells. Invest Ophthalmol Vis Sci. 2009;50(12):5805–5810. doi: 10.1167/iovs.09-3796. [DOI] [PMC free article] [PubMed] [Google Scholar]
- Lütjen-Drecoll E, Rohen JW. Morphology of aqueous outflow pathways in normal and glaucomatous eyes. In: Ritch R, Shields MB, Krupin T, editors. The Glaucomas. 2. St. Louis: Mosby; 1996. pp. 89–123. [Google Scholar]
- Ma W, Hui H, Pelegrin P, Surprenant A. Pharmacological characterization of pannexin-1 currents expressed in mammalian cells. J Pharmacol Exp Ther. 2009;328(2):409–418. doi: 10.1124/jpet.108.146365. [DOI] [PMC free article] [PubMed] [Google Scholar]
- Mitchell CH, Carré DA, McGlinn AM, Stone RA, Civan MM. A release mechanism for stored ATP in ocular ciliary epithelial cells. Proc Natl Acad Sci U S A. 1998;95(12):7174–7178. doi: 10.1073/pnas.95.12.7174. [DOI] [PMC free article] [PubMed] [Google Scholar]
- Orellana JA, Saez PJ, Shoji KF, Schalper KA, Palacios-Prado N, Velarde V, Giaume C, Bennett MV, Saez JC. Modulation of brain hemichannels and gap junction channels by pro-inflammatory agents and their possible role in neurodegeneration. Antioxid Redox Signal. 2009;11(2):369–399. doi: 10.1089/ars.2008.2130. [DOI] [PMC free article] [PubMed] [Google Scholar]
- Overby D, Gong H, Qiu G, Freddo TF, Johnson M. The mechanism of increasing outflow facility during washout in the bovine eye. Invest Ophthalmol Vis Sci. 2002;43(11):3455–3464. [PubMed] [Google Scholar]
- Panchin Y, Kelmanson I, Matz M, Lukyanov K, Usman N, Lukyanov S. A ubiquitous family of putative gap junction molecules. Curr Biol. 2000;10(13):R473–474. doi: 10.1016/s0960-9822(00)00576-5. [DOI] [PubMed] [Google Scholar]
- Pang IH, Shade DL, Clark AF, Steely HT, DeSantis L. Preliminary characterization of a transformed cell strain derived from human trabecular meshwork. Curr Eye Res. 1994;13(1):51–63. doi: 10.3109/02713689409042398. [DOI] [PubMed] [Google Scholar]
- Paper W, Kroeber M, Heersink S, Stephan DA, Fuchshofer R, Russell P, Tamm ER. Elevated amounts of myocilin in the aqueous humor of transgenic mice cause significant changes in ocular gene expression. Exp Eye Res. 2008;87(3):257–267. doi: 10.1016/j.exer.2008.06.006. [DOI] [PMC free article] [PubMed] [Google Scholar]
- Pedrigi RM, Simon D, Reed A, Stamer WD, Overby DR. A model of giant vacuole dynamics in human Schlemm’s canal endothelial cells. Exp Eye Res. 2010 doi: 10.1016/j.exer.2010.11.003. [DOI] [PMC free article] [PubMed] [Google Scholar]
- Pelegrin P, Surprenant A. Pannexin-1 mediates large pore formation and interleukin-1β release by the ATP-gated P2X7 receptor. Embo J. 2006;25(21):5071–5082. doi: 10.1038/sj.emboj.7601378. [DOI] [PMC free article] [PubMed] [Google Scholar]
- Pelegrin P, Surprenant A. Pannexin-1 couples to maitotoxin- and nigericin-induced interleukin-1beta release through a dye uptake-independent pathway. J Biol Chem. 2007;282(4):2386–2394. doi: 10.1074/jbc.M610351200. [DOI] [PubMed] [Google Scholar]
- Raviola G, Raviola E. Paracellular route of aqueous outflow in the trabecular meshwork and canal of Schlemm. A freeze-fracture study of the endothelial junctions in the sclerocorneal angel of the macaque monkey eye. Invest Ophthalmol Vis Sci. 1981;21(1 Pt 1):52–72. [PubMed] [Google Scholar]
- Rohen JW. Experimental studies on the trabecular meshwork in primates. Arch Ophthalmol. 1963;69:91–105. doi: 10.1001/archopht.1963.00960040341016. [DOI] [PubMed] [Google Scholar]
- Scott PA, Overby DR, Freddo TF, Gong H. Comparative studies between species that do and do not exhibit the washout effect. Exp Eye Res. 2007;84(3):435–443. doi: 10.1016/j.exer.2006.10.015. [DOI] [PMC free article] [PubMed] [Google Scholar]
- Shearer TW, Crosson CE. Adenosine A1 receptor modulation of MMP-2 secretion by trabecular meshwork cells. Invest Ophthalmol Vis Sci. 2002;43(9):3016–3020. [PubMed] [Google Scholar]
- Silverman W, Locovei S, Dahl G. Probenecid, a gout remedy, inhibits pannexin 1 channels. Am J Physiol Cell Physiol. 2008;295(3):C761–767. doi: 10.1152/ajpcell.00227.2008. [DOI] [PMC free article] [PubMed] [Google Scholar]
- Stamer WD, Seftor RE, Williams SK, Samaha HA, Snyder RW. Isolation and culture of human trabecular meshwork cells by extracellular matrix digestion. Curr Eye Res. 1995;14(7):611–617. doi: 10.3109/02713689508998409. [DOI] [PubMed] [Google Scholar]
- Tamm ER. The trabecular meshwork outflow pathways: structural and functional aspects. Exp Eye Res. 2009;88(4):648–655. doi: 10.1016/j.exer.2009.02.007. [DOI] [PubMed] [Google Scholar]
- The AGIS investigators. The Advanced Glaucoma Intervention Study (AGIS): 7. The relationship between control of intraocular pressure and visual field deterioration. Am J Ophthalmol. 2000;130(4):429–440. doi: 10.1016/s0002-9394(00)00538-9. [DOI] [PubMed] [Google Scholar]
- Tian B, Gabelt BT, Crosson CE, Kaufman PL. Effects of adenosine agonists on intraocular pressure and aqueous humor dynamics in cynomolgus monkeys. Exp Eye Res. 1997;64(6):979–989. doi: 10.1006/exer.1997.0296. [DOI] [PubMed] [Google Scholar]
- Tripathi RC. Clinical implications of aqueous humor growth factors in glaucoma. In: Ritch R, Shields MB, Krupin T, editors. The Glaucomas. 2. St. Louis: Mosby; 1996. pp. 71–87. [Google Scholar]
- Virginio C, MacKenzie A, North RA, Surprenant A. Kinetics of cell lysis, dye uptake and permeability changes in cells expressing the rat P2X7 receptor. J Physiol. 1999;519(Pt 2):335–346. doi: 10.1111/j.1469-7793.1999.0335m.x. [DOI] [PMC free article] [PubMed] [Google Scholar]
- Wheaton WW, Chandel NS. Hypoxia regulates Cell Metabolism. Am J Physiol Cell Physiol. 2010 doi: 10.1152/ajpcell.00485.02010. (In Press) [DOI] [PMC free article] [PubMed] [Google Scholar]
- Yan Z, Li S, Liang Z, Tomic M, Stojilkovic SS. The P2X7 Receptor Channel Pore Dilates under Physiological Ion Conditions. J Gen Physiol. 2008;132(5):563–573. doi: 10.1085/jgp.200810059. [DOI] [PMC free article] [PubMed] [Google Scholar]
- Yegutkin GG. Nucleotide- and nucleoside-converting ectoenzymes: Important modulators of purinergic signalling cascade. Biochim Biophys Acta. 2008;1783(5):673–694. doi: 10.1016/j.bbamcr.2008.01.024. [DOI] [PubMed] [Google Scholar]
- Zhuo YH, He Y, Leung KW, Hou F, Li YQ, Chai F, Ge J. Dexamethasone disrupts intercellular junction formation and cytoskeleton organization in human trabecular meshwork cells. Mol Vis. 2010;16:61–71. [PMC free article] [PubMed] [Google Scholar]
- Zimmermann H. Extracellular metabolism of ATP and other nucleotides. Naunyn Schmiedebergs Arch Pharmacol. 2000;362(4–5):299–309. doi: 10.1007/s002100000309. [DOI] [PubMed] [Google Scholar]
Associated Data
This section collects any data citations, data availability statements, or supplementary materials included in this article.