

Abstract
Background
Multiple lines of evidence suggest cardiovascular co-morbidities hasten the onset of Alzheimer’s disease (AD) or accelerate its course.
Methods
To evaluate the utility of cerebral vascular physical function/condition parameters as potential systemic indicators of AD, we employed transcranial Doppler (TCD) ultrasound to assess cerebral blood flow and vascular resistance of the 16 arterial segments comprising the circle of Willis and its major tributaries.
Results
Our study revealed decreased arterial mean flow velocity (MFV) and increased pulsatility index (PI) are associated with a clinical diagnosis of presumptive AD. Cerebral blood flow impairment revealed by these parameters reflects the global hemodynamic and structural consequences of a multifaceted disease process yielding diffuse congestive microvascular pathology, increased arterial rigidity, and decreased arterial compliance combined with putative age-associated cardiovascular output declines.
Conclusions
TCD evaluation offers direct physical confirmation of brain perfusion impairment and may ultimately provide a convenient, noninvasive means to assess the efficacy of medical interventions on cerebral blood flow or reveal incipient AD. In the near term, TCD-based direct assessments of brain perfusion may offer the prospect of preventing or mitigating AD simply by revealing patients who would benefit from interventions to improve circulatory system function.
Keywords: Alzheimer’s disease, transcranial Doppler ultrasonography, cerebral blood flow, brain hypoperfusion, mean flow velocity, pulsatility index
1. Introduction
The statistics of Alzheimer’s disease (AD) are alarming. Over 5.3 million individuals in the USA have AD and with the addition of a new case every 70 seconds, 16 million cases are projected by 2050 [1]. Worldwide, 35 million individuals have AD and it is anticipated that this number will double by the year 2030 (www.alz.co.uk). Delaying the mean age of AD onset by one year would result in an estimated 9 million fewer cases of AD [1]. Preventing or slowing the progression of AD will bring enormous benefits to those older than 65 years of age, the most rapidly growing group of our population [2].
During the last 100 years, unprecedented progress in the medical sciences, nutrition and hygiene have permitted a thirty-year increase in average life expectancy. Reducing the toll of infectious diseases and malnutrition had the unforeseen consequence of creating conditions conducive to the physical and functional decay naturally associated with aging, such as AD and cardiovascular disease. In 1900, the average life expectancy was about 50 years of age and cardiovascular disease was responsible for about 10% of deaths in the USA [3]. By the year 2006, life expectancy increased to about 80 years of age and the fraction of deaths attributed to cardiovascular disease increased to over 50% [3]. Experimental and clinical evidence strongly suggests that age-associated co-morbidities interact to produce synergistic pathologic cascades. In a significant number of AD cases, a strong pathogenic cardiovascular component may hasten the onset of AD or aggravate the course of this dementia. Longevity per se leads inevitably to mounting physical wear and tear in the entirety of the cardiovascular system. The net effect of longevity coupled with unhealthy dietary regimes and increasingly sedentary lifestyles has been known to create populations with increased incidence of cardiovascular disease and sharply elevated risk for development of consequent debilitating comorbidities such as AD. In view of the recently recognized association between AD, brain hypoperfusion [4] and atherosclerosis [5-9], interventions including medications and lifestyle modification emphasizing regular physical exercise and healthy diets will decrease not only cardiovascular pathology, but also ensure that millions of individuals escape the ravages of AD.
Elucidating the pathogenesis of sporadic AD has remained an elusive goal despite decades of intensive research. Clearly, sporadic AD is an emergent pathology that results from the dynamic interplay of multiple genetic and environmental factors amidst a background of senescence-related changes. The dominance of the amyloid cascade hypothesis has almost preempted consideration of other possible AD pathogenetic mechanisms such as an age- and/or pathology-related perfusion failure. An inefficient blood supply to the brain, either acute or chronic, has very grave consequences to brain function and to the survival of the affected person. Hence, vascular disease, in addition to age-related hemorheologic decline, undoubtedly impacts AD pathogenesis and development in some individuals. A large body of evidence unambiguously establishes that the cerebral arteries are often morphologically altered and dysfunctional in AD [10-13]. Based on this evidence, we hypothesize that in some cases of AD, chronic brain hypoperfusion resulting in hypoxia/ischemia plays a prime pathogenic and/or synergistic role in the pathogenesis and pathophysiology of this dementia. Chronic hypoperfusion impairs the efficient delivery of oxygen and nutrients to the brain, disturbs energy metabolism, breaches the integrity of the blood-brain barrier (BBB), permits the invasion and accumulation of noxious substrates and compromises venous return. It could also indirectly promote edema, dilation of the periarterial spaces and retention of interstitial fluid, possibly producing the white matter rarefaction observed in many AD cases [14]. In previous studies, Roher et al. [5;6;9] discovered that in neuropathologically confirmed AD subjects, the number and severity of atherosclerotic stenoses of the cerebral arteries is far greater than in age-matched non-demented control (NDC) individuals. This appraisal was performed by rigorous electronic measurement of the index of occlusion on a large number of cross-sectioned arterial segments of the circle of Willis. These observations provide strong evidence for an association between impaired cerebral blood flow and AD.
With advancing age, lipid and mineral deposition constrict arterial lumina while changes in the amount and composition of the extracellular matrix and calcification will simultaneously increase vascular rigidity and resistance. These alterations steadily diminish the compliance of the circle of Willis and major leptomeningeal arteries and compromise brain perfusion. It is disquieting that in spite of the evidence demonstrating risk factors such as hypertension, coronary artery disease, myocardial infarction, hypercholesterolemia, hyperhomocysteinemia, diabetes, smoking and obesity as concomitant risk factors for AD, little has been done to promote preventative and interventional targeting of the cardiovascular system co-morbidities in AD patients. Additional support for these observations is the presence of lacunar infarcts and strokes that worsen the clinical features of AD [15-17], further suggesting that deficiencies in cerebral blood flow are directly associated with neuronal and synaptic damage. In addition, in a large number of aging individuals, there is an increase in cerebral arterial, arteriolar and capillary resistance due to the deposition of fibrillar amyloid-β (Aβ) peptides in the vascular walls. This cerebrovascular amyloidosis reduces the luminal diameter and destroys the endothelial, pericytes and smooth muscle cells. These alterations affect the BBB, vascular contractility and vascular integrity, thereby resulting in stenosis as well as vascular fragility promoting cerebral hemorrhages and neuronal injury [11;18].
Transcranial Doppler (TCD) ultrasound is a noninvasive and inexpensive technology that has been used to appraise cerebral hemodynamics. In principle, TCD evaluations should be useful in providing physical confirmation of cognitive impairment, revealing patients at risk for AD development, or assessing the impact of medical interventions on cerebral blood flow. Decreased middle cerebral artery mean flow velocity (MFV), increased pulsatility index (PI) and decreased cerebrovascular reactivity have been reported in AD [19-23] as well as in subjects with an apolipoprotein E (ApoE) ε4 genotype [24]. Our initial studies using TCD ultrasonography have suggested that the risk for AD associated with severe intracranial AVD is similar in magnitude to that conferred by the presence of a single ApoE ε4 allele [25]. This technique has also been employed to differentiate multi-infarct dementia from AD [26;27] and to assess the efficacy of therapeutic agents on cerebral blood flow [28;29]. In some of these investigations, however, the number of patients was relatively small, only the middle cerebral artery or few of the intracranial arteries were insonated, or the age of the control patients was not matched to those with AD. Interestingly, long-term TCD monitoring has demonstrated that spontaneous cerebral microemboli occurred more frequently in AD and vascular dementia than in NDC individuals [30].
We explored the use of TCD ultrasound to appraise the hemodynamic and biophysical changes related to cerebral blood flow and vascular resistance of 16 arterial segments comprising the circle of Willis and its major arterial branches. The use of cerebral vascular physical function/condition parameters serve as potential systemic indicators of AD. The hemodynamic conditions in NDC, mild cognitive impairment (MCI) and AD patients and their relationships to cognitive decline and progression are examined.
2. Methods
2.1 Study Subjects
The present investigation was approved by Banner Sun Health Research Institutional Review Board and written consent was signed by all subjects or their legal designates. As shown in Table 1, 103 individuals were involved in the study: 50 NDC, 11 MCI and 42 AD. The mean age was 79 years (range: 64-90), 80 years (range: 79-86) and 80 years (range: 66-96) for NDC, MCI and AD cohorts, respectively. In the AD group, 38% of the subjects were female, while 64% were female in the NDC and 45% in the MCI group. The average Mini Mental State Examination (MMSE) scores of the three groups under investigation are in Table 1. Individuals diagnosed with possible/probable AD (NINDS-ADRDA criteria) were recruited from those who volunteered for our Banner Sun Health Research Institute Brain Donation Program (BSHRI-BDP). Subjects had at least a 6th grade education or a work history excluding intellectual disability. Subjects with a diagnosis of delirium (DSM-IV) were excluded as well as those unable to be assessed due to conditions such as blindness/deafness. Individuals with a history of alcoholism or other substance abuse or dependence (DSM-IV criteria) within the past 10 years were excluded. All subjects received a medical and family history questionnaire, a general physical examination, a neurological examination, and global cognition assessed by the MMSE. Individuals were excluded if they had symptomatic or severe brain-related neurological or psychiatric illness or if they had a clinical diagnosis of dementia with Lewy bodies, vascular dementia or stroke, frontotemporal dementia, progressive supranuclear palsy, hippocampal sclerosis and other non-AD dementias. Nine of the 11 MCI subjects included in this study were clinically diagnosed as amnestic MCI using the Petersen criteria [31]. All had subjective complaints of memory loss, objective impairment in memory (≥ 1.5 S.D. on neuropsychological test of memory (AVLT)) and were without significant functional decline. The remaining two MCI subjects had non-amnestic MCI.
Table 1.
Characteristics of NDC, MCI and AD Subjects
| Characteristic | NDC (n=50) |
MCI (n=11) |
AD (n=42) |
|---|---|---|---|
| Mean (SD) | |||
|
| |||
| Age (years) | 79 (6.4) | 80 (4.7) | 80 (6.5) |
| SBP (mm Hg) 1 | 133 (15.0) | 137 (15.8) | 126 (15.7) |
| DBP (mm Hg) 1 | 72 (9.7) | 75 (10.5) | 71 (11.9) |
| MMSE2 * | 29 (1.1) | 26 (1.9) | 19 (6.7) |
|
| |||
| Percentage | |||
|
| |||
| Female * | 64 | 45 | 38 |
| Smoker3 | 26 | 10 | 38 |
| Hypercholesterolemia2 | 47 | 45 | 38 |
| Hypertension2 | 55 | 82 | 57 |
| Hypertension treatment4 | 67 | 55 | 51 |
| History of MI2 | 6 | 18 | 10 |
| History of stroke2 | 8 | 0 | 12 |
| Stent or CABG | 8 | 18 | 17 |
| Coronary artery disease2 | 14 | 18 | 21 |
| Carotid artery disease2 | 4 | 0 | 5 |
| Peripheral vascular disease2 | 8 | 9 | 5 |
| Diabetes mellitus2 | 6 | 0 | 10 |
| Dysfunctions of rhythm or conduction2 | 22 | 18 | 24 |
p<.05
Sample size is 95 (n=47 NDC, 10 MCI, 38 AD)
Sample size is 102 (n=49 NDC, 11 MCI, 42 AD)
Sample size is 90 (n=46 NDC, 10 MCI, 34 AD)
Sample size is 100 (n=48 NDC, 11 MCI, 41 AD)
Abbreviations: NDC, non-demented controls; MCI, mild cognitive impairment; AD, Alzheimer’s disease; SBP, systolic blood pressure; DBP, diastolic blood pressure; MMSE, Mini Mental State Examination (range 0 to 30); MI, myocardial infarction; CABG, coronary bypass graft
Our NDC cases were defined as having no demonstrable cognitively based limitations of activities of daily living including, when applicable, employment. Rigorous criteria were used to exclude anyone with any type of symptomatic or severe brain-related neurological or psychiatric illnesses. This was done by prospective interview of the participant and careful scrutiny of medical records. Examples of excluded conditions included intellectual disabilities, epilepsy, cerebral infarction or hemorrhage, multiple sclerosis, brain tumor, major depressive disorder (unipolar or bipolar), schizophrenia, traumatic brain injury and substance abuse. To fulfill NDC criteria, the MMSE was greater than or equal to 28, the CDR = 0, the clock draw was 10/10, the FAST score was 2 or less, and neuropsychological assessment was all <1.5 SD for domains normed for age and education. All subjects in the study were assessed with a neurological evaluation and the MMSE before undergoing TCD examination. Arterial blood pressures were taken from the right and left arms immediately after the TCD study was completed.
2.2. Transcranial Doppler Ultrasonography
We employed the Nicolet Companion III (Viasys, Healthcare, Madison, WI) – a multi-channel/multi-frequency Doppler unit for analyzing transcranial spectral signals derived from systolic velocity, diastolic velocity, MFV in cm/sec, and pulsatility indices generated by intracranial arteries. The PI was calculated by subtracting the end-diastolic velocity from the peak systolic velocity, and then dividing by the MFV. The PI is therefore analogous to pulse pressure and is recognized as a measure of distal flow resistance and vascular wall rigidity. The complete TCD encompassed the insonation of 16 intracranial arterial segments as follows: left distal middle cerebral artery (LdMCA), left proximal middle cerebral artery (LpMCA), left anterior cerebral artery (LACA), left posterior cerebral artery (LPCA), left siphon (Lsiph), left internal carotid artery (LICA), left vertebral artery (LVA), proximal basilar artery (pBA), distal basilar artery (dBA), right distal middle cerebral artery (RdMCA), right proximal middle cerebral artery (RpMCA), right anterior cerebral artery (RACA), right posterior cerebral artery (RPCA), right siphon (Rsiph), right internal carotid artery (RICA) and right vertebral artery (RVA). The carotid siphon refers to the sinuous course of the cavernous and supraclinoid segments of the internal carotid artery. Further technical details regarding the anatomical windows and insonation distances in mm per each of the above listed arteries are given in detail elsewhere [25].
2.3. Statistical Analysis
The association of cognitive status groups with subject characteristics and arterial PI and MFV was assessed using Fisher’s exact chi-square tests and Welch’s variance-weighted ANOVA with Tukey-Kramer adjustment for comparison of means. A summary vascular function variable was derived for each artery based on MFV values below the median in conjunction with PI values above the median for each artery. The resultant measure of vascular function identified from 16% to 28% of subjects with compromised function across the 16 arterial segments. Multiple logistic regression models were used to examine sociodemographic and cardiovascular factors associated with this measure of impaired vascular function for each artery in addition to the association between this measure and AD. All regression models were adjusted for age and gender; standard lack of fit, and regression diagnostics (residual and collinearity tests) were assessed. Chi-square, ANOVA, and regression analyses were conducted with SAS software, version 9.1 (SAS Institute Inc., Cary, North Carolina).
Receiver-operator characteristic (ROC) curves provide a means of assessing the diagnostic potential of a particular test. A ROC curve is generated by plotting the percentage of known cases identified (sensitivity) against the reciprocal of the percentage of controls identified (specificity) for a given value of a diagnostic test. Once plotted, the area underneath the curve can be used to assess the diagnostic potential of the test. ROC curve areas of 1.0 distinguish cases from controls with total accuracy, while values lower than 1.0 have diminishing accuracy until an ROC curve area of 0.5 indicates the test results are no better than flipping a coin.
Data from TCD measurements for PI and MFV of the 16 insonated arterial segments were submitted to ROC curve analysis for two purposes. The first purpose was to identify which of the 16 insonated arterial segments better distinguish between AD and NDC subjects based on the calculated ROC areas for the MFV and PI values. The second goal was to determine the cutoff values for the PI or MFV measurements that best distinguished AD from NDC for insonated arteries with ROC areas closest to 1.0. Values obtained for AD and age-matched NDC cases were analyzed by the statistical and graphical software SigmaPlot 11 Systat Software Inc. (San Jose, CA).
3. Results
The general characteristics of the subjects under study are given in Table 1. These characteristics did not differ significantly across the three cognitive status groups, with the exception of gender and MMSE. The proportion of women was significantly higher in the NDC group than in either the MCI or AD groups; the MCI and AD groups did not differ significantly by gender. MMSE scores were significantly lower in AD subjects (mean = 19) than in either NDC (mean = 29) or MCI (mean = 26) groups, but did not differ significantly between NDC and MCI subjects.
Table 2 shows the difference in PI and MFV mean values for each insonated artery across the three cognitive status groups. The mean PI values were higher and the MFV lower in AD patients than in NDC subjects, with these differences frequently reaching statistical significance. In addition, the mean MFV for the left siphon artery was significantly lower in AD than in MCI patients. The pattern of results in Table 2 was largely the same when MCI cases were restricted to amnestic MCI (n=9) and AD cases restricted to probable AD (n=28), including NDC, for a total sample of 87. Significant differences across cognitive status subgroups disappeared for PI in pBA and for MFV in LPCA and Lsiph. New significant differences were noted for between NDC and MCI subjects for PI in RICA and for MFV in RVA as well as between MCI and AD patients in MFV for RpMCA.
Table 2.
PI and MFV of Insonated Arteries in NDC, MCI and AD Subjects
| Insonated Artery |
Sample Size (n) |
NDC Mean (SD) |
MCI Mean (SD) |
AD Mean (SD) |
p1 |
|---|---|---|---|---|---|
| Pulsatility Index | |||||
|
| |||||
| LdMCA | 87 | 1.11 (0.24) | 1.18 (0.24) | 1.28 (0.34) | .0612 |
| LpMCA | 96 | 1.11 (0.22) | 1.19 (0.28) | 1.25 (0.25) | .0362 |
| LACA | 90 | 1.05 (0.36) | 1.17 (0.21) | 1.24 (0.34) | .0772 |
| LPCA | 85 | 1.00 (0.21) | 1.05 (0.18) | 1.18 (0.31) | .0252 |
| Lsiph | 101 | 1.13 (0.21) | 1.21 (0.28) | 1.44 (0.45) | .0022 |
| LICA | 101 | 1.20 (0.26) | 1.37 (0.21) | 1.29 (0.26) | .052 |
| LVA | 98 | 1.12 (0.20) | 1.11 (0.11) | 1.15 (0.24) | .766 |
| pBA | 99 | 1.04 (0.25) | 1.08 (0.20) | 1.20 (0.41) | .1132 |
| dBA | 97 | 1.00 (0.19) | 1.12 (0.22) | 1.16 (0.23) | .0072 |
| RdMCA | 95 | 1.06 (0.21) | 1.16 (0.28) | 1.23 (0.23) | .0062 |
| RpMCA | 99 | 1.04 (0.20) | 1.14 (0.22) | 1.22 (0.25) | .0052 |
| RACA | 97 | 1.10 (0.19) | 1.11 (0.24) | 1.17 (0.24) | .315 |
| RPCA | 90 | 1.05 (0.26) | 1.09 (0.22) | 1.21 (0.30) | .0582 |
| Rsiph | 100 | 1.20 (0.24) | 1.38 (0.27) | 1.39 (0.45) | .0202 |
| RICA | 102 | 1.21 (0.23) | 1.35 (0.23) | 1.37 (0.23) | .0082 |
| RVA | 97 | 1.11 (0.31) | 1.12 (0.23) | 1.24 (0.43) | .327 |
|
| |||||
| Mean Flow Velocity | |||||
|
| |||||
| LdMCA | 87 | 38.14 (11.62) | 37.22 (11.52) | 30.68 (10.87) | .0262 |
| LpMCA | 96 | 39.04 (11.66) | 38.82 (14.65) | 33.13 (10.19) | .056 |
| LACA | 90 | 39.91 (12.53) | 35.40 (11.15) | 34.00 (16.00) | .183 |
| LPCA | 85 | 30.95 (8.62) | 32.53 (17.25) | 24.91 (7.95) | .0172 |
| Lsiph | 101 | 31.69 (7.98) | 33.64 (8.15) | 26.41 (7.03) | .0032,3 |
| LICA | 101 | 32.79 (6.79) | 31.27 (6.60) | 26.64 (7.34) | .0012 |
| LVA | 98 | 27.04 (10.34) | 27.55 (7.12) | 23.08 (7.19) | .066 |
| pBA | 99 | 28.29 (7.69) | 28.18 (5.21) | 24.79 (8.41) | .123 |
| dBA | 97 | 31.73 (8.00) | 28.36 (3.93) | 27.00 (8.60) | .0302 |
| RdMCA | 94 | 39.55 (12.62) | 31.80 (8.23) | 28.35 (10.09) | .0012 |
| RpMCA | 99 | 40.85 (10.87) | 41.09 (13.84) | 32.83 (10.93) | .0062 |
| RACA | 98 | 37.23 (11.63) | 33.92 (11.07) | 32.64 (12.33) | .218 |
| RPCA | 90 | 32.24 (11.55) | 28.90 (7.13) | 27.86 (12.62) | .252 |
| Rsiph | 100 | 32.21 (8.64) | 30.55 (7.71) | 27.66 (9.34) | .0802 |
| RICA | 102 | 32.12 (7.36) | 30.64 (6.45) | 27.33 (8.17) | .0252 |
| RVA | 97 | 25.79 (8.06) | 26.64 (4.54) | 22.95 (7.64) | .118 |
p-value for Welch’s-weighted ANOVA
p<.05 for Tukey-Kramer adjustment for comparison of means between non-demented controls and Alzheimer’s disease subjects
p<.05 for Tukey-Kramer adjustment for comparison of means between mild cognitive impairment and Alzheimer’s disease subjects
Abbreviations: NDC, non-demented control; MCI, mild cognitive impairment; AD, Alzheimer’s disease; dBA, distal basilar artery; LACA, left anterior cerebral artery; LdMCA, left distal middle cerebral artery; LICA, left internal carotid artery; LpMCA, left proximal middle cerebral artery; LPCA, left posterior cerebral artery; Lsiph, left siphon; LVA, left vertebral artery; pBA, proximal basilar artery; RACA, right anterior cerebral artery; RICA, right internal carotid artery; RdMCA, right distal middle cerebral artery; RPCA, right posterior cerebral artery; RpMCA, right proximal middle cerebral artery; Rsiph, right siphon; RVA, right vertebral artery
The areas for most of the analyses were significantly different from 0.5 for the PI and MVF values for each artery of interest (Table 3 and 4). ROC curves of PI and MVF obtained for the insonated arteries (Lsiph, RdMCA, LICA) with the areas (Table 3 and 4) closest to the value of 1.00 are presented in Figures 1 and 2. The areas for these measurements range from 0.72 to 0.76, a potentially good diagnostic test. The sensitivity for these four measurements (Lsiph and RdMCA PI, and RdMCA and LICA MVF) ranged from 72% to 89% while the specificity ranged from 61% to 68%. The associated cutoff values for the Lsiph PI and RdMCA PI measurements are 1.25 cm/sec and 1.15 cm/sec, respectively, with measurements in excess of these values being indicative of a diagnosis of AD. The cutoff values for RdMCA MVF and LICA MVF are 29.5 cm/sec and 27.5 cm/sec, respectively, with measurements below the cutoff value being consistent with a diagnosis of AD. The remaining measurements for the different arteries had smaller areas and lesser sensitivity for discriminating between AD and NDC and consequently were not included in further analyses.
Table 3.
ROC Curve Area Values for PI of Insonated Arteries in Subjects with AD and NDC
| Insonated Artery |
ROC Curve Area |
Standard Error |
P Value | Sample Size - AD |
Sample Size - NDC |
PI Cut off |
Sensitivity (%) |
Specificity (%) |
|---|---|---|---|---|---|---|---|---|
| Lsiph | 0.75 | 0.05 | < 0.001 | 40 | 50 | 1.25 | 72.0 | 67.5 |
| RdMCA | 0.72 | 0.06 | < 0.001 | 36 | 49 | 1.15 | 75.5 | 63.9 |
| RICA | 0.71 | 0.05 | < 0.001 | 41 | 50 | 1.25 | 62.0 | 75.6 |
| RpMCA | 0.70 | 0.06 | < 0.001 | 39 | 49 | 1.05 | 55.1 | 82.1 |
| LPCA | 0.70 | 0.06 | < 0.001 | 34 | 43 | 1.05 | 65.1 | 67.7 |
| dBA | 0.69 | 0.06 | < 0.001 | 36 | 50 | 1.05 | 60.0 | 72.2 |
| LACA | 0.68 | 0.06 | 0.01 | 35 | 45 | 1.05 | 62.2 | 62.9 |
| LpMCA | 0.68 | 0.06 | < 0.001 | 37 | 48 | 0.97 | 29.2 | 89.2 |
| pBA | 0.66 | 0.06 | 0.01 | 38 | 50 | 0.92 | 42.0 | 81.6 |
| LdMCA | 0.65 | 0.06 | 0.02 | 33 | 45 | 1.15 | 57.8 | 69.7 |
| RPCA | 0.65 | 0.06 | 0.02 | 34 | 46 | 0.89 | 32.6 | 91.2 |
| Rsiph | 0.65 | 0.06 | 0.02 | 40 | 49 | 1.05 | 34.7 | 85.0 |
| RVA | 0.63 | 0.06 | 0.03 | 37 | 49 | 0.95 | 26.5 | 89.2 |
| LICA | 0.61 | 0.06 | 0.08 | 41 | 49 | 1.25 | 61.2 | 53.7 |
| RACA | 0.58 | 0.06 | 0.21 | 38 | 49 | 0.95 | 26.5 | 86.8 |
| LVA | 0.50 | 0.06 | 1.00 | 38 | 49 | 0.94 | 18.4 | 89.5 |
Abbreviations: ROC, receiver-operator characteristic; AD, Alzheimer’s disease; NDC, non-demented control; PI, pulsatility index; Lsiph, left siphon; RdMCA, right distal middle cerebral artery; RICA, right internal carotid artery; RpMCA, right proximal middle cerebral artery; LPCA, left posterior cerebral artery; dBA, distal basilar artery; LACA, left anterior cerebral artery; LpMCA, left proximal middle cerebral artery; pBA, proximal basilar artery; LdMCA, left distal middle cerebral artery; RPCA, right posterior cerebral artery; Rsiph, right siphon; RVA, right vertebral artery; LICA, left internal carotid artery; RACA, right anterior cerebral artery; LVA, left vertebral artery.
Table 4.
ROC Curve Area Values for MFV of Insonated Arteries in Subjects with AD and NDC
| Insonated Artery |
ROC Curve Area |
Standard Error |
P Value | Sample Size - AD |
Sample Size - NDC |
MFV Cut Off (cm/sec) |
Sensitivity (%) |
Specificity (%) |
|---|---|---|---|---|---|---|---|---|
| RdMCA | 0.76 | 0.05 | < 0.001 | 36 | 47 | 29.5 | 89.4 | 61.1 |
| LICA | 0.76 | 0.05 | < 0.001 | 41 | 48 | 27.5 | 77.1 | 61.0 |
| RICA | 0.72 | 0.06 | < 0.001 | 41 | 49 | 30.5 | 61.2 | 78.1 |
| RpMCA | 0.71 | 0.06 | < 0.001 | 39 | 48 | 38.5 | 56.3 | 76.9 |
| LPCA | 0.70 | 0.06 | < 0.001 | 34 | 42 | 30.5 | 50.0 | 82.4 |
| dBA | 0.69 | 0.06 | < 0.001 | 36 | 49 | 28.5 | 65.3 | 63.9 |
| Lsiph | 0.68 | 0.06 | < 0.001 | 40 | 49 | 32.5 | 40.8 | 85.0 |
| LdMCA | 0.68 | 0.06 | 0.01 | 34 | 44 | 35.5 | 59.1 | 76.5 |
| LACA | 0.67 | 0.06 | 0.01 | 35 | 44 | 35.5 | 63.6 | 68.6 |
| Rsiph | 0.66 | 0.06 | 0.01 | 40 | 48 | 28.5 | 66.7 | 65.0 |
| LpMCA | 0.66 | 0.06 | 0.01 | 38 | 47 | 35.5 | 59.6 | 71.1 |
| RACA | 0.63 | 0.06 | 0.04 | 38 | 47 | 30.5 | 70.2 | 57.9 |
| RPCA | 0.63 | 0.06 | 0.04 | 34 | 45 | 30.5 | 57.8 | 76.5 |
| LVA | 0.62 | 0.06 | 0.05 | 38 | 48 | 29.5 | 31.3 | 84.2 |
| pBA | 0.61 | 0.06 | 0.08 | 38 | 49 | 25.5 | 63.3 | 55.3 |
| RVA | 0.60 | 0.06 | 0.10 | 37 | 48 | 27.5 | 43.8 | 75.7 |
Abbreviations: ROC, receiver-operator characteristic; AD, Alzheimer’s disease; NDC, non-demented control; MFV, mean flow velocity. For insonated artery abbreviations, see footnote at end of Table 3.
Figure 1.

ROC curves for Lsiph and RdMCA pulsatility indices in subjects with AD and NDC. Lsiph PI, left siphon pulsatility index; RdMCA PI, right distal middle cerebral artery pulsatility index.
Figure 2.

ROC curves for LICA and RdMCA mean flow velocities in subjects with AD and NDC. LICA MFV, left internal carotid artery mean flow velocity; RdMCA, right distal middle cerebral artery mean flow velocity.
In Tables 2, 3 and 4, the sample size is variable due to the nature of the TCD method. During the course of implementing the TCD ultrasound, several bone and vascular structural alterations as well as blood flow anomalies were detected in some of the cerebral arteries in the three investigated groups. These deviations are presented in supplementary Table 1S. Between 10-14% of aged individuals have changes in the composition and thickness of their cranial bones that hinder the efficient insonation of some intracranial arteries [32]. In our cohort, few individuals had suboptimal or absent windows. A significant number of anatomo-pathological changes resulting in hemodynamic alterations in the arteries of the circle of Willis and its branches were fortuitously discovered by TCD in the three populations under study as described in supplementary Table 1S. In addition, 12 individuals had electrophysiological dysfunctions resulting in anomalous cardiac rhythm and/or conduction. In most of the cases studied, the individuals were entirely unaware of their underlying cardiovascular morbidities which in some instances required immediate communication with their primary care physicians.
Figures 3 and 4 show the distribution of values for age-matched NDC and AD subjects around the cutoff values (illustrated by the dark horizontal lines) for Lsiph and RdMCA PI and RdMCA and LICA MVF. It can be appreciated from these graphs that more of the AD values fall above the cutoff values for the PI than below (Figure 3), suggesting that increasing PI is associated with the diagnosis of AD. The inverse relationship is seen with the RdMCA and LICA MVF values, with the majority of AD subjects falling below the cutoff (Figure 4), implying that a diminishing MFV is associated with the diagnosis of AD. This possibility was investigated further by multiple logistic regression models of the association between a summary measure of low MFV and high PI (“compromised vascular function”) and AD (Table 5). There was evidence of both a significant association between compromised vascular function and AD as well as variation across the insonated arteries. For example, the odds of compromised vascular function in AD cases significantly increased three to seven-fold in the LpMCA, LPCA, Lsiph, dBA, RdMCA and RICA, whereas other arteries showed no significant association (e.g., LVA, RACA).
Figure 3.
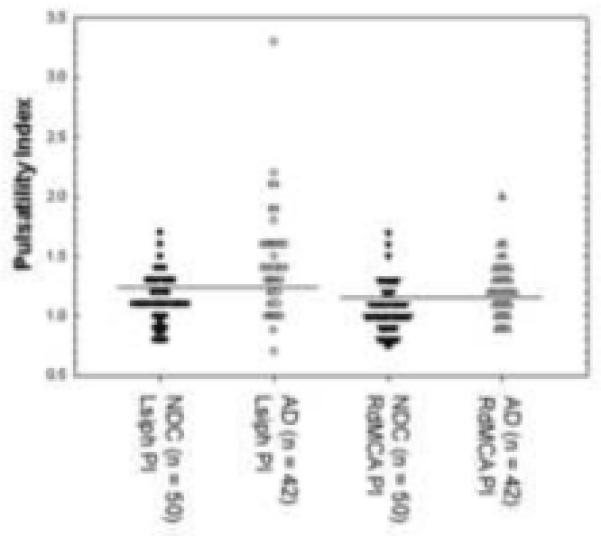
Distribution values for Lsiph and RdMCA pulsatility indices in AD and NDC subjects. The cutoff values are represented by the black horizontal lines. Notice that more of the AD values are above the cutoff line for the PI than below indicating that increasing PI is correlated with AD. NDC, non-demented control; AD, Alzheimer’s disease; PI, pulsatility index; Lsiph, left siphon; RdMCA, right distal middle cerebral artery.
Figure 4.
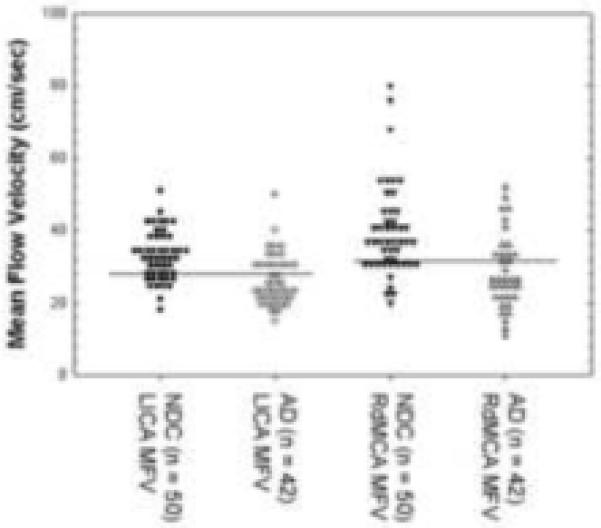
Distribution values for LICA and RdMCA mean flow velocities in cm/sec in AD and NDC subjects. The cutoff values are represented by the black horizontal lines. The majority of RdMCA and LICA MVF measures fall below the cutoff line in the AD group. NDC, non-demented control; AD, Alzheimer’s disease; MFV, mean flow velocity; LICA, left internal carotid artery; RdMCA, right distal middle cerebral artery.
Table 5.
The Association of Compromised Vascular Function with AD by Insonated Artery
| Insonated Artery | Sample Size (NDC/AD) |
Adjusted1 Odds Ratio |
p |
|---|---|---|---|
| LdMCA | 44/34 | 3.08 | .05 |
| LpMCA | 47/38 | 4.06 | .04 |
| LACA | 44/36 | 3.27 | .05 |
| LPCA | 42/35 | 5.42 | .01 |
| Lsiph | 49/41 | 4.18 | .009 |
| LICA | 48/42 | 2.32 | .16 |
| LVA | 48/39 | 0.78 | .64 |
| pBA | 49/39 | 2.70 | .09 |
| dBA | 49/37 | 7.60 | .007 |
| RdMCA | 47/37 | 5.33 | .003 |
| RpMCA | 48/40 | 2.58 | .10 |
| RACA | 48/39 | 1.19 | .74 |
| RPCA | 45/35 | 2.67 | .16 |
| Rsiph | 48/41 | 2.73 | .08 |
| RICA | 49/42 | 3.46 | .02 |
| RVA | 48/38 | 2.81 | .09 |
Models were adjusted for age and sex.
Abbreviations: NDC, non-demented control; AD, Alzheimer’s disease; dBA, distal basilar artery; LACA, left anterior cerebral artery; LdMCA, left distal middle cerebral artery; LICA, left internal carotid artery; LpMCA, left proximal middle cerebral artery; LPCA, left posterior cerebral artery; Lsiph, left siphon; LVA, left vertebral artery; pBA, proximal basilar artery; RACA, right anterior cerebral artery; RICA, right internal carotid artery; RdMCA, right distal middle cerebral artery; RPCA, right posterior cerebral artery; RpMCA, right proximal middle cerebral artery; Rsiph, right siphon; RVA, right vertebral artery
In addition, logistic regression models were used to examine the association of the sociodemographic and cardiovascular factors in Table 1 with the compromised vascular function measure (see Supplementary Table 2S). The pattern of covariates differed across arteries, with male gender and older age the most common significant factors. Hypertension, smoking and a history of stroke, and less commonly peripheral vascular disease, history of CABG/stent, treatment for hypertension and higher systolic blood pressure, were also significantly associated with compromised vascular function.
Calculations of ROC curves for age-matched NDC and MCI subjects failed to produce areas much different from 0.5. This might be the result of the small number of MCI subjects (n = 11). The distribution of MCI values were plotted in relation to the cutoff values derived for Lsiph PI, RdMCA PI, LICA MVF and RdMCA MVF for the AD and age-matched NDC subjects (Figure 5). The distribution of the values for the MCI subjects was largely equal on both sides of the cutoff values (illustrated by the dark lines). A notable exception was the concentration of MCI subjects above the cutoff value for the LICA MFV, consistent with a NDC status.
Figure 5.

Scatter charts of Lsiph and RdMCA pulsatility indices (A) and LICA and RdMCA mean flow velocities (B) in subjects with MCI. The cutoff values are represented by the black horizontal lines. NDC, non-demented control; AD, Alzheimer’s disease; PI, pulsatility index; Lsiph, left siphon; RdMCA, right distal middle cerebral artery; MFV, mean flow velocity; LICA, left internal carotid.
4. Discussion
Our study revealed a strong association between hemodynamic and structural alterations of the cerebral arteries and presumptive AD diagnosis, suggesting that decreased cerebral blood flow, diffuse brain microvascular disease, increased arterial rigidity resulting in decreased arterial compliance and putative myocardial impairment are functionally linked to this dementia. Alterations in MFV and PI are the reflection of multifactorial, pleiotropic events occurring in the cardiovascular system of elderly individuals. In AD, the intracranial arteries demonstrate a significant reduction in luminal area due to atherosclerotic vascular disease (AVD) and calcification leading to stiffening of the arterial walls. In addition, these pathophysiological changes are probably also complicated by arteriosclerosis resulting from modifications in the amount and composition of the extracellular matrix (i.e. collagen and elastin) and changes in vascular myocytes caused by the process of aging. Complicating these pathological features, the profuse deposition of amyloid along the cerebral microvasculature may also contribute to MFV and PI alterations in AD.
Previous studies have used TCD to determine the effect of AD on blood flow to the brain [19-24;26-30]. The results of these earlier studies are in agreement with our findings that the PI and MFV values for AD and NDC subjects are statistically different. However, earlier studies focused only on one or two arteries serving the cerebral circulation and failed to evaluate the full extent of circulatory changes that might affect cerebral perfusion. The circle of Willis requires a more detailed assessment because, when physically complete and patent, it provides a collateral circulation between anterior and posterior and contralateral blood flows via its communicating arteries. Our more complete inventory of blood flow to the brain has revealed that multiple vascular pathways are compromised either physiologically or structurally. These results invite speculation that it is the collective effects of these vasculature deficiencies rather than changes in an individual artery that may partially account for the diagnosis of AD. Moreover, the precise constellation of affected vessels might differ from one AD subject to another, making a more comprehensive evaluation of these vascular pathways imperative to assess adequately their combined association with the disease. In support of these tenets are the trends of an overall increase of the PI and decrease of MFV values in the AD group as compared to the MCI and NDC subjects among all the studied arteries, as illustrated in Table 2.
ROC curves were used to determine if individual TCD measurements in this study provided a basis for distinguishing NDC individuals from subjects with AD. This analysis showed that the vast majority of the measurements for PI and MFV in the arteries of interest were significantly different from an ROC area of 0.5, suggesting some diagnostic value. Those areas greater than 0.7 and closest to 1.0 (Lsiph PI, RdMCA PI, LICA MVF and RdMCA MVF) merit the most future scrutiny since they might have the greatest diagnostic potential.
The calculated cutoff values for Lsiph PI, RdMCA PI, LICA MVF and RdMCA MFV provide quantitative insight into the hemodynamic changes that might contribute to the development of AD. A PI above the cutoff values and a MVF below the cutoff values of these arterial areas (Lsiph, RdMCA and LICA) appear closely associated with the diagnosis of AD, more so than the same measurements in other arterial areas. Collectively, these results suggest that decreased blood flow and/or increased resistance to blood flow in the Lsiph, RdMCA and LICA might be contributing and possibly critical factors in the development of AD. Multivariate results support an association between compromised vascular function and increased risk AD. Compromised vascular function is significantly (3 to 7 times) more likely in AD in six of the insonated arterial segments (LpMCA, LPCA, Lsiph, dBA, RdMCA and RICA).
Scatter charts of Lsiph PI, RdMCA PI, LICA MFV and RdMCA MFV values in MCI patients show that the values for the MCI subjects are approximately equally distributed across cutoffs derived from AD and NDC subject groupings. A notable exception is LICA MFV in which most of the MCI subjects have values above the cutoff, consistent with a NDC status. In contrast, the majority of AD subjects are found below this cutoff. One interpretation of these results is that a combination of these alterations will affect cerebral blood flow and consequently AD development. It has been established that MCI subjects convert to AD at different rates and a subset of this group convert back to normal status or maintain a stable cognitive state for years following the initial diagnosis. Longitudinal studies following MCI patients using TCD could determine if changes in these different arterial regions are risk factors for the conversion to AD and if all or some of the arteries are critical for the conversion to take place. While it would be ideal if the results had shown that TCD could be used to identify MCI as well as AD, it is reasonable to assume that the TCD measurements reflect the heterogeneity and intermediate physical condition status of MCI.
Although AVD and AD have been linked statistically [8;9] this association is based primarily on indirect markers of AVD, such as blood cholesterol, serum lipid profile and C-reactive protein. Our hypothesis is that direct measures of AVD, such as TCD ultrasound or phase-contrast magnetic resonance angiography assessments, will be more accurate predictors of AD than indirect statistical correlation significance testing. By measuring cerebral blood flow and PI, systemic evaluations of cardiovascular function and anatomical conditions are obtained, resulting from multigenic expression and pleiotropic biochemical interactions modulated by environmental and lifestyle factors. If all subjects with significant AVD were already being identified and treated, there would be no real benefit to public health by simply confirming that AD is another morbidity of AVD. In general, there is considerable evidence that up to half of the adult and elderly patients with AVD symptoms are not receiving the necessary therapy [33-37]. However, even the most sophisticated approaches, which use algorithms for global AVD risk assessment, such as the Framingham algorithm, still lack sensitivity and many authors are now calling for novel risk factors, including direct assessment of cardiac function and coronary and carotid arteries, to augment the existing evaluation methods [38-42]. A recent echocardiographic assessment of AD and NDC individuals, performed by our group, showed that AD patients exhibit a statistically significant diastolic dysfunction revealed by increased transmitral vortex formation time, a possible consequence of myocardial remodeling associated with pathological cardiac aging [43]. In addition, our preliminary observations, using duplex Doppler ultrasound, demonstrated a significant decrease in diastolic flow velocities along the common carotid arteries (CCA), the carotid bulb and ICA in AD patients compared to NDC individuals (CCA: AD = 14.6 cm/sec; NDC = 19.8 cm/sec; p = 0.01; carotid bulb: AD = 16.6 cm/sec; NDC = 20.2 cm/sec; p = 0.02; ICA: AD = 21.3 cm/sec; NDC = 27.1 cm/sec; p = 0.002). These reduced diastolic velocities suggest loss of common and internal carotid arteries ‘windkessel effect’ or elastic capacity, suggesting arterial rigidity due to arteriosclerotic and atherosclerotic lesions which ultimately translate into the inability to dissipate the systolic pressure created by the heart. Other direct clinical indicators of AVD have also been reported to be associated with AD, including clinical history of peripheral vascular disease [44], elevated peripheral pulse pressure [44] and increased carotid artery intima-media thickness [7;45-48].
Our observations of multiple cardiovascular alterations incidentally discovered during TCD examination of the studied elderly population clearly demonstrate the presence of important underlying functional and hemodynamic events that otherwise would have remained undetected and therefore without proper therapeutic intervention. Recognizing the consequences of untreated AVD may provide additional motivation to both patients and physicians to be more assiduous in testing for and treating AVD and other cardiovascular pathologies. Direct assessment of AVD may therefore, alone or in combination with existing risk factors, identify a larger fraction of the AD at-risk population.
In view of overwhelming evidence and the acceptance of the multifactorial and pleiotropic features of the Alzheimer’s syndrome, broadening our understanding of AD pathogenesis beyond amyloid-β precursor protein (APP)/Aβ pathology and chemistry is essential. Although multiple studies have convincingly demonstrated a statistical association between vascular pathology and AD, the questions of causation and mechanism remain mostly unanswered. However, a large body of data from in vivo functional imaging studies suggests profound alterations in cerebral blood flow [49;50] and dysfunctional glucose utilization [51-54]. Sustained brain hypoperfusion, whether originating as a consequence of cardiac pathology or due to severe atherosclerotic stenosis and/or increased rigidity and resistance of the major arteries of the neck and brain tributaries, will have grave repercussions for brain energy metabolism as well as neuronal and glial survival. It was recently demonstrated that sustained cerebral hypoperfusion elicits hypoxia-inducible factor-1α secretion and binding to the promoter of β-secretase cleavage enzyme-1 resulting in increased production of Aβ [55], providing a direct mechanistic link between brain hypoperfusion and amyloidosis [56;57]. Cumulative evidence suggests that the brain in normal aging and AD actively adapts to progressive fuel deprivation through counterbalancing mechanisms that preserve glucose for anabolic needs and promote the β-oxidation of fats for ketone body utilization and production of ATP [58]. Progressive glucose deprivation is due in part to cerebral hypoperfusion and insulin resistance [59;60]. It is possible that in AD, the brain adopts a sustained metabolic austerity program mediated by soluble Aβ or other APP proteolysis-derived peptides, switching from an almost exclusively glycolytic pathway to a partly ketonolytic metabolism [58].
The potential contribution of brain artery functionality and hemodynamics, both as tools for reliable AD clinical assessment and potential disease prevention, has not been fully explored. Screening elderly subjects with TCD ultrasound and subsequent treatment with anti-AVD therapeutics already in use could significantly reduce the incidence of AD. An advantage of TCD ultrasound is that it is a noninvasive and technologically advanced procedure that is highly informative in terms of overall brain circulation assessment. Moreover, compared to some other existing diagnostic instrumentation, TCD in particular has minimal equipment, implementation and operator costs; it is thus accessible to the general population, yielding an invaluable appraisal of circulatory function. In addition, TCD may also become instrumental in the efficacy evaluation of drugs and other treatment modalities, such as physical exercise regimens or cognitive stimulation therapies directed to the prevention or treatment of AD.
In summary, we propose that AD is the culmination of a complex group of systemic, degenerative disorders linked to an underlying age-related deterioration of cardiovascular functions. Therefore, renewed effort should be directed toward seeking systemic anatomical and functional disease and dementia milestones rather than focusing almost exclusively on a reductionist approach of searching for single protein(s) as biomarkers for AD. The early detection of functional cardiovascular alterations that compromise brain perfusion may provide an early warning signal and impetus to provide therapeutic interventions that may prevent or delay the onset of AD. At present, only temporary treatments addressing cognitive symptoms are available for comparatively early-stage AD. The need to comprehend the interrelationships between brain perfusion and AD is urgent because an insidious vascular cascade probably induces or contributes to AD pathogenesis and progression, meaning that existing treatments useful for cardiovascular disease may inhibit or mitigate an otherwise intractable course of AD. Further investigation is needed to determine the ability of TCD ultrasound to predict cognitive decline and AD dementia in the normal elderly. If a significant risk predictive capacity is confirmed, prescription of anti-AVD agents could be rationally implemented to prevent both AVD and AD. Given the burdens and costs imposed by AD, it is critical to determine the potential for proven and reliable treatments that may help to prevent or delay the onset or progression of this devastating dementia.
Supplementary Material
Acknowledgements
This work was in part supported by Science Foundation Arizona, the Arizona Department of Health Services (Contract 211002 Arizona Alzheimer Disease Research Consortium), the National Institute on Aging (R01-AG19795 and R01-NS38674), the Arizona Alzheimer’s Disease Core Center (P30 AG-19610). We are indebted to Dr. Douglas Walker for ApoE genotyping and to Drs. Walter M. Kalback, Dean C. Luehrs and R. Lyle Patton for helpful discussions.
Abbreviations
- Aβ
Amyloid-β
- AD
Alzheimer’s disease
- ADRDA
Alzheimer’s Disease and Related Disorders Association
- ApoE
apolipoprotein E
- APP
amyloid-β precursor protein
- AVD
atherosclerotic vascular disease
- BBB
blood brain barrier
- BSHRI-BDP
Banner Sun Health Research Institute Brain Donation Program
- CABG
coronary artery bypass graft
- CCA
common carotid artery
- dBA
distal basilar artery
- DBP
diastolic blood pressure
- HT
hypertension
- ICA
internal carotid artery
- LACA
left anterior cerebral artery
- LdMCA
left distal middle cerebral artery
- LICA
left internal carotid artery
- LpMCA
left proximal middle cerebral artery
- LPCA
left posterior cerebral artery
- Lsiph
left siphon
- LVA
left vertebral artery
- MCI
mild cognitive impairment
- MFV
mean flow velocity
- MI
myocardial infarction
- MMSE
Mini Mental State Examination
- NDC
non-demented control
- NINDS
National Institute of Neurological Disorders and Stroke
- OR
odds ratio
- pBA
proximal basilar artery
- PI
pulsatility index
- PVD
peripheral vascular disease
- RACA
right anterior cerebral artery
- RICA
right internal carotid artery
- RdMCA
right distal middle cerebral artery
- ROC
receiver-operator characteristic
- RPCA
right posterior cerebral artery
- RpMCA
right proximal middle cerebral artery
- Rsiph
right siphon
- RVA
right vertebral artery
- SBP
systolic blood pressure
- TCD
transcranial Doppler
Footnotes
Publisher's Disclaimer: This is a PDF file of an unedited manuscript that has been accepted for publication. As a service to our customers we are providing this early version of the manuscript. The manuscript will undergo copyediting, typesetting, and review of the resulting proof before it is published in its final citable form. Please note that during the production process errors may be discovered which could affect the content, and all legal disclaimers that apply to the journal pertain.
Disclosures: Dr. Marwan N. Sabbagh received grant/clinical trial support from Baxter, Lilly, Wyeth, Avid, BMS, Medivation and Elan. Dr. Sabbagh is a consultant for Lilly, Wyeth, Glaxo Smith Kline, and Amerisciences. The rest of the authors involved in this project declare no competing interests.
Reference List
- 1.Brookmeyer R, Gray S, Kawas C. Projections of Alzheimer’s disease in the United States and the public health impact of delaying disease onset. Am J Public Health. 1998;88:1337–42. doi: 10.2105/ajph.88.9.1337. [DOI] [PMC free article] [PubMed] [Google Scholar]
- 2.Alzheimer’s Association 2009 Alzheimer’s disease facts and figures. Alzheimers Dement. 2009;5:234–70. doi: 10.1016/j.jalz.2009.03.001. [DOI] [PubMed] [Google Scholar]
- 3.Gaziano JM. Global Burden of Cardiovascular Disease. In: Zipes DP, Libby P, Bonow RO, Braunwald E, editors. Braunwald’s Heart Disease. Elsevier Saunders; Philadelphia: pp. 1–19. [Google Scholar]
- 4.Devous MD., Sr. Functional brain imaging in the dementias: role in early detection, differential diagnosis, and longitudinal studies. Eur J Nucl Med Mol Imaging. 2002;29:1685–96. doi: 10.1007/s00259-002-0967-2. [DOI] [PubMed] [Google Scholar]
- 5.Roher AE, Esh C, Kokjohn TA, Kalback W, Luehrs DC, Seward JD, et al. Circle of Willis atherosclerosis is a risk factor for sporadic Alzheimer’s disease. Arterioscler Thromb Vasc Biol. 2003;23:2055–62. doi: 10.1161/01.ATV.0000095973.42032.44. [DOI] [PubMed] [Google Scholar]
- 6.Roher AE, Esh C, Rahman A, Kokjohn TA, Beach TG. Atherosclerosis of cerebral arteries in Alzheimer disease. Stroke. 2004;35:2623–27. doi: 10.1161/01.STR.0000143317.70478.b3. [DOI] [PubMed] [Google Scholar]
- 7.Hofman A, Ott A, Breteler MM, Bots ML, Slooter AJ, van Harskamp F, et al. Atherosclerosis, apolipoprotein E, and prevalence of dementia and Alzheimer’s disease in the Rotterdam Study. Lancet. 1997;349:151–54. doi: 10.1016/S0140-6736(96)09328-2. [DOI] [PubMed] [Google Scholar]
- 8.Honig LS, Kukull W, Mayeux R. Atherosclerosis and AD: analysis of data from the US National Alzheimer’s Coordinating Center. Neurology. 2005;64:494–500. doi: 10.1212/01.WNL.0000150886.50187.30. [DOI] [PubMed] [Google Scholar]
- 9.Beach TG, Wilson JR, Sue LI, Newell A, Poston M, Cisneros R, et al. Circle of Willis atherosclerosis: association with Alzheimer’s disease, neuritic plaques and neurofibrillary tangles. Acta Neuropathol. 2007;113:13–21. doi: 10.1007/s00401-006-0136-y. [DOI] [PubMed] [Google Scholar]
- 10.Kalaria RN. Small vessel disease and Alzheimer’s dementia: pathological considerations. Cerebrovasc Dis. 2002;13(Suppl 2):48–52. doi: 10.1159/000049150. [DOI] [PubMed] [Google Scholar]
- 11.Jellinger KA. Alzheimer disease and cerebrovascular pathology: an update. J Neural Transm. 2002;109:813–36. doi: 10.1007/s007020200068. [DOI] [PubMed] [Google Scholar]
- 12.de la Torre JC. Alzheimer disease as a vascular disorder: nosological evidence. Stroke. 2002;33:1152–62. doi: 10.1161/01.str.0000014421.15948.67. [DOI] [PubMed] [Google Scholar]
- 13.Cullen KM, Kocsi Z, Stone J. Microvascular pathology in the aging human brain: evidence that senile plaques are sites of microhaemorrhages. Neurobiol Aging. 2006;27:1786–96. doi: 10.1016/j.neurobiolaging.2005.10.016. [DOI] [PubMed] [Google Scholar]
- 14.Kalback W, Esh C, Castano EM, Rahman A, Kokjohn T, Luehrs DC, et al. Atherosclerosis, vascular amyloidosis and brain hypoperfusion in the pathogenesis of sporadic Alzheimer’s disease. Neurol Res. 2004;26:525–39. doi: 10.1179/016164104225017668. [DOI] [PubMed] [Google Scholar]
- 15.Derouesne C, Poirier J. Cerebral lacunae: still under debate. Rev Neurol (Paris) 1999;155:823–31. [PubMed] [Google Scholar]
- 16.Knopman DS. Cerebrovascular disease and dementia. Br J Radiol. 2007;80:S121–S127. doi: 10.1259/bjr/75681080. Spec No 2. [DOI] [PubMed] [Google Scholar]
- 17.Henry-Feugeas MC. MRI of the ’Alzheimer syndrome’. J Neuroradiol. 2007;34:220–227. doi: 10.1016/j.neurad.2007.07.002. [DOI] [PubMed] [Google Scholar]
- 18.Soffer D. Cerebral amyloid angiopathy--a disease or age-related condition. Isr Med Assoc J. 2006;8:803–6. [PubMed] [Google Scholar]
- 19.Stefani A, Sancesario G, Pierantozzi M, Leone G, Galati S, Hainsworth AH, et al. CSF biomarkers, impairment of cerebral hemodynamics and degree of cognitive decline in Alzheimer’s and mixed dementia. J Neurol Sci. 2009;283:109–15. doi: 10.1016/j.jns.2009.02.343. [DOI] [PubMed] [Google Scholar]
- 20.Vicenzini E, Ricciardi MC, Altieri M, Puccinelli F, Bonaffini N, Di Piero V, et al. Cerebrovascular reactivity in degenerative and vascular dementia: a transcranial Doppler study. Eur Neurol. 2007;58:84–89. doi: 10.1159/000103642. [DOI] [PubMed] [Google Scholar]
- 21.Ruitenberg A, den Heijer T, Bakker SL, van Swieten JC, Koudstaal PJ, Hofman A, et al. Cerebral hypoperfusion and clinical onset of dementia: the Rotterdam Study. Ann Neurol. 2005;57:789–94. doi: 10.1002/ana.20493. [DOI] [PubMed] [Google Scholar]
- 22.Franceschi M, Alberoni M, Bressi S, Canal N, Comi G, Fazio F, et al. Correlations between cognitive impairment, middle cerebral artery flow velocity and cortical glucose metabolism in the early phase of Alzheimer’s disease. Dementia. 1995;6:32–38. doi: 10.1159/000106919. [DOI] [PubMed] [Google Scholar]
- 23.Heun R, Knappertz V, Kraemer G. Transcranial Doppler sonography in dementia of Alzheimer type. Dementia. 1994;5:327–33. doi: 10.1159/000106742. [DOI] [PubMed] [Google Scholar]
- 24.Cacabelos R, Fernandez-Novoa L, Lombardi V, Corzo L, Pichel V, Kubota Y. Cerebrovascular risk factors in Alzheimer’s disease: brain hemodynamics and pharmacogenomic implications. Neurol Res. 2003;25:567–80. doi: 10.1179/016164103101202002. [DOI] [PubMed] [Google Scholar]
- 25.Roher AE, Garami Z, Alexandrov AV, Kokjohn TA, Esh CL, Kalback WM, et al. Interaction of cardiovascular disease and neurodegeneration: transcranial Doppler ultrasonography and Alzheimer’s disease. Neurol Res. 2006;28:672–78. doi: 10.1179/016164106X130470. [DOI] [PubMed] [Google Scholar]
- 26.Ries F, Horn R, Hillekamp J, Honisch C, Konig M, Solymosi L. Differentiation of multi-infarct and Alzheimer dementia by intracranial hemodynamic parameters. Stroke. 1993;24:228–35. doi: 10.1161/01.str.24.2.228. [DOI] [PubMed] [Google Scholar]
- 27.Sattel H, Forstl H, Biedert S. Senile dementia of Alzheimer type and multi-infarct dementia investigated by transcranial Doppler sonography. Dementia. 1996;7:41–46. doi: 10.1159/000106851. [DOI] [PubMed] [Google Scholar]
- 28.Alvarez XA, Pichel V, Perez P, Laredo M, Corzo D, Zas R, et al. Double-blind, randomized, placebo-controlled pilot study with anapsos in senile dementia: effects on cognition, brain bioelectrical activity and cerebral hemodynamics. Methods Find Exp Clin Pharmacol. 2000;22:585–94. [PubMed] [Google Scholar]
- 29.Alvarez XA, Mouzo R, Pichel V, Perez P, Laredo M, Fernandez-Novoa L, et al. Double-blind placebo-controlled study with citicoline in APOE genotyped Alzheimer’s disease patients. Effects on cognitive performance, brain bioelectrical activity and cerebral perfusion. Methods Find Exp Clin Pharmacol. 1999;21:633–44. [PubMed] [Google Scholar]
- 30.Purandare N, Burns A, Daly KJ, Hardicre J, Morris J, Macfarlane G, et al. Cerebral emboli as a potential cause of Alzheimer’s disease and vascular dementia: case-control study. BMJ. 2006;332:1119–24. doi: 10.1136/bmj.38814.696493.AE. [DOI] [PMC free article] [PubMed] [Google Scholar]
- 31.Petersen RC. Mild cognitive impairment as a diagnostic entity. J Intern Med. 2004;256:183–94. doi: 10.1111/j.1365-2796.2004.01388.x. [DOI] [PubMed] [Google Scholar]
- 32.Tegeler CH, Ratanakorn D. Physics and Principles. In: Babikian VL, Weschsler LR, editors. Transcranial Doppler Ultrasound. Butterworth Heinemann; Boston: 1997. pp. 3–11. [Google Scholar]
- 33.Hobbs R, Hoes A. Effective management of dyslipidaemia among patients with cardiovascular risk: updated recommendations on identification and follow-up. Eur J Gen Pract. 2005;11:68–75. doi: 10.3109/13814780509178241. [DOI] [PubMed] [Google Scholar]
- 34.Bittner V. Women and coronary heart disease risk factors. J Cardiovasc Risk. 2002;9:315–22. doi: 10.1097/01.hjr.0000044514.34172.4d. [DOI] [PubMed] [Google Scholar]
- 35.Crouch MA. Effective use of statins to prevent coronary heart disease. Am Fam Physician. 2001;63:309–21. [PubMed] [Google Scholar]
- 36.Smith SC., Jr. Bridging the treatment gap. Am J Cardiol. 2000;85:3E–7E. doi: 10.1016/s0002-9149(00)00944-9. [DOI] [PubMed] [Google Scholar]
- 37.Black HR. Blood pressure control. Am J Med. 1996;101:4A50S–5S. [PubMed] [Google Scholar]
- 38.Evans M, Roberts A, Davies S, Rees A. Medical lipid-regulating therapy: current evidence, ongoing trials and future developments. Drugs. 2004;64:1181–96. doi: 10.2165/00003495-200464110-00003. [DOI] [PubMed] [Google Scholar]
- 39.Gotto AM., Jr. Statin therapy: where are we? Where do we go next? Am J Cardiol. 2001;87:13B–8B. doi: 10.1016/s0002-9149(01)01450-3. [DOI] [PubMed] [Google Scholar]
- 40.von Eckardstein A. Risk factors for atherosclerotic vascular disease. Handb Exp Pharmacol. 2005:71–105. doi: 10.1007/3-540-27661-0_2. [DOI] [PubMed] [Google Scholar]
- 41.Wong ND. Screening and risk stratification of patients with the metabolic syndrome and diabetes. Expert Rev Cardiovasc Ther. 2006;4:181–90. doi: 10.1586/14779072.4.2.181. [DOI] [PubMed] [Google Scholar]
- 42.Gould KL. Coronary arteriography and lipid lowering: limitations, new concepts, and new paradigms in cardiovascular medicine. Am J Cardiol. 1998;82:12M–21M. doi: 10.1016/s0002-9149(98)00592-x. [DOI] [PubMed] [Google Scholar]
- 43.Belohlavek M, Jiamsripong P, Calleja AM, McMahon EM, Maarouf CL, Kokjohn TA, et al. Patients with Alzheimer disease have altered transmitral flow: echocardiographic analysis of the vortex formation time. J Ultrasound Med. 2009;28:1493–500. doi: 10.7863/jum.2009.28.11.1493. [DOI] [PubMed] [Google Scholar]
- 44.Newman AB, Fitzpatrick AL, Lopez O, Jackson S, Lyketsos C, Jagust W, et al. Dementia and Alzheimer’s disease incidence in relationship to cardiovascular disease in the Cardiovascular Health Study cohort. J Am Geriatr Soc. 2005;53:1101–7. doi: 10.1111/j.1532-5415.2005.53360.x. [DOI] [PubMed] [Google Scholar]
- 45.van Oijen M, de Jong FJ, Witteman JC, Hofman A, Koudstaal PJ, Breteler MM. Atherosclerosis and risk for dementia. Ann Neurol. 2007;61:403–10. doi: 10.1002/ana.21073. [DOI] [PubMed] [Google Scholar]
- 46.Gorgone G, Ursini F, Altamura C, Bressi F, Tombini M, Curcio G, et al. Hyperhomocysteinemia, intima-media thickness and C677T MTHFR gene polymorphism: a correlation study in patients with cognitive impairment. Atherosclerosis. 2009;206:309–13. doi: 10.1016/j.atherosclerosis.2009.02.028. [DOI] [PubMed] [Google Scholar]
- 47.Silvestrini M, Gobbi B, Pasqualetti P, Bartolini M, Baruffaldi R, Lanciotti C, et al. Carotid atherosclerosis and cognitive decline in patients with Alzheimer’s disease. Neurobiol Aging. 2009;30:1177–83. doi: 10.1016/j.neurobiolaging.2007.11.008. [DOI] [PubMed] [Google Scholar]
- 48.Jurasic MJ, Popovic IM, Morovic S, Trkanjec Z, Seric V, Demarin V. Can beta stiffness index be proposed as risk factor for dementia. J Neurol Sci. 2009;283:13–16. doi: 10.1016/j.jns.2009.02.339. [DOI] [PubMed] [Google Scholar]
- 49.Dai W, Lopez OL, Carmichael OT, Becker JT, Kuller LH, Gach HM. Mild cognitive impairment and alzheimer disease: patterns of altered cerebral blood flow at MR imaging. Radiology. 2009;250:856–66. doi: 10.1148/radiol.2503080751. [DOI] [PMC free article] [PubMed] [Google Scholar]
- 50.Alsop DC, Detre JA, Grossman M. Assessment of cerebral blood flow in Alzheimer’s disease by spin-labeled magnetic resonance imaging. Ann Neurol. 2000;47:93–100. [PubMed] [Google Scholar]
- 51.Alexander GE, Chen K, Pietrini P, Rapoport SI, Reiman EM. Longitudinal PET Evaluation of Cerebral Metabolic Decline in Dementia: A Potential Outcome Measure in Alzheimer’s Disease Treatment Studies. Am J Psychiatry. 2002;159:738–45. doi: 10.1176/appi.ajp.159.5.738. [DOI] [PubMed] [Google Scholar]
- 52.Caselli RJ, Chen K, Lee W, Alexander GE, Reiman EM. Correlating cerebral hypometabolism with future memory decline in subsequent converters to amnestic pre-mild cognitive impairment. Arch Neurol. 2008;65:1231–36. doi: 10.1001/archneurol.2008.1. [DOI] [PubMed] [Google Scholar]
- 53.Langbaum JB, Chen K, Lee W, Reschke C, Bandy D, Fleisher AS, et al. Categorical and correlational analyses of baseline fluorodeoxyglucose positron emission tomography images from the Alzheimer’s Disease Neuroimaging Initiative (ADNI) Neuroimage. 2009;45:1107–16. doi: 10.1016/j.neuroimage.2008.12.072. [DOI] [PMC free article] [PubMed] [Google Scholar]
- 54.Landau SM, Harvey D, Madison CM, Koeppe RA, Reiman EM, Foster NL, et al. Associations between cognitive, functional, and FDG-PET measures of decline in AD and MCI. Neurobiol Aging. 2009 doi: 10.1016/j.neurobiolaging.2009.07.002. [DOI] [PMC free article] [PubMed] [Google Scholar]
- 55.Zhang X, Zhou K, Wang R, Cui J, Lipton SA, Liao FF, et al. Hypoxia-inducible factor 1alpha (HIF-1alpha)-mediated hypoxia increases BACE1 expression and beta-amyloid generation. J Biol Chem. 2007;282:10873–80. doi: 10.1074/jbc.M608856200. [DOI] [PubMed] [Google Scholar]
- 56.Sun X, He G, Qing H, Zhou W, Dobie F, Cai F, et al. Hypoxia facilitates Alzheimer’s disease pathogenesis by up-regulating BACE1 gene expression. Proc Natl Acad Sci U S A. 2006;103:18727–32. doi: 10.1073/pnas.0606298103. [DOI] [PMC free article] [PubMed] [Google Scholar]
- 57.Cole SL, Vassar R. Linking vascular disorders and Alzheimer’s disease: potential involvement of BACE1. Neurobiol Aging. 2009;30:1535–44. doi: 10.1016/j.neurobiolaging.2007.12.012. [DOI] [PMC free article] [PubMed] [Google Scholar]
- 58.Heininger K. A unifying hypothesis of Alzheimer’s disease. IV. Causation and sequence of events. Rev Neurosci. 2000;11:213–328. doi: 10.1515/revneuro.2000.11.s1.213. Spec No. [DOI] [PubMed] [Google Scholar]
- 59.Craft S. Insulin resistance syndrome and Alzheimer disease: pathophysiologic mechanisms and therapeutic implications. Alzheimer Dis Assoc Disord. 2006;20:298–301. doi: 10.1097/01.wad.0000213866.86934.7e. [DOI] [PubMed] [Google Scholar]
- 60.de la Monte SM, Tong M, Lester-Coll N, Plater M, Jr., Wands JR. Therapeutic rescue of neurodegeneration in experimental type 3 diabetes: relevance to Alzheimer’s disease. J Alzheimers Dis. 2006;10:89–109. doi: 10.3233/jad-2006-10113. [DOI] [PubMed] [Google Scholar]
Associated Data
This section collects any data citations, data availability statements, or supplementary materials included in this article.