

Abstract
In vitro application of pulsatile electrical stimulation to neonatal rat cardiomyocytes cultured on polymer scaffolds has been shown to improve the functional assembly of cells into contractile cardiac tissue constrcuts. However, to date, the conditions of electrical stimulation have not been optimized. We have systematically varied the electrode material, amplitude and frequency of stimulation, to determine the conditions that are optimal for cardiac tissue engineering. Carbon electrodes, exhibiting the highest charge-injection capacity and producing cardiac tissues with the best structural and contractile properties, and were thus used in tissue engineering studies. Cardiac tissues stimulated at 3V/cm amplitude and 3Hz frequency had the highest tissue density, the highest concentrations of cardiac troponin-I and connexin-43, and the best developed contractile behavior. These findings contribute to defining bioreactor design specifications and electrical stimulation regime for cardiac tissue engineering.
Keywords: tissue engineering, heart, electrical stimulation, contraction, excitation, frequency, amplitude, bioreactor
1. Introduction
Cardiovascular disease affects about 80 million Americans, with a death toll that is almost twice as high as that for all types of cancer combined, and an economic cost of about 475 billion dollars (Lloyd-Jones et al., 2009). As the population ages, the impact of cardiovascular disease on the health care system will continue to grow. Moreover, congenital heart defects, which occur in 9 of 1000 newborns are the most common congenital defects and the leading cause of death in the first year of life (Lloyd-Jones et al., 2009). Heart transplantation is the ultimate solution to treating heart failure, but is problematic due to the lack of organ donors and immune suppressive treatments. New solutions are needed to regenerate hearts damaged by cardiovascular disease, to alleviate the shortage of heart donors, to test new drugs, and to study general cardiac tissue development and function.
In the past few years, cardiac tissue engineering has emerged as a new ambitious approach to developing heart repair modalities by combining principles of engineering, cell biology and medicine. Successfully engineered 3-dimensional (3D) cardiac tissues should exhibit the properties of native cardiac tissue, including the assembly of differentiated cardiac cell populations into a synctium, with contractile and electrophysiological functionality.
Although heart tissue was first cultured almost 100 years ago when Burrows placed pieces of explanted embryonic chick hearts in culture (Burrows, 1912), the maintenance of differentiated cardiac cells in vitro using traditional cell culture methods continues to be an issue (Carrier et al., 2002) because cardiomyocytes quickly dedifferentiate during in vitro culture (Ellingsen et al., 1993, Volz et al., 1991) and are the most metabolically and physically active cells in the human body (Severs, 2000).
The limitations of traditional tissue culture have driven the development of the biomimetic paradigm of cardiac tissue engineering, which involves the application of physiologically relevant chemical and physical stimuli to cultured cells. A biomimetic approach to cardiac tissue engineering aims to recapitulate any number of aspects of the actual in vivo environment, including the convection of blood via perfusion (Carrier et al., 2002, Radisic et al., 2004a), the presence of hemoglobin via oxygen carriers in the culture medium (Radisic et al., 2006), pulsatile interstitial medium flow (Brown et al., 2008), and the exposure of cells to a cyclic stretch (Zimmermann et al., 2002) or to electrical field stimulation (Feng et al., 2005, Park et al., 2008, Radisic et al., 2004b).
In our previous studies incorporating electrical stimulation, we have found that electrical stimulation resulted in the progressive development of conductive and contractile properties characteristic of heart muscle after just 8 days of culture (Radisic et al., 2004b). Others have investigated the effects of electrical stimulation on cell growth (Braeken et al., 2009) and differentiation, using standard tools such as pacemakers (Martherus et al., 2010) adapted to the use in cell culture. However, the lack of standardization and criteria for selecting electrode materials make it difficult to compare the results from multiple studies, or to optimize the conditions of electrical stimulation.
In the present study, we have focused on the electrical stimulation component of the biomimetic system designed to promote orderly coupling between electrical signals and cell contractions. We propose that the electrode material will alter the performance and the quality of the tissue engineered constructs due to variances in charge-transfer characteristics at the electrode-electrolyte interface (Cannizzaro et al., 2007, Tandon et al., 2006). We further hypothesize that the assembly of cardiac tissue-engineered constructs depends on the conditions of electrical stimulation during culture including amplitude and frequency. To test these hypotheses, we have analyzed the functional performance of engineered cardiac tissue as a function of stimulation electrode material, stimulation amplitudes, and frequency.
We constructed bioreactors incorporating these different electrode materials, used them to apply electrical stimuli to 3D tissue engineered cardiac constructs of neonatal rat cardiomyocytes, and compared the functional performance of engineered tissue. We then provide recommendations for bioreactor configuration (electrode configuration, input voltage, and electrode age) and effects of stimulation amplitudes and frequencies during culture on electrical excitability of engineered cardiac tissue.
2. Materials and Methods
2.1 Construct Preparation
Neonatal rat ventricular myocytes (5 × 10⁶ cells) obtained from 2-day old neonatal Sprague Dawley rats, were seeded onto Ultrafoam collagen sponges (6 × 6 × 1.5 mm) using Matrigel® (25 µl, Becton Dickinson, Franklin Lakes, NJ) as described previously in the literature (Cannizzaro et al., 2007, Radisic et al., 2004b, Tandon et al., 2009). We excised hearts from the rat pups, removed the right and left atria and any remaining blood vessels, cut tissue samples into pieces and subjected them to an overnight trypsin digestion at 4°C. All work was done under an Institutionally approved animal protocol. The next day, in progressive steps, we removed the supernatant containing cells from the rest of the tissue and subjected the remaining pieces of tissue to collagenase digestions. Then, we incubated cells for 60 minutes at 37°C and 5% CO2 to further purify the sample of rat ventricular myocytes by differential attachment. Finally, we pelleted and resuspended the rat cardiomyocyte cells in Matrigel® in order to be seeded onto scaffolds.
Constructs were then precultured without electrical stimulation for 3 days in six-well plates (1 construct per well in 4 ml of culture medium in a 37°C/5% CO2 humidified incubator) to allow the cells to attach to scaffolds and to recover from isolation. A preculture time of 3 days has been previously determined as the optimal time to begin electric field stimulation after scaffolds are seeded (Radisic et al., 2004b). Cells were cultured in high-glucose DMEM + 10% heat-inactivated FBS (Invitrogen, Carlsbad, CA) + 1% HEPES + 1% P/S at all times.
Medium was changed after 3 days preculture and not over the subsequent 5 days of culture, to augment any potential differences between the charge-injection characteristics of electrode materials (e.g., pH gradients) through a cumulative effect over 5 days of culture with electrical stimulation. In experiments with varying applied amplitude, medium was changed every other day during electrical stimulation, for consistency with past studies (Radisic 2004b, Tandon et al., 2008). In experiments with varying applied frequency, medium was changed every day to reduce the potential negative effects of accumulated charge in the culture.
2.2 Electrical Stimulation
After preculture, constructs were transferred to 6 cm-diameter Petri dishes fitted with two 1/8-inch-diameter rod-shaped electrodes 4 cm in length and placed 1 cm apart (Figure 1A) and connected to a cardiac stimulator (Grass Industries, West Warwick, RI). The chambers were connected to the stimulator using platinum wires (Ladd Research Industries, Burlington, VT). Trains of electrical pulses (rectangular, 2 ms) that are characteristic for native myocardium (Nuccitelli, 1992) and previously used for cell monolayers (Berger et al., 1994) and cardiac tissue-engineered constructs (Radisic et al., 2004b, Tandon et al., 2009) were applied continuously for an additional 5 days. We chose monophasic pulses for their simplicity, and also to avoid the possible undesirable effect of biphasic pulses inhibiting action potentials (i.e. the secondary pulse is hyperpolarizing, and can interfere with the initiation of action potential, Plonsey and Barr, 2007).
Figure 1. Experimental setup and modeling for electrical stimulation bioreactor.

Experimental setup: (A) An electrical stimulator generates the pulses which are transmitted to bioreactors located inside an incubator maintained at 37° C. Bioreactors are in form of modified 60 mm diameter Petri dishes outfitted with electrodes 4 cm in length placed 1 cm apart. 3-D collagen scaffolds are placed in between the electrodes. Modeling of electrical fields in bioreactor at the initiation of a 5V pulse: (B) Top view. (C) Cross-sectional view with traces of pathways between electrodes, where Trace A corresponds to the longest and Trace B corresponds to the shortest distance between the two electrodes. (D) Plot of voltage versus distance from the center of the Petri dish for Trace A (blue) and Trace B (pink).
We varied the following parameters of the electrical stimulation: electrode material, amplitude (1–6 V/cm), duration (0.25–10 ms), and frequency (1, 3, and 5 Hz). The tested electrode materials were carbon graphite (Ladd Research Industries, Burlington, VT), titanium, stainless steel (McMaster-Carr, Aurora, OH), and titanium-nitride coated titanium (electrode, McMaster-Carr, Aurora, OH; coating Eclat Industries, Levittown, PA). Constructs cultured in Petri dishes without electrodes served as "nonstimulated" controls.
2.3 Assessing Performance of 3D tissues
We assessed contractile activity of engineered cardiac constructs by measuring contractile activity in response to electrical field stimulation, as previously described (Cannizzaro et al., 2007, Tandon et al., 2009). We measured excitation threshold (ET), (the minimum voltage of electrical stimulation required to elicit sustained synchronous contractions of the whole tissue construct at a frequency of 60 bpm), maximum capture rate (MCR), (maximum frequency of sustained synchronous contractions that can be achieved at a stimulation voltage corresponding to 1.5 ET). The magnitude of contractions of engineered cardiac constructs was assessed visually, by recording video of the tissue in response to electrical field stimulation at 1.5 ET and subsequent video analysis with our custom software (Tandon et al., 2009). All measurements were performed with constructs maintained in a Tyrode’s solution and on a heated stage, and with carbon stimulating electrodes. Differences between groups were analyzed by one-way ANOVA test and post-hoc Tukey’s test, with p<0.05 considered significant.
2.4 Planar Strain Analysis
Digital image correlation with subpixel displacement estimation was used to identify local areas of the tissue that were participating in contraction. In this method, each pixel in the image was identified as a unique intensity pattern of a subset of surrounding pixels, and therefore the movement of the subset was treated as that of the pixel (Bay, 1995). The procedure we used consisted of two steps. First, a fast Fourier transform (FFT)-based method was utilized to match the deformed area with that in original undeformed region by maximizing normalized cross-correlation of image intensity. Second, using these values as initial inputs, sub-pixel estimation of displacement fields was performed by digital image/speckle correlation as described previously (Zhou and Goodson, 2001). With new corrected displacement values, displacement gradients were then calculated with the Savitzky-Golay differential filter, and planar strain was obtained. The local contraction of scaffolds was defined as the summation of norm planar strains.
2.5 Histological Analysis
Tissue constructs were first fixed in a 10% buffered formalin for 24 hours, before being dehydrated, embedded in paraffin, bisected in cross section through the center, and sectioned to 5 µm thickness. Sections were then stained with Hematoxylin and Eosin (H&E) for general evaluation as previously described (Tandon et al., 2009).
2.6 Current Measurements
The amount of injected charge was calculated simply by measuring the decrease of electrical potential across a resistor placed in series in the stimulation loop, and then using Ohm’s law to back-calculate the current, as a ratio of the measured voltage and the resistance (Tandon et al., 2009). In order to calculate injected charge, the current was integrated over time using SigmaPlot software during a single stimulus (Figure 2A). Immediately after the application of a stimulus, the current in the bioreactor setup reverses direction, and the amount of current during the recovery period depends on reversibility of the mechanisms of charge injection. In order to determine the amount of charge which remains unrecovered after the application of a stimulus, the current was integrated until the current flowing in the bioreactor reached a steady state.
Figure 2. Electrode Material Optimization.
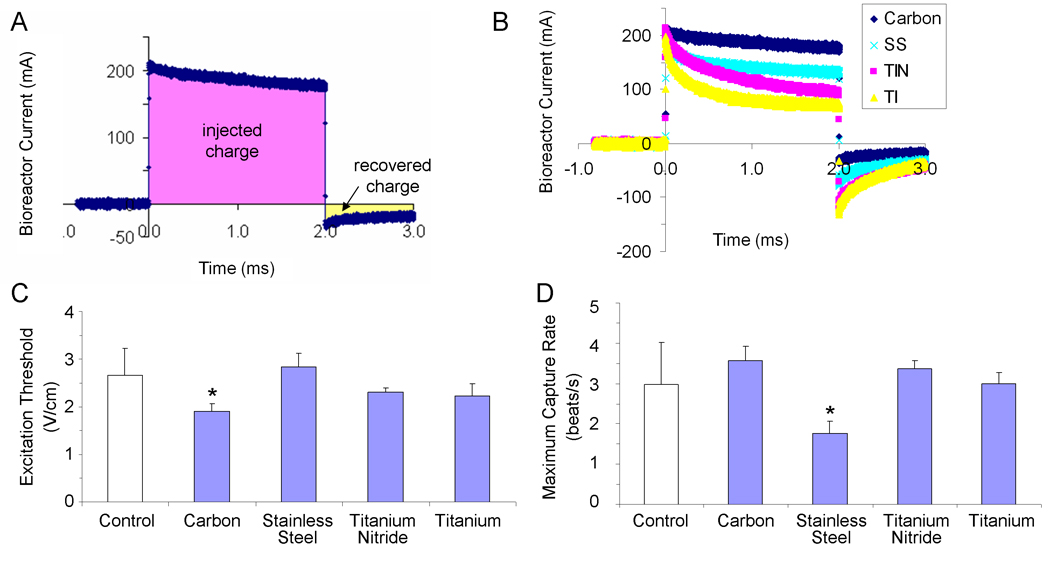
(A) Sample bioreactor current-versus-time trace, illustrating the concepts of injected charge (the total amount of charge transduced into the bioreactor during a stimulus pulse) and recovered charge (the amount of charge that was injected into the system via reversible processes). (B) Current traces for a 5 V/cm, 2 ms monophasic square wave pulse delivered to bioreactors with electrodes 4 cm in length placed 1 cm apart but differing electrode materials (carbon, stainless steel, titanium-nitride coated titanium, and titanium). (C, D) Contractile activity of tissue-engineered cardiac constructs cultured either under conditions of no stimulation (control) or with pulsatile electric-field stimulation (square-wave monophasic pulses, amplitude 5V/cm, duration 2 ms) for 5 days with electrodes of varying materials (C) Excitation threshold (electrical field voltage gradient that needs to be applied to induce synchronous contractions of cultured tissue constructs) (D) maximum capture rate (the maximum frequency at which tissue constructs can be induced to beat). * significantly different with one-way ANOVA test (p<0.05) n=3 stimulated, from one experiment; n=9 control, from two experiments.
2.7 Modeling of Electric Fields
To model the electrical field experienced by cells growing on the bioreactor surface, we assumed electroquasistatic conditions and used commercially available software (Multiphysics, Comsol) with the electrostatics module. The electroquasistatic approximation is considered appropriate for homogenous, isotropic media, where the system under consideration is much smaller than the wavelengths of interest (for biological systems generally under 10 kHz) (Durand, 1995). For application of monophasic rectangular pulses (2 ms in duration), more than 99% of the power of the applied signal lies in the frequency band below 10 kHz (95% lies in the band below 1 KHz) (Stern and Mahmoud, 2004). Therefore, we calculated the electric fields by solving Maxwell’s equations with the electroquasistatic approximation (Durand, 1995), using the conductivity of 1.5 S/m we previously measured for isotropic medium (Cannizzaro et al., 2007):
| (Eq. 1) |
| (Eq. 2) |
| (Eq. 3) |
| (Eq. 4) |
where E is the electric field (V/m) defined as the negative gradient of the scalar potential ϕ ; J is the current density (A/m); σ is the conductivity (S/m); ρ is the charge density (C/m3); ε is the permittivity of the medium (F/m); and ∇·A is the divergence of the vector A.
Furthermore, we assumed that the glass surface provides an electrically insulating boundary condition, and solved for a mesh of over 40,000 elements in the domain, with the average mesh element 0.0587 mm2 in size.
2.8 Western Blots
Western blots were performed using methods previously described (Radisic et al., 2004b). Each lane was loaded with 20 µg of total protein. Construct homogenates were diluted (1:4) in NuPAGE® LDS Sample buffer (Invitrogen, Carlsbad, CA) containing 2% LDS, boiled for 5 min to denature proteins and separated on 4–12% NuPAGE® Novex Bis-Tris minigels (Invitrogen) at a constant voltage [150 V for 1.5 h at room temperature (RT)]. After electrophoresis, the gel was electroblotted in Bicine/Bis-Tris/EDTA transfer buffer containing 10% methanol (Invitrogen) onto Nitrocellulose membranes (Invitrogen) at 32 V for 60 min at RT in the XCellII™ Blot module (Invitrogen). Blots first were incubated with 5% nonfat dry milk in PBS containing 0.1% Tween 20 (PBS-T) at RT for 1 h to block nonspecific binding and then for an additional 1 h at 50 rpm, with the appropriate primary antibody as follows: (i) polyclonal rabbit anti-Cx-43 (Millipore, cat. no. AB1728), diluted 1:10 in PBS-T; (ii) polyclonal goat anti-creatine kinase-MM (Santa Cruz Biotechnology, sc-15164), diluted 1:200 in PBS-T; (iii) mouse anti-Tn-I (clone 284 (19C7), Millipore MAB 3150), diluted 1:100 in PBS-T; (iv) rabbit anti-α-MHC (Sigma Prestige Antibodies, HPA001349), diluted 1:100 in PBS-T; (v) mouse monoclonal anti-β-MHC (Millipore MAB 1548), diluted 1:20 in PBS-T; and (vi) mouse monoclonal anti-β-actin (clone AC-74, Sigma Aldrich), diluted 1:100 in PBS-T.
Blots were washed five times with PBS-T and incubated for 1 h at RT with rabbit anti-goat, rabbit anti-mouse, or sheep anti-rabbit IgG antibodies (Sigma), respectively, all conjugated to horseradish peroxidase (Vector Laboratories No.: PI-2000) and diluted 1:1,000 in PBS-T. The immunocomplexes were developed by using enhanced horseradish peroxidase-luminol chemiluminescence (ECL Western blotting detection reagents, GE Lifesciences, RPN2109) and detected after exposure to photographic film (HyperFilm ECL, GE Healthcare, No.:28906835) for 5–30 s. Band intensity was quantified by image analysis by using NIH ImageJ software (available at http://rsb.info.nih.gov/ij/). Statistical significance was determined via the Wilcoxon-Mann-Whitney U-test calculator (http://nsdl.org/, a test in which p<0.06 is considered significant).
2.9 Transmission Electron Microscopy and Image Analysis
Samples were fixed in 2.5% glutaraldhyde and 3% paraformaldehyde in 0.1 M sodium cacodylate buffer (pH7.4). The samples were then postfixed in 1% OsO4 in veronal acetate buffer, stained enblock overnight with 0.5% uranyl acetate in veronal acetate buffer and embedded in Spurr’s resin. Sections were cut to 50 nm thickness and stained with 2% uranyl acetate followed by 0.1% lead citrate. Samples were examined using an EM410 TEM (Philips, Eindhoven, the Netherlands).
TEM images were analyzed with ImageJ (NIH), to measure the length of intercalated, and the distance between desmosomes per intercalated disc. Statistical significance was determined via the Wilcoxon-Mann-Whitney U-test calculator (http://nsdl.org/, a test in which p<0.06 is considered significant).
3. Results and Discussion
3.1 Bioreactor Modeling and Characterization
Stimulation efficiency of cardiac constructs is determined by the ability to attain the desired physiological response, such as improved functional assembly and performance of the tissue, without impairing cell function. To this end, we used mathematical modeling to characterize the electric field within the bioreactor, fitted with two rod-shaped electrodes made of various electrode materials (Cannizzaro, Tandon, Figallo, et al., 2007) and in different geometries (Tandon et al., 2008).
Modeling results (Figure 1), show that rod-shaped electrodes produce electric field lines closely approximating those that would be produced by parallel plate electrodes (Tipler and Mosca, 2003), resulting in a linear electrical field in the area in which the scaffolds are cultured (Figure 1B). The use of silicone adhesive at electrode ends avoids exposing constructs to the edges of the electrodes where the field may not be as linear as the field in between the bulk of the electrodes (Tandon et al., 2008). As long as the scaffold is placed within ± 4 mm from the center line midway between the electrodes (Trace B, Figure 1C), they are exposed to a linear electric field (Figure 1D).
Given that the scaffolds cultured in all experiments are 6 mm × 6 mm and 1.5 mm (length, width, height, respectively), and that electrodes are spaced 1 cm apart, it is safe to assume that the scaffolds placed between electrodes (but without touching them) are stimulated by a linear electric field gradient. In future studies, we aim to increase the space for accommodating larger constructs, by using rectangular prism electrodes (as opposed to rods), with the electrical field properties of rod-shaped electrodes.
The modeling shown in Figure 1 corresponds to the initiation of a pulse. This issue is of particular importance because, in a electrochemical system such as the one described here, charge transfer can occur through three mechanisms: (i) non-Faradaic charging and discharging of the electrochemical double layer, (ii) reversible Faradaic reactions, and (iii) non-reversible Faradaic reactions (Merrill, 2005). The movement of ions determines the transient presence of current in the system, and, in turn, the amount of electric field to which the tissues are exposed. Given the differing current profiles for the four electrode materials we examined in this study (Figure 2B), we determined that the effective field gradient (throughout the entire stimulus duration) is highest for carbon (which retains 95% of the applied stimulus after 1 ms of the 2 ms stimulus), and then (in descending order) stainless steel (75%), titanium nitride (45%) and titanium (40%).
In addition to the effective electric field that differs from one electrode material to another, the mechanism of charge injection also differs amongst the four electrodes. As shown in our previous studies, the main mechanism of charge injection for stainless steel electrodes is chemical reaction. During a single 2 ms, 5 V pulse, stainless steel electrodes leave unrecovered the highest amount of electrical charge compared to the other three electrode materials (Table 1). Carbon electrodes, in contrast, exhibit not only the highest amount of injected charge, but also leave the lowest percentage of injected charge unrecovered. However, the carbon electrodes recover the charge at the slowest rate (~60 ms versus ~30 ms for the other electrode materials), a factor of interest to bioreactor design.
Table 1.
Charge injection characteristics for various electrode materials (carbon, stainless steel, titanium nitride, titanium) taken from current-versus-time traces for 5 V/cm, 2 ms monophasic square wave pulses delivered to bioreactors with electrodes 4 cm in length placed 1 cm apart.
| Material | Injected Charge (µC) |
Unrecovered Injected Charge (µC) |
% Injected Charge Unrecovered |
|---|---|---|---|
| Carbon | 364 | 56.4 | 15.5% |
| Stainless Steel | 281 | 59.2 | 21.1% |
| Titanium Nitride | 235 | 40.0 | 17.0% |
| Titanium | 180 | 45.2 | 25.1% |
3.2 Electrode Material Optimization
In our previous studies, the effects of electrode configurations, different input voltages, and electrode ageing were assessed by electrochemical impedance spectroscopy (EIS) (Cannizzaro et al., 2007, Tandon et al., 2006, Tandon et al., 2009). Carbon electrodes, which have high capacitance and high resistance to corrosion, were found to have the best charge transfer characteristics for use in cardiac tissue engineering (Cannizzaro et al., 2007, Tandon, et al., 2006), and that electrode length should be at least twice that of electrode spacing (Tandon et al., 2008).
As one important remaining issue from these previous studies was to verify the results of electrical characterization in a biological system, we tcollected preliminary data for constructs grown with the 5 V/cm stimulus used in previous studies (Radisic et al., 2004b), with and without medium change medium during the 5 days of stimulation (in order to isolate the effects of charge injection characteristics). When we examined these results, the excitation thresholds (Figure 2C) and maximum capture rates (Figure 2D) suggested that carbon electrodes were the most beneficial to the tissues, consistent with the current charge-injection studies (Figure 2B).
More specifically, when we compared excitation thresholds, only the stimulation regime employing carbon electrodes resulted in excitation thresholds that were significantly lower than that measured for control constructs, an indicator of improved excitability (Figure 2C). Furthermore, although not statistically significant, the maximum rate at which cardiac constructs could be synchronously paced appeared highest in constructs stimulated using carbon electrodes. In terms stimulation using titanium and titanium-nitride electrodes, the lack of statistical difference between control constructs and these groups provides justification for classifying these electrodes as “non-ideal.”
Finally, the constructs stimulated with stainless steel electrodes exhibited significantly different beating rates compared to control constructs (Figure 2D), ruling out these electrodes as “ideal” electrodes as well. When considering the stainless steel electrodes, it is worth noting that in this experiment media was not changed during the 5-day duration of electrical stimulation, as opposed to prior studies, in which media was changed every other day (Radisic et al., 2004b). We thus expect that the negative effects observed here for stainless steel electrodes might be mitigated by employing more frequent media change throughout the duration of culture in the presence of electrical stimulation, although this is in area of future work.
Although there was no sufficient statistical power associated with the observed differences, given that both the electrical measurements and biological data indicated that electrical stimulation of cells during culture with carbon electrodes was safe and efficient for cardiac cells, carbon electrodes were used in subsequent studies.
3.3 Optimization of the Amplitude and Frequency of Electrical Stimulation
Bioelectrical signals have been implicated in stem cell differentiation, regeneration, and cellular orientation (Adams, 2008). In past studies, we have identified a maximum safe stimulation amplitude of 8 V/cm using carbon rod electrodes (Tandon et al., 2008). In the present work, the constructs were stimulated with 2 ms monophasic square wave pulses at a range of amplitudes (from 1 – 6 V/cm) and frequencies (1, 3 and 5 Hz), and their functional performance was studied in terms of excitation thresholds, maximum capture rates and amplitudes of contraction. An optimal stimulation regime is the one resulting in low excitation threshold (indicative of electrical excitability), high maximum capture rate (indicative of cellular interconnectivity) and high amplitude of contraction (indicative of contractile behavior).
The comparison of excitation thresholds of the constructs stimulated at various amplitudes shows a trend towards lower excitation thresholds for the range 1–5 V/cm than that for control, but without statistical significance (Figure 3A). Based on this result, a range of conditions of electrical stimulation was identified from the perspective of excitation threshold as 2–5 V/cm (as shown with pink shading in Figure 3A). The comparison of maximum capture rates for various experimental groups showed that the constructs stimulated at 2, 3, and 6 V/cm were significantly different than controls (Figure 3B). In particular, constructs stimulated at 2 and 3 V/cm had higher beating rates than control, while those stimulated at 6 V/cm had significantly slower beating rates. We therefore identified the optimum stimulation amplitude to be 2–3 V/cm (as shown with pink shading in Figure 3A). Finally, the comparison of the amplitudes of contraction (Figure 3C) showed that the constructs stimulated at 3 – 4 V/cm had significantly improved functionality compared to control constructs (as shown with pink shading in Figure 3A).
Figure 3. Optimization of stimulation amplitude.

Contractile activity of tissue-engineered cardiac constructs cultured either without stimulation (control) or with pulsatile stimulation (square-wave monophasic pulses, duration 2 ms) for 5 days with increasing amplitudes of stimulation. Pink shading indicates the range of applied electrical stimulation regimes identified as having produced enhanced performance with respect to the particular metric (i.e. excitation threshold, maximum capture rate, amplitude of contraction: see discussion for details) (A) Excitation threshold (electrical field that needs to be applied to induce synchronous contractions of cultured tissue constructs) (B) maximum capture rate (the maximum frequency at which tissue constructs can be induced to beat). (C) Amplitude of contraction. * significantly different from control group with one-way ANOVA test (p<0.05) n=5–10 each group from 2 separate experiments.
When considering excitation threshold, maximum capture rate and amplitude of contraction together, the stimulus amplitude of 3 V/cm was selected as optimal, and this amplitude was used in subsequent studies to optimize the stimulation frequency.
In terms of frequency, the parameters of performance depended on the rate of stimulation to differing degrees (Figure 4). Excitation thresholds (Figure 4A) and maximum capture rates (Figure 4B) appeared to be less dependent on stimulation frequency than on the amplitude of contraction (Figure 4C), for which tissues stimulated at 3 V/cm/3 Hz, clearly outperformed other groups. Upon examination of the strength-duration curves for tissue constructs cultured with and without electrical stimulation (Figure 4D), a strength-duration relationship typical of electrically-excitable cells was observed: as stimulus strength increased, shorter stimulus duration was needed to reach threshold voltage and elicit twitching (Plonsey and Barr, 2007).
Figure 4. Optimization of stimulation frequency.
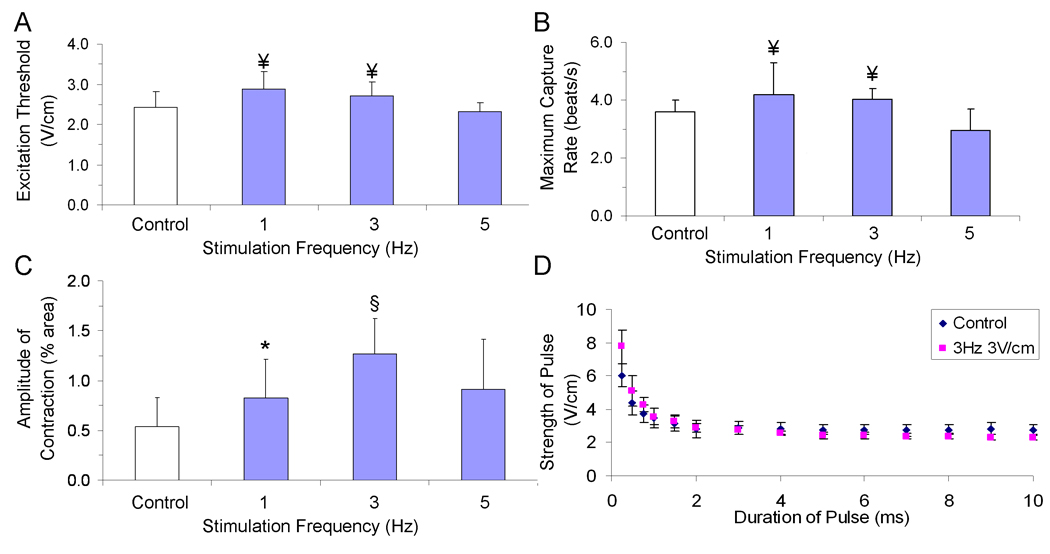
Contractile activity of tissue-engineered cardiac constructs cultured either under conditions of no stimulation (control) or with pulsatile electric-field stimulation (square-wave monophasic pulses, duration 2 ms) for 5 days with increasing frequencies of stimulation (A) Excitation threshold (electrical field that needs to be applied to induce synchronous contractions of cultured tissue constructs) (B) maximum capture rate (the maximum frequency at which tissue constructs can be induced to beat). (C) Amplitude of contraction ¥ significantly different from 5 V/cm group, * significantly different from control group, § significantly different from all other groups with one-way ANOVA test (p<0.05) n=5–10 from 3 separate experiments. (D) Strength-Duration Curve for control (blue) and stimulated (pink) constructs (n=3 each group).
A stimulus regime such as the one applied in this study that incorporaed 2 ms pulses not only minimizes the magnitude of the electric field to which cells are exposed, but also minimizes the potential adverse electrode effects of longer-duration pulses (e.g. pH gradients). Along these lines, it is worth noting the consistency of tissue samples cultured at our recommended stimulation regime (3V/cm, 3Hz, 2ms, respectively) with differing frequency of media exchange (i.e. every 5 days in Figure 2, every 2 days in Figure 3, every day in Figure 4). Going forward, we do not see a reason to recommend changing media more than once every other day.
Analysis of the detailed strain information from the videos of beating tissues that were either stimulated or unstimulated during culture (Figure 5), showed that the areas of contraction were first detected near the edges of the tissue. With electrical stimulation, the cellular contraction became stronger and more uniform, and extended to larger areas of the construct.
Figure 5. Strain Analysis.

Data are shown for a typical stimulated and control cardiac tissue constructs during relaxed and contracted states in a sample contraction. Dark blue corresponds to 0 % contraction, and red to 4% contraction. Scale bar corresponds to 3 mm.
We can speculate that perhaps the initiation of synchronous contractions can lead to better cellular connectivity as it has been shown with developing hearts cells (Ypey, et al., 1979). Despite this improvement, however, we still observe some non-uniformity of beating, which may be due to static culture conditions, in which oxygen only penetrates only ~100 µm below the surface (Radisic et al., 2004a, Radisic et al., 2006), and in fact, the H&E stained cross sections of the constructs show that the areas of compact tissue were mostly localized along the top 100 µm layer (Figure 6 A, B). The stimulated constructs also contained contractile tissue throughout their volume, perhaps due to enhanced mass transport during construct contractions, as with cardiac constructs cultured in spinner flasks (Carrier et al., 2002).
Figure 6. Tissue structure.
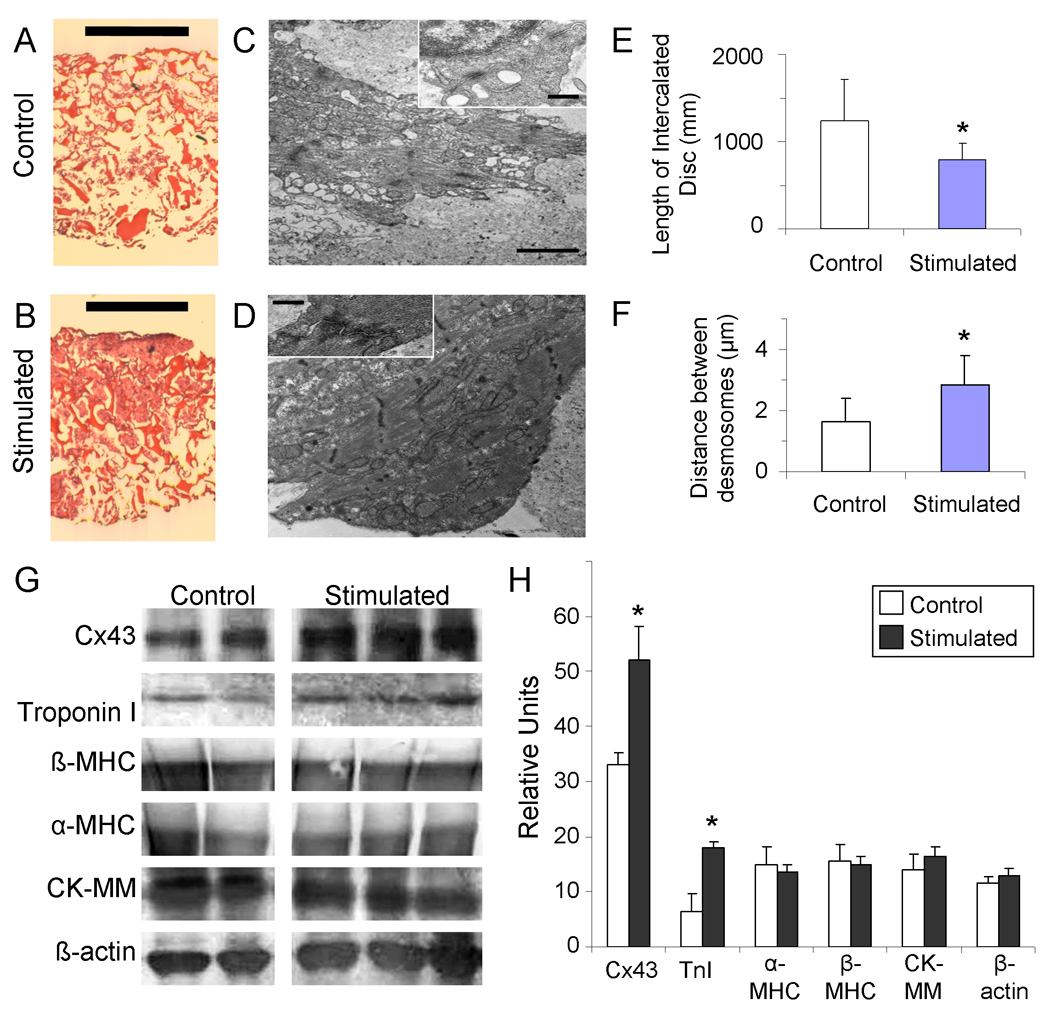
(A, B) Hematoxylin and Eosin staining of engineered tissue consttructs that were (A) unstimulated, or (B) stimulated with monophasic square wave pulses of 3 V amplitude, 3 Hz frequency and 2 ms duration. (Scale bar indicates 1 mm). (C, D) Tramsmission electron microscopy images of engineered tissue either (C) unstimulated during culture, or (D) stimulated with monophasic square wave pulses of 3 V amplitude, 3 Hz frequency and 2 ms duration, with insets of sarcomeres (scale bar indicates 2 um in main image, 500 nm in inset). (E) Length of intercalated disc. (F) Distance between desmosomes per each unit of intercalated disc (E, F) * p < 0.06 denotes statistical difference via Wilcoxon-Mann-Whitney U-test (n=4 each group) (G, H) Protein analysis of stimulated and control tissue for selected cardiac proteins. (G) Western blot for Connexin-43 (Cx-43), cardiac troponin-I, beta myosin heavy chain (β-MHC), alpha myosin heavy chain (α -MHC), muscle-type creatine kinase (CK-MM), and β-actin. (H) Band intensity as quantified by image analysis. * p<0.06 denotes statistical difference via Wilcoxon-Mann-Whitney U-test (n=2 control, n=3 stimulated).
Ultrastructural analysis revealed several positive trends, including better developed sarcomeres and intercalated discs (Figure 6C, D) with longer intercalated discs (Figure 6E) and higher frequency of desmosomes (Figure 6F) in the stimulated constructs compared to the controls, consistent with past studies (Radisic et al., 2004b). Given that desmosomes provide cell-to-cell connections to sarcomeric actin and aid in mechanical coupling, it is not surprising that stimulated constructs were observed to contract more actively than controls. Furthermore, in addition to the higher frequency of desmosomes, we also observed a trend of higher number of desmosomes per intercalated disc, indicating a more developed contraction infrastructure.
One possible mechanism for a higher degree of tissue development may involve cardiac fibroblasts, which represent ~40% of cultured cells (Radisic et al., 2008) and which have been shown to respond to electrical stimulation(Au et al., 2007). Cardiac fibroblasts have also been shown to respond to mechanical deformation with characteristic changes of their membrane potential, to depolarize during contraction due to an influx of cations (mainly sodium), and to hyperpolarize during diastolic relaxation due to reduced sodium entry (Kamkin et al., 2003, Kamkin et al., 2005). It would be interesting to study the effects of differing stimulation regimes on cardiac fibroblasts, and this is an important area of future work. In addition, the application of perfusion seeding and cultivation yields much higher cellular uniformity and survival throughout the 3-D tissue, and thereby improves functional cell assembly; combining electrical stimulation with perfusion culture is another important area of future work.
Another possible explanation for the increased amount of the tissue participating in the contraction in stimulated groups is the increased amount of connexin-43, a cardiac gap-junctional protein, and/or cardiac troponin-I, a protein essential for the cardiac contraction apparatus. The experimental evidence shows a trend that stimulated constructs express increased amounts of both of these proteins when compared to controls (Figure 6 G, H), that is consistent with past studies (Radisic et al., 2004b).
Taken together, these data show that certain parameters of engineered cardiac tissues (i.e. maximum capture rates, and amplitudes of contraction, in Figures 3C and 4D) are more sensitive to the changes in the stimulation regime than others (i.e. excitation thresholds, in Figures 3 and 4 A). The contraction rate appeared to have the highest sensitivity to changes in both the amplitude and frequencies of stimulation, producing the fewest groups showing improvement with respect to control. In contrast, the excitation threshold and amplitude of contraction seem to be much more of an “all or nothing” phenomenon, and less dependent on the exact value of the applied stimulus, and much more on just the presence of a stimulus within a relatively wide range. However, despite less dependence of amplitude of contractions on regime of stimulation, it is interesting that, among all functional parameters measured, the strongest effects of electrical stimulation was observed for the amplitude of contraction (a two-fold improvement between the best group and control).
The main trends of change measured in the present study are consistent with those previously reported,: excitation thresholds for control and stimulated groups are either not significantly different, or different by values close to standard deviation (i.e. ~20%), consistent with previous studies (Radisic et al., 2004b, Tandon et al., 2008). Furthermore, we observed the improvements in maximum capture rates that are consistent with some previous studies (Tandon et al., 2008), and lower than those published in some other studies (i.e. an improvement of ~15% versus ~30% with respect to control) (Radisic et al., 2004b).
Since other studies have not systematically compared the fractional area change, it is difficult to compare our best performing group to results reported previously that have also shown dramatic improvements in fractional area change measured using a manual method (Radisic et al., 2004b). Using the functional assessments (such as maximum capture rate, and/or amplitude of contraction), that vary significantly between the groups, as the main readout would allow for more systematic comparisons of results in future studies.
We could speculate that this varying degree of sensitivity to amplitude and frequency may be related to the types of ion channel involved, and the amount of time necessary for the charge to “relax” after a stimulus. It is worth noting that an “ideal” stimulus could be slightly above the excitation threshold, and that an “ideal” frequency could be at ~75% of measured maximum capture rates. Venturing too far from these parameters might “shock” the cells early during their development. However, it would be interesting to see if the optimal levels of these parameters change during culture, given that by P10 in a live neonatal rat, we would expect a heart rate of roughly 420 beats/minute, corresponding to 7 beats/second (Kasparov and Paton, 1997). One interesting possibility would be to stimulate cells at a lower frequency early in culture and gradually increase the frequency as the cardiomyocytes adjust to the stimulation.
Although we were not able to observe any change in media color during culture or any bubbles produced at the electrodes, because we have measured an imbalance of charge associated with the electrical stimulus applied in this study, we must suppose that the monophasic pulses could still introduce an accumulation of charge with undesirable side effects (e.g. pH gradients). Some of these effects may be counteracted with the use of biphasic stimulation, however, the secondary pulse, which is necessarily hyperpolarizing, can interfere with the initiation of action potentials (Plonsey and Barr, 2007). Various strategies may be employed to avoid this problem,, including increasing the strength of the primary pulse, decreasing the strength of the secondary pulse, introducing delays between primary and secondary pulses, or combining these strategies (as in charged balanced biphasic pulses with slow reversals) (Merrill, 2005). Experimenting with waveform shape, and “smart” stimulation regimes in which frequency is varied with time in culture, could be interesting areas for future studies.
Another possible explanation for the differing sensitivities of cardiac performance parameters to regimes of stimulation is that some benefits to the tissue from electrical stimulation may arise from the actual stimulus itself, while others may be a side product of the mechanical stimulation that arises from the initiation of the excitation-contraction apparatus. With the application of mechanical stimulation in the absence of electrical stimulation, others have observed engineered tissues to display contractile characteristics of native myocardium, but the presence of M-bands were not consistently noted (Zimmermann et al., 2002), as they were after the application of electrical stimulation (Radisic et al., 2004b). Given the high degree of electro-mechanical coupling, it is difficult to decipher the exact roles of separate mechanical and electrical stimulation of engineering constructs, and this is another important area of future work.
4. Conclusions and Future Work
We have found in this study that engineered cardiac tissues are highly dependent on parameters of electric stimulation, including the electrode material, stimulation amplitude, and stimulation frequency. We have also observed a remarkable improvement of functional performance, cell elongation, tissue compactness and protein levels for cultures exposed to an optimal regime of electric field stimulation. An important area of future work, however, is to generate synchronously contracting tissues of increased thickness and uniformity, and utilization of perfusion strategies in combination with electrical stimulation may aid this goal. Other areas include further optimization of the stimulation regime (waveform, “smart” stimulation regimes with amplitude/frequency varied with time in culture), quantifying the effect of electrical field stimulation on other cell types present in native myocardium (endothelial cells and fibroblasts), measuring developed force of contraction, and testing the biological function and remodeling of cardiac grafts after implantation in injured myocardium.
Acknowledgments
The authors would like to thank Mingyu Chen at MIT, George Eng and Dr. Timothy Martens at Columbia University for help with rat surgeries, Robert Langer at MIT for generously providing his EIS equipment, Chrystina Montouri-Sorrentino at the Cooper Union for help with video analysis, and Nicki Watson at the Whitehead Institute for help with TEM sample preparation and analysis. We gratefully acknowledge the support of NIH (HL076485, EB002520, HL088913 to GVN) and the Columbia University Presidential Fellowship (to NT).
References
- Adams DS. A New Tool for Tissue Engineers: Ions As Regulators of Morphogenesis During Development and Regeneration. Tissue Eng Part A. 2008;14:1461–1468. doi: 10.1089/ten.tea.2008.0080. [DOI] [PubMed] [Google Scholar]
- Au HT, Cheng I, Chowdhury MF, et al. Interactive effects of surface topography and pulsatile electrical field stimulation on orientation and elongation of fibroblasts and cardiomyocytes. Biomat. 2007;29:4277–4293. doi: 10.1016/j.biomaterials.2007.06.001. [DOI] [PMC free article] [PubMed] [Google Scholar]
- Bay BK. Texture correlation: A method for the measurement of detailed strain distributions within trabecular bone. J Orthop Res. 1995;13:258–267. doi: 10.1002/jor.1100130214. [DOI] [PubMed] [Google Scholar]
- Berger HJ, Prasad SK, Davidoff AJ, et al. Continual electric field stimulation preserves contractile function of adult ventricular myocytes in primary culture. Am J Physiol Heart Circ Physiol. 1994;266:H341–H349. doi: 10.1152/ajpheart.1994.266.1.H341. [DOI] [PubMed] [Google Scholar]
- Braeken D, Huys R, Jans D, et al. Local electrical stimulation of single adherent cells using three-dimensional electrode arrays with small interelectrode distances. Conf Proc IEEE Eng Med Biol Soc. 2009;2009:2756–2759. doi: 10.1109/IEMBS.2009.5333871. [DOI] [PubMed] [Google Scholar]
- Brown MA, Iyer RK, Radisic M. Pulsatile perfusion bioreactor for cardiac tissue engineering. Biotechnol Prog. 2008;24:907–920. doi: 10.1002/btpr.11. [DOI] [PubMed] [Google Scholar]
- Burrows MT. Rhythmical Activity of Isolated Heart Muscles in Vitro. Science. 1912;36:90–92. doi: 10.1126/science.36.916.90. [DOI] [PubMed] [Google Scholar]
- Carrier R, Rupnick M, Langer R, et al. Perfusion Improves Tissue Architecture of Engineered Cardiac Muscle. Tissue Eng. 2002;8:175–188. doi: 10.1089/107632702753724950. [DOI] [PubMed] [Google Scholar]
- Durand D, Bronzino JD, editors. The Biomedical Engineering Handbook. 1995. Electric Stimulation of Excitable Tissue, Chapter 17; pp. 229–251. [Google Scholar]
- Ellingsen O, Davidoff AJ, Prasad SK, et al. Adult rat ventricular myocytes cultured in defined medium: phenotype and electromechanical function. Am J Physiol Heart Circ Physiol. 1993;265:H747–H754. doi: 10.1152/ajpheart.1993.265.2.H747. [DOI] [PubMed] [Google Scholar]
- Feng Z, Matsumoto T, Nomura Y, et al. An electro-tensile bioreactor for 3-D culturing of cardiomyocytes. IEEE Eng Med Biol Mag. 2005;24:73–79. doi: 10.1109/memb.2005.1463399. [DOI] [PubMed] [Google Scholar]
- Kamkin A, Kiseleva I, Isenberg G. Activation and inactivation of a non-selective cation conductance by local mechanical deformation of acutely isolated cardiac fibroblasts. Cardiovasc Res. 2003;57:793–803. doi: 10.1016/s0008-6363(02)00775-7. [DOI] [PubMed] [Google Scholar]
- Kamkin A, Kiseleva I, Lozinsky I, et al. Electrical interaction of mechanosensitive fibroblasts and myocytes in the heart. Basic Res Cardiol. 2005;100:337–345. doi: 10.1007/s00395-005-0529-4. [DOI] [PubMed] [Google Scholar]
- Kasparov S, Paton JFR. Changes in baroreceptor vagal reflex performance in the developing rat. Pflugers Arch. 1997;434:438–444. doi: 10.1007/s004240050418. [DOI] [PubMed] [Google Scholar]
- Lloyd-Jones D, Adams R, Carnethon M, et al. Heart Disease and Stroke Statistics--2009 Update: A Report From the American Heart Association Statistics Committee and Stroke Statistics Subcommittee. Circ J. 2009;119:e21–e181. doi: 10.1161/CIRCULATIONAHA.108.191261. [DOI] [PubMed] [Google Scholar]
- Martherus R, Zeijlemaker VA, Ayoubi TAY. Electrical stimulation of primary neonatal rat ventricular cardiomyocytes using pacemakers. Biotechniques. 2010;48:65–67. doi: 10.2144/000113308. [DOI] [PubMed] [Google Scholar]
- Merrill DR, Bikson Marom, Jefferys John GR. Electrical stimulation of excitable tissue: design of efficacious and safe protocols. J Neurosci Methods. 2005;141:171–198. doi: 10.1016/j.jneumeth.2004.10.020. [DOI] [PubMed] [Google Scholar]
- Nuccitelli R. Endogenous ionic currents and DC electric fields in multicellular animal tissues. Bioelectromagnetics. 1992;13:147–157. doi: 10.1002/bem.2250130714. [DOI] [PubMed] [Google Scholar]
- Park H, Bhalla R, Saigal R, et al. Effects of electrical stimulation in C2C12 muscle constructs. J Tissue Eng Regen Med. 2008;2:279–287. doi: 10.1002/term.93. [DOI] [PMC free article] [PubMed] [Google Scholar]
- Plonsey R, Barr RC. ‘Chapter 7: Electrical Stimulation of Excitable Tissue’ in Bioelectricity: A Quantitative Approach. 3rd Ed. New York, NY, USA: Springer Science; 2007. pp. 190–193. [Google Scholar]
- Radisic M, Yang L, Boublik J, et al. Medium perfusion enables engineering of compact and contractile cardiac tissue. Am J Physiol Heart Circ Physiol. 2004a;286:H507–H516. doi: 10.1152/ajpheart.00171.2003. [DOI] [PubMed] [Google Scholar]
- Radisic M, Park H, Shing H, et al. From the Cover: Functional assembly of engineered myocardium by electrical stimulation of cardiac myocytes cultured on scaffolds. Proc Natl Acad Sci U S A. 2004b;101:18129–18134. doi: 10.1073/pnas.0407817101. [DOI] [PMC free article] [PubMed] [Google Scholar]
- Radisic M, Park H, Chen F, et al. Biomimetic Approach to Cardiac Tissue Engineering: Oxygen Carriers and Channeled Scaffolds. Tissue Eng. 2006;12:2077–2091. doi: 10.1089/ten.2006.12.2077. [DOI] [PubMed] [Google Scholar]
- Radisic M, Park H, Martens TP, et al. Pre-treatment of synthetic elastomeric scaffolds by cardiac fibroblasts improves engineered heart tissue. J Biomed Mater Res A. 2008;86A:713–724. doi: 10.1002/jbm.a.31578. [DOI] [PMC free article] [PubMed] [Google Scholar]
- Severs NJ. The cardiac muscle cell. Bioessays. 2000;22:188–199. doi: 10.1002/(SICI)1521-1878(200002)22:2<188::AID-BIES10>3.0.CO;2-T. [DOI] [PubMed] [Google Scholar]
- Stern HP, Mahmoud SA. Communication Systems: Analysis and Design. New York, USA: Prentice Hall; 2004. Baseband Modulation Using Rectangular Pulses and Binary Pulse Amplitude Modulation. [Google Scholar]
- Tandon N, Marsano A, Cannizzaro C, et al. Design of Electrical Stimulation Bioreactors for Cardiac Tissue Engineering. Conf Proc IEEE Eng Med Biol Soc. 2008;2008:3594–3597. doi: 10.1109/IEMBS.2008.4649983. [DOI] [PMC free article] [PubMed] [Google Scholar]
- Tandon N, Cannizzaro C, Chao P-HG, et al. Electrical stimulation systems for cardiac tissue engineering. Nat Protoc. 2009;4:155–173. doi: 10.1038/nprot.2008.183. [DOI] [PMC free article] [PubMed] [Google Scholar]
- Volz A, Piper HM, Siegmund B, et al. Longevity of adult ventricular rat heart muscle cells in serum-free primary culture. J Mol Cell Cardiol. 1991;23:161–173. doi: 10.1016/0022-2828(91)90103-s. [DOI] [PubMed] [Google Scholar]
- Ypey D, Clapham D, DeHaan R. Development of electrical coupling and action potential synchrony between paired aggregates of embryonic heart cells. J Membr Biol. 1979;51:75–96. doi: 10.1007/BF01869344. [DOI] [PubMed] [Google Scholar]
- Zhou P, Goodson KE. Subpixel displacement and deformation gradient measurement using digital image/speckle correlation (DISC) Optical Engineering. 2001;40:1613–1620. [Google Scholar]
- Zimmermann WH, Schneiderbanger K, Schubert P, et al. Tissue Engineering of a Differentiated Cardiac Muscle Construct. Circ Res. 2002;90:223–230. doi: 10.1161/hh0202.103644. [DOI] [PubMed] [Google Scholar]