

Abstract
Background
Tolerance to the behavioral and subjective effects of alcohol (ethanol) is thought to be a major predictive factor for the development of alcoholism. Evidence from rodent models has supported this view with those animals most likely to develop tolerance generally drinking and preferring ethanol more so than those resistant to it. Despite this evidence, very little is known about the behavioral relationships between ethanol-induced tolerance and consumption. The goal of the present study was to evaluate the development of tolerance to the ataxic effects of ethanol using a mouse model of binge-like intake dubbed ‘Drinking in the Dark’ (DID; Rhodes et al., 2005). We hypothesized that mice would become tolerant to the ataxic effects of ethanol as this behavior is known to be altered at the blood ethanol concentrations reached using this model (≥ 80 mg/dl).
Methods
To evaluate this, we gave daily DID ethanol or water access sessions to male C57BL/6J (B6) mice and monitored ataxia (and in some cases locomotion) at various time points.
Results
In general, mice given 14 consecutive days of ethanol access displayed tolerance to the ataxic effects of ethanol compared to water drinking controls. These effects were coupled with alterations in locomotor behavior and in some cases differences in ethanol pharmacokinetics.
Conclusions
Thus, we can conclude that tolerance to the behavioral effects of binge-like ethanol intake might play a key role in the daily maintenance of this behavior and that these effects may be evidence of important neuroadaptations involved in the development of alcoholism.
The rate and degree to which an individual develops tolerance to the behavioral and subjective effects of alcohol (ethanol) is thought to be a major predictive factor for the development of alcoholism. In general, organisms vulnerable to the development of behavioral tolerance (ex. ethanol-induced ataxia), drink and prefer ethanol more than those that are not (Le and Kiianmaa, 1988, Newlin and Thomson, 1990, Waller et al., 1983). For example, the ‘Alko Alcohol’ (AA) line of rats selectively bred for high ethanol consumption have been shown to develop larger degrees of tolerance to several behavioral indices compared to their low drinking ‘Alko Non-Alcohol’ (ANA) counterparts (Le and Kiianmaa, 1988). Similarly, two inbred strains of mice known to differ widely on many ethanol related behavioral phenotypes, the C57BL/6J (B6) and DBA/2J (D2), have been shown to possess marked differences in their ability to develop tolerance to many of these same behaviors (Grieve et al., 1979, Tabakoff and Ritzmann, 1979). Nevertheless, very few studies have evaluated the ability of voluntary ethanol consumption to produce tolerance to behaviors known to be directly affected by that intake.
In order to evaluate the development of tolerance to voluntary ethanol consumption as mentioned above, an animal model capable of eliciting consistent quantifiable behavioral impairment is a logical starting point. Obviously, evaluating the ability of voluntary ethanol consumption to produce tolerance in animals that generally avoid ethanol all together (ex. DBA/2J mice) is not a viable goal. Fortunately, a mouse model of binge-like ethanol intake, dubbed ‘Drinking in the Dark’ (DID; (Rhodes et al., 2005), has recently been developed whereby C57BL/6J (B6) mice voluntarily consume large quantities of 20% unsweetened ethanol solution when given limited access during peak arousal. Acutely, these high ethanol intakes elicit BEC’s ≥ 80 mg/dl and lead to motor impairment as indexed by the balance beam and rotarod tests (Rhodes et al., 2007), as well as alterations in locomotor behavior (unpublished observation and current data).
There are several notable benefits to the DID model that make it ideal for studying the development of tolerance. Most importantly, animals will consistently and voluntarily drink-to-intoxication for at least 20 consecutive days (Boehm et al., 2008) without water deprivation or lengthy fading procedures requiring artificial sweeteners or ramping of ethanol concentration. Additionally, because ethanol consumption occurs at a very specific time interval manipulated by the experimenter, knowing precisely when to examine varying degrees of tolerance is very straightforward. For example, because animals will consume large quantities of ethanol on their very first 2-hour access session, evaluating the development of rapid tolerance (defined as a decrease in the effect of a drug 24 hours following a single ethanol exposure) is relatively simple. Additionally, the consistency of binge-like behavior observed using DID makes this model ideal for the evaluation of chronic tolerance; defined as a decrease in the effect of a drug following repeated ethanol exposures.
The primary goal of this study was to evaluate the ability of the DID model to produce rapid and/or chronic tolerance to its ataxic effects. We also took the opportunity to assay for alterations in locomotor behavior and then followed up on these results with an assessment of DID-induced locomotor effects. We hypothesized that ethanol intake using DID would induce acute ataxic and locomotor effects and that additional DID ethanol exposure would lead to the development of rapid and chronic tolerance to these effects.
Methods
Animals
Male C57BL/6J mice (7-week old) were purchased from Jackson Laboratory (Bar Harbor, ME) and shipped to the animal facility at Binghamton University. Upon arrival animals were acclimated to single housing in standard shoebox mouse cages and a 12 hour reverse light/dark cycle with lights off at 10:30 AM for at least a week prior to testing. All animals had ad lib access to food and water except during the ethanol access session when only ethanol was available, and during balance beam and (in some cases) locomotor behavioral testing. All procedures were approved by the Binghamton University Institutional Animal Care and Use Committee and conformed to the Guidelines for the Care and Use of Mammals in Neuroscience and Behavioral Research (National Academic Press, 2003).
Ethanol Solutions
Ethanol drinking solutions (20% v/v) were made with 200 proof ethanol purchased from Pharmco, Inc (Brookfield, CT) and regular tap water. Ethanol solutions for challenge injections (i.p.) were made with 200 proof ethanol and 0.9% physiological saline and administered in a volume of 0.1 ml per 10 grams body weight for both 1.5 and 1.75 g/kg. These doses were chosen based on previously published data from this lab evaluating the ataxic effects of ethanol in mice using the balance beam apparatus (Linsenbardt et al., 2009).
Drinking in the Dark (DID)
DID procedures performed in our lab have been previously described (Moore et al., 2007). Three hours into the dark cycle each day, animals received access to an unsweetened 20% ethanol solution or tap water for 2 hours. Water bottles were replaced with ball-bearing sipper tubes filled with ethanol or tap water and fluid volumes were recorded to determine intake across DID access days for each individual animal.
Balance Beam
All methods for assessing ethanol-induced ataxia on the balance beam apparatus have been previously described (Linsenbardt et al., 2009, Moore et al., 2007). The balance beam consisted of a 122 cm long by 2 cm wide by 4 cm tall wood block attached at both ends to two 48 cm high ring stands. The entire apparatus was situated on top of a table such that the beam was a total of 130 cm above the floor.
All mice were trained to traverse the length of the balance beam prior to testing. During training animals were encouraged to walk from one side of the beam to the other using slight nudging with the eraser end of a pencil. This procedure was then repeated immediately one additional time. Previous studies have shown that such training is sufficient to ensure that animals will rapidly traverse the beam without experimenter intervention following ethanol challenge. Once trained, animals were placed on the balance beam apparatus for testing immediately following DID access (experiment 1) or 10 minutes following ethanol challenge (experiments 1 and 2) during which hind foot slips were recorded. In experiment 2 mice were placed in the VersaMax locomotor activity monitoring apparatus for 10 minutes prior to balance beam practice sessions in order to habituate them to the device and procedure; see experiment 2 procedures below for details.
Locomotor Activity Testing Chambers
Locomotor activity testing was conducted using the VersaMax Animal Activity Monitoring System (Accuscan Instruments Inc., Columbus, OH). Locomotor activity was detected by interruption of intersecting photocell beams evenly spaced along the walls of the 40x40 cm test chamber. This equipment was situated in sound-attenuating box chambers (inside dimensions, 53 cm across x 58 cm deep x 43 cm high) equipped with a house light and fan for ventilation and background noise. The locomotor activity testing equipment was interfaced with a Dell computer. Testing continued for 10 (exp 2) to 15 (exp 3) minutes during which time consecutive photocell beam interruptions were translated into distance traveled in cm by the VersaMax computer program. In every instance, animals were acclimated to the handling, injection (using saline), and Plexiglas chambers approximately 12 hours prior to testing the effects of experimenter administered ethanol.
Home Cage Locomotor Apparatus
Home cage locomotion was monitored using a CI Multi-Device Interface (Columbus Instruments Inc., Columbus, OH) in conjunction with a Dell computer. Ambulatory activity was detected by the interruption of photocell beams positioned along the walls of standard shoebox mouse cages. Data were collected in 1-min time intervals for a total of 2 hours during the first and final DID sessions and translated into ambulatory counts using the provided software (version 1.4.0).
Blood Sampling
For the determination of blood ethanol concentrations (BECs), 50μl peri-orbital sinus bloods were drawn immediately following behavioral testing and at one or more additional time points to evaluate ethanol metabolism. Samples were centrifuged and plasma was withdrawn and stored at −80°C. BECs were later determined using an Analox Alcohol Analyzer (Analox Instruments, Lunenburg, MA).
Statistical Analysis
Mean fluid intake for experiment 1 was analyzed using a full repeated measures analysis of variance (ANOVA) with time bins (hours) and days as within subject’s factors. Mean fluid intake for experiments 2 and 3 was analyzed using a mixed two-way ANOVA with days as the within subject’s factor and fluid assignment as the between groups factor. Foot slip data was analyzed by two-way ANOVA with ethanol challenge dose and fluid group assignment as the between groups factors. All locomotor data was analyzed by mixed two-way ANOVA with fluid assignment as the between groups factors and time bins (5 or 30 minutes) as the within groups factor. BEC data was analyzed by mixed two-factor ANOVA with fluid assignment group as the between groups factor and time of sampling as the within groups factor. Bonferroni post-hoc tests were performed when appropriate.
Procedures
Experiment 1: Chronic Tolerance to DID-induced Ataxia
The goal of experiment 1 was to determine if repeated DID ethanol pre exposure was capable of producing chronic tolerance to its ataxic effects following 1) voluntary binge-like DID ethanol exposure and/or 2) controlled ethanol challenge injections. The procedural timeline of this experiment is outlined in Table 1. Out of 40 animals, 20 were assigned to the chronic ethanol (EE) group and the remaining 20 to the chronic water (WW) group. Using standard DID procedures detailed above, groups were given access to assigned solutions for 15 consecutive days. However, in addition to recording fluid volumes at the beginning and end of each 2 hour session, volumes were also recorded at the 1 hour time interval. This additional time point gave us a rough estimate of the timecourse of fluid consumption as previous studies have shown differences in the pattern of consumption between the two fluids (Linsenbardt & Boehm, 2009); an effect that may influence the development and expression of tolerance.
Table 1.
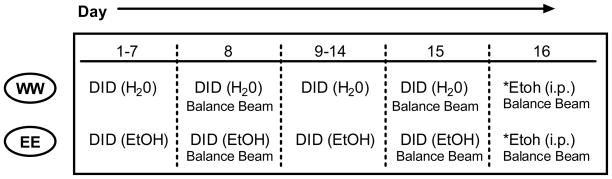 |
Indicates further separation into dosing groups on day 16 (1.5 vs. 1.75 g/kg)
On the 8th and 15th days, approximately 12 hours before DID fluid access, all animals were trained on the balance beam apparatus. Immediately following DID sipper tube removal on these days (at end of the 2 hour access session), animals were tested for hind footslips on the balance beam. We chose the 8th and 15th DID days for ataxia evaluation to be consistent with previous experiments in which approximately 1–2 week(s) of ethanol exposure were provided prior to behavioral testing (Linsenbardt and Boehm, 2009, Moore and Boehm, 2009, Moore et al., 2007). On the final day (day 16) the two fluid consumption groups were further broken down into 2 challenge injection dosing groups. Out of the 20 animals per group, 10 received 1.5 g/kg ethanol injections and the remaining 10 received 1.75 g/kg ethanol injections. All animals were immediately placed back into their home cage following ethanol injections. Ten minutes after injections animals were removed from their home cages and tested for hind footslips on the balance beam. Blood samples were taken immediately following balance beam testing (11 min), and 40, and 90 minutes post injection to determine possible differences in ethanol pharmacokinetics.
Experiment 2: Rapid and Chronic Tolerance to DID-induced Ataxia and Locomotion
The goal of experiment 2 was to extend the findings from experiment 1. Our goal was to determine if DID ethanol pre-exposure was capable of producing rapid and/or chronic tolerance to its ataxic effects following controlled ethanol challenge injections. To maximize our ability to detect changes in DID-induced behavior, we also took the opportunity to collect some additional locomotor data prior to our assessment of ethanol-induced ataxia. The procedural timeline of this experiment is outlined in Table 2. All procedures for this experiment were identical to that of experiment 1 with a few exceptions. To avoid potentially confounding ‘intoxicated practice’ effects that may have contributed to the observations in experiment 1, animals were tested for ethanol-induced ataxia (and locomotion) a single time (day 15). Furthermore, an additional group of animals was included that received only 1 day of ethanol access 24 hours prior to testing to determine if rapid tolerance had developed. This group is referred to as the WE group. Finally, in addition to having one less DID pre-exposure session than in the previous experiment (14 vs. 15 days), fluid volumes were only recorded at the beginning and end of each session and blood samples were taken only immediately following behavioral testing.
Table 2.
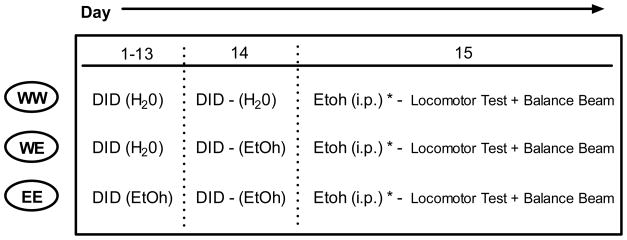 |
Indicates further separation into dosing groups on day 15 (1.5 g/kg or 1.75 g/kg)
Experiment 3: Within DID Session Effects on Locomotion
In order to better characterize locomotor effects occurring during DID access and to provide additional data for determining possible dose-related locomotor and/or pharmacokinetic alterations following repeated binge ethanol consumption, a 3rd experiment was conducted in which mice were monitored for home cage locomotion during the first and last (14th) DID access days and subsequently challenged with a 2.0 g/kg dose 24 hours following the last DID session. Based on the lack of significant rapid tolerance development in experiment 2, we opted not to include a WE (rapid tolerance) group for this experiment. The procedural timeline for this experiment can be seen in table 3. Group assignments were similar to those in the previous two experiments with the EE group receiving ethanol access and the WW group receiving water access using standard daily DID procedures for 14 consecutive days. On the 15th day 24 hours following the previous (and last) DID access session, all animals were challenged with a 2.0 g/kg ethanol dose and immediately placed in locomotor activity monitor chambers (see experiment 2) for 15 minutes. Blood samples were taken immediately following activity testing (15 min), and 120 minutes following injection to determine possible differences in ethanol pharmacokinetics.
Table 3.
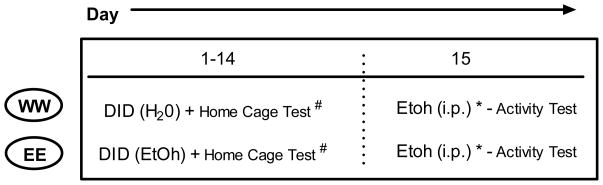 |
Indicates 2.0 g/kg dose.
Indicates testing on days 1 and 14 only.
Results
Experiment 1: DID
Ethanol and water consumption on days 1–15 can be seen in Figure 1. Analysis of ethanol-consuming animals across all 15 days (with hour bins and days as within subject’s factors) revealed significant main effects of hour time bin [F(1, 19)=120.49 p<.001], day [F(14, 266)=4.89 p<.001], and a significant bin*day interaction [F(14, 266)=1.84 p<.05]. Analysis of water-consuming animals revealed a significant main effect of day only [F(14, 266)=4.96 p<.001]. Animals with access to ethanol consumed significantly more fluid during the first half of the testing session (hour 1) compared to those with access to water, which drank approximately equal volumes of fluid across both time bins. Importantly, there were no significant differences in the timecourse or total mean ethanol (or water) intake between dosing groups on balance beam testing days. Thus, the behavioral differences described below were not driven by the time or overall amount of ethanol consumption on days 8 and 15.
Figure 1.

Fluid consumption over days and mean hind footslips and BECs immediately following DID or ethanol challenge. A. Mean ethanol intakes (g/kg and ml/kg) by 1 hour bin and 2 hour total. B. Mean water intakes (g/kg and ml/kg) by 1 hour bin and 2 hour total. Arrows indicate balance beam testing days; see figure 2. C. Mean hind footslips following DID access sessions on days 8 and 15. D. Mean hind footslips following ethanol challenge injections (1.5 and 1.75 g/kg; i.p., 20% v/v) on day 16. E. BECs immediately following testing on the balance beam following the 1.5 g/kg dose. F. BECs immediately following testing on the balance beam following the 1.75 g/kg dose. Insets reflect mean BECs immediately following balance beam testing. *’s indicate difference from all other groups (**p<.01).
Experiment 1: Footslips
Mean hind footslips on the balance beam following DID access sessions or ethanol challenge injections can be seen in Figure 2A and Figure 2B respectively. Analysis of footslips on days 8 and 15 of DID pre-exposure revealed significant main effects of day [F(1, 38)=8.75 p<.01], fluid group [F(1, 38)=12.52 p<.01], and a marginally significant day*group interaction [F(1, 38)=1.84 p=.058]. Post-hoc analysis revealed that the chronic ethanol consuming animals (EE) had significantly more footslips on day 8 than water consuming animals on this day (WW; p<.01) and both groups on day 15 (p<.01). Interestingly, there were no differences in mean footslips between the EE and WW groups on day 15; an effect that suggests the development of tolerance.
Figure 2.

Fluid consumption over days and mean footslips, locomotor activity, and BECs following day 16 challenge. A. Mean fluid intake (g/kg and ml/kg) during 2 hour DID sessions over 14 days. B. Mean hind footslips following ethanol challenge with 1.5 or 1.75 g/kg (i.p., 20% v/v). C–D. Mean distance traveled immediately following 1.5 or 1.75 g/kg ethanol challenge. Insets reflect mean locomotor activity of entire 10 minute testing session. E–F. Mean blood ethanol concentrations (mg/dl) immediately following balance beam testing and 2 hours post injection of the 1.5 and 1.75 g/kg doses. Insets reflect mean BECs immediately following balance beam testing. *Indicate difference from both WW and WE groups (**P<.01). #Indicates difference from WE group (#P<.05).
Analysis of mean footslips following ethanol challenge on day 16 revealed significant main effects of fluid consumption group [F(1, 36)=9.91 p<.01] and dose [F(1, 36)=42.15 p<.001]. Thus, there were generally fewer footslips in the EE animals and more footslips in those animals that received the highest (1.75 g/kg) dose.
Experiment 1: BECs
The timecourse of BEC following each ethanol dose can be seen in figure 2C and D. Analysis of BECs at the 11, 40, and 90 minute time bins revealed a significant main effect of bin for the 1.5 [F(2,36)=346.3 p<.001] and 1.75 [F(2,36)=233.3 p<.001] g/kg doses. There were no significant main effects or interactions with fluid assignment group. Thus, in this experiment repeated ethanol intake did not significantly alter ethanol pharmacokinetics.
Experiment 2: DID
Ethanol and water consumption over the 14 days of DID access can be seen in Figure 3A. Analysis of fluid consumption (ml/kg) revealed significant main effects of fluid group [F(2, 57)=26.83 p<.001], day [F(13, 741)=23.19 p<.001], and a significant group*day interaction [F(26, 741)=4.49 p<.001].
Figure 3.

Fluid consumption over days and mean ambulatory counts, locomotor activity, and BECs following day 15 challenge. A. Mean fluid intake (g/kg and ml/kg) during 2 hour DID sessions over 14 days. B. Total home cage ambulatory counts on day 1 vs. day 14. C. Mean distance traveled immediately following 2.0 g/kg ethanol challenge. Inset reflects mean locomotor activity of entire 15 minute testing session. D. Mean blood ethanol concentrations (mg/dl) immediately following locomotor activity testing and 2 hours post injection of the 2.0 g/kg dose. Inset reflects mean BECs immediately following locomotor activity testing. *’s Indicate difference from WW group (*p<.05; ***p<.001).
Experiment 2: Footslips
Mean hind footslips on the balance beam following ethanol challenge injections on day 15 can be seen in Figure 3B. Analysis revealed significant main effects of fluid consumption group [F(2, 86)=11.31 p<.001] and dose [F(1, 86)=42.39 p<.001]. Post-hoc analysis of fluid consumption group confirmed that there were significantly fewer footslips in EE animals compared to both the WE and WW (p<.001) groups. There were no differences observed between WE and WW animals. Thus, whereas mice receiving 14 days of repeated access to ethanol appeared to develop chronic ataxic tolerance, rapid tolerance to the ataxic effects of ethanol did not appear to have developed following 1 day of ethanol consumption using DID in this experiment.
Experiment 2: Locomotion
Mean distance traveled in the locomotor activity monitoring apparatus (not home cage) following ethanol injections on day 15 can be seen Figure 3C and D. Timecourse analysis of the 1.5 g/kg dose revealed a significant main effect of time bin [F(1, 36)=6.24 p<.05] and a significant bin*fluid group interaction [F(2, 36)=5.19 p<.05]. Post-hoc tests revealed increased locomotion in the EE group at the 2nd time bin compared to both the WE and WW groups. Timecourse analysis of the 1.75 g/kg dose revealed significant main effects of time bin [F(1, 43)=134.4 p<.001] and fluid group [F(2, 43)=7.97 p<.01; see Figure 4 inset]. Thus, repeated DID ethanol access led to alterations in the locomotor response to both tested doses of ethanol.
Experiment 2: BECs
Analysis of BECs at the 11 and 120 minute time bins can be seen in Figure 3E and F. At the 1.5 g/kg dose there were significant main effects of time bin [F(1, 36)=1390.69 p<.001] and fluid group [F(2, 36)=3.38 p<.05] as well as a significant bin*group interaction [F(2, 36)=3.58 p<.05]. However, post-hoc analysis did not reveal any differences in BEC within a given time bin.
At the 1.75 g/kg dose there were significant main effects of time bin [F(1, 49)=5272.6 p<.001] and group [F(2, 49)=13.3 p<.001] as well as a significant time bin*group interaction [F(2, 49)=8.21 p<.001]. Post-hoc tests revealed significantly lower BECs in the EE group at the 120 minute time bin compared to both the WE (p<.05) and WW (p<.001) groups. These results are suggestive of metabolic tolerance at this dose.
Experiment 3: DID
Ethanol and water consumption over the 14 days of DID access can be seen in Figure 4A. Analysis of fluid consumption (ml/kg) revealed significant main effects of fluid group [F(1, 38)=24.11 p<.001], and a significant group*day interaction [F(13, 494)=2.29 p<.01]. However, the interaction was driven by fluctuations in the stability of within-group intake and not as a result of differences in fluid intake between groups on any given day.
Experiment 3: Home Cage Locomotion
The results of home cage locomotion on days 1 and 14 can be seen in Figure 4B. Results indicated a significant day*treatment interaction [F(1, 38)=17.69 p<.001]. Post-hoc tests revealed overall increases in locomotion during the first 2 hour DID session in the ethanol consuming group compared to water drinking controls (P<.05), and overall decreases in locomotion during the last DID session (P<.05).
Experiment 3: Locomotion (Ethanol Challenge)
The results of ethanol challenge at the 2.0 g/kg dose for experiment 3 can be seen in figure 4C. Analysis revealed significant main effects of treatment [F(1, 38)=25.72 p<.001] and bin [F(2, 38)=5.81 p<.001].These results are consistent with the results of experiment 2, wherein repeated DID ethanol access led to alterations in the locomotor response to experimenter injected ethanol.
Experiment 3: BECs
Analysis of BECs immediately following locomotor testing (15 min bin) and 2 hours following ethanol challenge injection (120 min bin) can be seen in Figure 5C. There were significant main effects of fluid assignment group [F(1, 38)=18.89 p<.001] and bin [F(1, 38)=30.71 p<.001] as well as a significant bin*group interaction [F(1, 38)=16.62 p<.001]. Post-hoc analysis revealed that there were group differences in BEC only at the 120 min bin (p<.001) suggesting differences in ethanol metabolism as a results of repeated DID ethanol intake.
Discussion
Ethanol-induced Ataxia
The results of experiment 1 suggest that tolerance develops to 1) DID-induced behavioral ataxia and 2) ethanol-induced ataxia induced via experimenter administered ethanol challenge injections. Both the 1.5 and 1.75 g/kg doses have been shown to produce ataxia on the balance beam, and following multiple challenges, lead to the development of tolerance to this behavior in B6 mice (Linsenbardt et al., 2009). However, to our knowledge this is the first report to indicate tolerance to the ataxic effects of ethanol on this apparatus driven solely by repeated DID-ethanol access. That being said, because all animals were tested on the balance beam on day 8 prior to testing on days 15 and 16, the observed behavioral tolerance on either or both of these days may have resulted from some degree of ‘intoxicated practice’. Indeed, this type of effect has been previously reported to occur in some instances in both rats and mice (Gill and Deitrich, 1998, Le et al., 1989).
In order to address the possibility that intoxicated practice on the balance beam might have contributed to the observed behavioral tolerance in experiment 1 we ran an additional experiment in a separate cohort of mice (experiment 2). Consistent with the results of experiment 1, animals that received daily DID ethanol access developed chronic tolerance to the ataxic effects of both the 1.5 and 1.75 ethanol challenge injections. However, we did not observe any indication of rapid tolerance to ethanol’s ataxic effects in the group that received only one ethanol access session the previous day. Therefore, we can conclude that repeated DID ethanol consumption for at least 14 days produces tolerance to the ataxic effects of ethanol in the absence of any ‘intoxicated practice’. However, as is the case with most behavioral assays, it is impossible (and impractical) to completely control for each and every possible ‘practice’ effect in normal behaving animals. That is, although ethanol consuming animals did not have access to the balance beam apparatus at any point while intoxicated except during the final challenge session, alternative motor experiences while intoxicated (such as climbing on the wire cage top, balancing on the sipper tubes, etc.) could have contributed to the observed tolerance and cannot be ruled out.
Alterations in Ethanol-induced Locomotion
The results of experiment 2 indicated that DID ethanol history capable of inducing tolerance to its ataxic effects also led to alterations in ethanol-induced locomotion. These locomotor data would also appear to support the conclusion that repeated (but not a single) DID ethanol exposure leads to behavioral tolerance. However, because the primary goal of this experiment was to evaluate tolerance to the ataxic effects of experimenter administered ethanol, all animals received ethanol challenges on this day. Therefore, it is not immediately clear whether the ethanol-induced locomotor response in the naïve water consuming control group represented sedation, stimulation, or simply no change in locomotor behavior. Because ethanol doses of 1.5 and greater have been shown to produce locomotor depression in B6 mice within the same or similar time frame following challenge injections as used in this study (Crabbe, 1983, Crabbe et al., 1982, Dudek and Phillips, 1990), it is possible that the greater activity in the ethanol consuming animals might represent tolerance to locomotor sedative effects. However, it is also possible that all groups of mice experienced locomotor hyperactivity following ethanol challenge injections and that this hyperactivity was simply greater in the group of mice with repeated DID ethanol history (sensitization). In either case, between-group comparisons clearly indicated that repeated DID ethanol access led to significant ethanol-induced locomotor differences at both of the tested doses in this experiment.
The primary goal of experiment 3 was to characterize locomotor effects occurring during binge-like ethanol consumption. It was our belief that concurrent DID/locomotor data might be particularly informative of the role of ethanol’s locomotor altering properties in maintaining binge-like ethanol intake over many DID access sessions. Interestingly, the results of this study indicated that animals given access to ethanol solution displayed significantly higher locomotion on the first session (stimulation) and ultimately decreased levels of locomotion on the final day compared to water drinking control animals (sedation). These effects occurred despite no differences in mean g/kg ethanol intake on the first and last DID access days.
There are several interpretations of these data that merit discussion. First, it is possible that the acute stimulant response observed on day 1 was the result of the relative novelty of the sipper tube, ethanol solution, or a combination of these two novel stimuli. Similarly, the novelty of these stimuli might have combined synergistically with the pharmacological effects of ethanol to produce this stimulant response. Future experiments might incorporate a series of experimental habituation days to all of the animals prior to separating into ethanol vs. water consuming groups. Alternatively, the addition of a ‘WE’ group as was incorporated into the 2nd experiment, would allow for both within (day 1 vs. 14) and between (day 14 WW vs. WE) groups comparisons of this measure.
The day 14 DID-induced home cage locomotor depression was also a compelling observation. This result was particularly interesting given that animals generally displayed similar mean ethanol intakes across all 14 days of DID access. Given the current data, we speculate that increases in the rate at which ethanol is consumed might be critical to the development of such alterations. For example, on the first day of DID ethanol access in experiment 1 there was no difference in ethanol intake between the first and second half of the 2 hour session whereas by the end of the experiment (day 14) mice clearly drank more during the first half of the session (figure 1). Thus, it is plausible that repeated access to DID sessions lead to increases in the rate of consumption and subsequent decreases in locomotion. It is this repeated drinking-to-(locomotor) sedation that we speculate might drive the effects observed following experimenter administered ethanol. Nevertheless, without monitoring such variables concomitantly (without interfering with one or the other behaviors in the process) it is difficult to come to a more definitive answer.
Although hypnotic sensitivity to ethanol as assessed by the loss of righting reflex may not necessarily relate to ethanol’s locomotor sedative effects, data from long sleep (LS) and short-sleep (SS) mice bred for high and low sensitivity to the hypnotic effects of high doses of ethanol respectively, might provide some insight into the results of the current data (Elmer et al., 1990). In this study, LS mice responded operantly for ethanol at higher rates, and consumed more ethanol solution (resulting in mean BECs often greater than 100 mg/dl) than SS mice, indicating that genetic susceptibility to the sedative effects of ethanol may confer greater susceptibility to the maintenance of ethanol self-administration and intoxication. Additionally, the results of several studies using recombinant inbred mouse strains and their progenitors have suggested a negative genetic relationship between ethanol consumption and the locomotor effects of ethanol(Phillips et al., 1994, Phillips et al., 1995). For example, those strains of mice displaying the highest levels of ethanol consumption generally displayed 1) the greatest experimenter-induced acute locomotor sedative response and 2) the greatest negative change in this response; increased sedation following multiple ethanol challenges. Based on these data, sensitization to the sedative properties of ethanol might be expected to contribute to the genetic susceptibility of this strain to reliably and consistently drink to intoxication.
Alterations in Ethanol Pharmacokinetics
We did not observe any differences between groups in the level of ethanol in blood immediately following behavioral testing that might explain the ataxic/locomotor differences observed at this time point. However, BEC data 2 hours post ethanol challenge suggests that differences in the rate of ethanol metabolism due to repeated DID ethanol history were present. Interestingly, and contrary to experiments 2 and 3, there were no differences in ethanol pharmacokinetics resulting from repeated DID ethanol consumption in the first experiment. Although these null effects are not entirely clear given the evidence of metabolic tolerance in the other experiments, they may have been due in part to the two additional blood sampling time points. That is, removing blood repeatedly might have affected the ability of these mice to metabolize ethanol at a consistent rate due to alterations in the rate of blood flowor other ethanol/tissue distribution alterations (Norberg et al., 2003). Nevertheless, differences in BEC two hours following ethanol challenge observed in the final 2 experiments might suggest that alterations in ethanol pharmacokinetics contributes to the maintenance of DID ethanol consumption.
Conclusion
In conclusion, the current data add to the literature suggesting a role for the development of tolerance to the behavioral effects of ethanol induced by voluntary ethanol consumption. If these effects lead to (or are the direct result of) specific neuroadaptive processes underlying the maintenance of repeatedly engaging in excessive ethanol intake observed in human alcoholics, this model might serve as a powerful tool for determining such alterations. Ongoing work in our lab evaluating alterations in gene and protein expression in discrete brain regions following various degrees of exposure to DID ethanol intake will address this possibility directly. It is our hope that such data will provide a foundation by which to target binge-like ethanol intake using various pharmacological and intervention treatment strategies.
Acknowledgments
This work was supported by NIAAA grant #’s AA015434, AA016789 (S.L.B), AA018910 (E.M.M), and AA07462 (D.N.L.)
References
- BOEHM SL, 2ND, MOORE EM, WALSH CD, GROSS CD, CAVELLI AM, GIGANTE E, LINSENBARDT DN. Using drinking in the dark to model prenatal binge-like exposure to ethanol in C57BL/6J mice. Dev Psychobiol. 2008;50:566–78. doi: 10.1002/dev.20320. [DOI] [PMC free article] [PubMed] [Google Scholar]
- CRABBE JC. Sensitivity to ethanol in inbred mice: genotypic correlations among several behavioral responses. Behav Neurosci. 1983;97:280–9. doi: 10.1037//0735-7044.97.2.280. [DOI] [PubMed] [Google Scholar]
- CRABBE JC, JR, JOHNSON NA, GRAY DK, KOSOBUD A, YOUNG ER. Biphasic effects of ethanol on open-field activity: sensitivity and tolerance in C57BL/6N and DBA/2N mice. J Comp Physiol Psychol. 1982;96:440–51. doi: 10.1037/h0077898. [DOI] [PubMed] [Google Scholar]
- DUDEK BC, PHILLIPS TJ. Distinctions among sedative, disinhibitory, and ataxic properties of ethanol in inbred and selectively bred mice. Psychopharmacology (Berl) 1990;101:93–9. doi: 10.1007/BF02253724. [DOI] [PubMed] [Google Scholar]
- ELMER GI, MEISCH RA, GOLDBERG SR, GEORGE FR. Ethanol self-administration in long sleep and short sleep mice indicates reinforcement is not inversely related to neurosensitivity. J Pharmacol Exp Ther. 1990;254:1054–62. [PubMed] [Google Scholar]
- GILL K, DEITRICH RA. Acute tolerance to the ataxic effects of ethanol in short-sleep (SS) and long-sleep (LS) mice. Psychopharmacology (Berl) 1998;136:91–8. doi: 10.1007/s002130050543. [DOI] [PubMed] [Google Scholar]
- GRIEVE SJ, GRIFFITHS PJ, LITTLETON JM. Genetic influences on the rate of development of ethanol tolerance and the ethanol physical withdrawal syndrome in mice. Drug Alcohol Depend. 1979;4:77–86. doi: 10.1016/0376-8716(79)90042-5. [DOI] [PubMed] [Google Scholar]
- LE AD, KALANT H, KHANNA JM. Roles of intoxicated practice in the development of ethanol tolerance. Psychopharmacology (Berl) 1989;99:366–70. doi: 10.1007/BF00445559. [DOI] [PubMed] [Google Scholar]
- LE AD, KIIANMAA K. Characteristics of ethanol tolerance in alcohol drinking (AA) and alcohol avoiding (ANA) rats. Psychopharmacology (Berl) 1988;94:479–83. doi: 10.1007/BF00212841. [DOI] [PubMed] [Google Scholar]
- LINSENBARDT DN, BOEHM SL., 2ND Agonism of the endocannabinoid system modulates binge-like alcohol intake in male C57BL/6J mice: involvement of the posterior ventral tegmental area. Neuroscience. 2009 doi: 10.1016/j.neuroscience.2009.08.007. [DOI] [PMC free article] [PubMed] [Google Scholar]
- LINSENBARDT DN, MOORE EM, GROSS CD, GOLDFARB KJ, BLACKMAN LC, BOEHM SL., 2ND Sensitivity and tolerance to the hypnotic and ataxic effects of ethanol in adolescent and adult C57BL/6J and DBA/2J mice. Alcohol Clin Exp Res. 2009;33:464–76. doi: 10.1111/j.1530-0277.2008.00857.x. [DOI] [PMC free article] [PubMed] [Google Scholar]
- MOORE EM, BOEHM SL. Site-specific microinjection of baclofen into the anterior ventral tegmental area reduces binge-like ethanol intake in male C57BL/6J mice. Behav Neurosci. 2009;123:555–63. doi: 10.1037/a0015345. [DOI] [PMC free article] [PubMed] [Google Scholar]
- MOORE EM, SERIO KM, GOLDFARB KJ, STEPANOVSKA S, LINSENBARDT DN, BOEHM SL., 2ND GABAergic modulation of binge-like ethanol intake in C57BL/6J mice. Pharmacol Biochem Behav. 2007;88:105–13. doi: 10.1016/j.pbb.2007.07.011. [DOI] [PMC free article] [PubMed] [Google Scholar]
- NEWLIN DB, THOMSON JB. Alcohol challenge with sons of alcoholics: a critical review and analysis. Psychol Bull. 1990;108:383–402. doi: 10.1037/0033-2909.108.3.383. [DOI] [PubMed] [Google Scholar]
- NORBERG A, JONES AW, HAHN RG, GABRIELSSON JL. Role of variability in explaining ethanol pharmacokinetics: research and forensic applications. Clin Pharmacokinet. 2003;42:1–31. doi: 10.2165/00003088-200342010-00001. [DOI] [PubMed] [Google Scholar]
- PHILLIPS TJ, CRABBE JC, METTEN P, BELKNAP JK. Localization of genes affecting alcohol drinking in mice. Alcohol Clin Exp Res. 1994;18:931–41. doi: 10.1111/j.1530-0277.1994.tb00062.x. [DOI] [PubMed] [Google Scholar]
- PHILLIPS TJ, HUSON M, GWIAZDON C, BURKHART-KASCH S, SHEN EH. Effects of acute and repeated ethanol exposures on the locomotor activity of BXD recombinant inbred mice. Alcohol Clin Exp Res. 1995;19:269–78. doi: 10.1111/j.1530-0277.1995.tb01502.x. [DOI] [PubMed] [Google Scholar]
- RHODES JS, BEST K, BELKNAP JK, FINN DA, CRABBE JC. Evaluation of a simple model of ethanol drinking to intoxication in C57BL/6J mice. Physiol Behav. 2005;84:53–63. doi: 10.1016/j.physbeh.2004.10.007. [DOI] [PubMed] [Google Scholar]
- RHODES JS, FORD MM, YU CH, BROWN LL, FINN DA, GARLAND T, JR, CRABBE JC. Mouse inbred strain differences in ethanol drinking to intoxication. Genes Brain Behav. 2007;6:1–18. doi: 10.1111/j.1601-183X.2006.00210.x. [DOI] [PubMed] [Google Scholar]
- TABAKOFF B, RITZMANN RF. Acute tolerance in inbred and selected lines of mice. Drug Alcohol Depend. 1979;4:87–90. doi: 10.1016/0376-8716(79)90043-7. [DOI] [PubMed] [Google Scholar]
- WALLER MB, MCBRIDE WJ, LUMENG L, LI TK. Initial sensitivity and acute tolerance to ethanol in the P and NP lines of rats. Pharmacol Biochem Behav. 1983;19:683–6. doi: 10.1016/0091-3057(83)90345-3. [DOI] [PubMed] [Google Scholar]