Abstract
BACKGROUND
In colorectal cancer (CRC), DNA methylation anomalies define distinct subgroups termed CpG Island Methylator Phenotype 1, (CIMP1), CIMP2 and CIMP-negative. We evaluated the role of this classification in predicting recurrences and disease-free survival (DFS) in resected stage 3 CRC.
METHODS
We analyzed sporadic cancers from 161 patients. We used bisulfite-pyrosequencing to examine methylation of 2 global DNA methylation markers (LINE-1, Alu) and 9 loci (MINT1, MINT2, MINT31, P16, hMLH1, P14, SFRP1, SFRP2, and WNT5A). We assayed for mutations in BRAF and KRAS.
RESULTS
Gene hypermethylation clustered in discrete groups of patients indicating the presence of CIMP. K-means clustering analysis identified 3 discrete subgroups; CIMP1 (N=22, 13.7%) associated with proximal location and BRAF mutations, CIMP2 (N=40, 24.8%) associated with KRAS mutations and CIMP-negative (N=99, 61.5%) associated with distal location. In proximal CRC, CIMP1 was correlated with a higher recurrence rate (53% for CIMP1, 18% for CIMP2 and 26% for CIMP-negative) and a worse disease free survival (DFS) (P= .015). Also in proximal CRC, LINE-1 methylation was lower in patients who recurred compared to those who did not recur (P= .049). In multivariate analysis, CIMP1 and low LINE1 methylation were independent prognostic factors for DFS in proximal CRC (P= .008 for classification by K means clustering analysis, P= .040 for LINE-1 methylation status).
CONCLUSIONS
DNA methylation is a useful biomarker of recurrence in resected stage 3 proximal but not distal CRC. However, as the number of CIMP1 cases was small in distal CRC, further study is required to validate our findings.
Keywords: Colon cancer, CpG Island Methylator Phenotype, LINE-1, Methylation biomarker
Cancer develops under the influence of genetic and epigenetic alternations.1, 2 DNA methylation is a main component of epigenetics, and the relationship between DNA methylation and carcinogenesis has been extensively studied in various cancers.1, 3 In cancer, DNA methylation has two main patterns. Cancer cells have decreased global methylation compared to normal cells,4, 5 which may be involved in genetic instability.6–8 LINE-1 methylation density is a good indicator of global methylation.9 Decreased LINE-1 methylation was associated with decreased survival in colorectal cancer.10 By contrast, there is an increased CpG Island methylation density in the promoter regions of tumor suppressor genes.1, 3 This hypermethylation causes decreased gene expression and is involved in carcinogenesis through silencing tumor-suppressor genes.
DNA methylation has been extensively studied in colon cancer.3, 11 Colon cancer can be divided into subsets according to DNA methylation patterns: CpG Island methylator phenotype positive (CIMP+) and CIMP- group. CIMP + cancers show distinct clinicopathologic features including female preponderance, older age, proximal colon location, mucinous and poorly differentiated histology.11 They are associated with microsatellite instability (MSI) and BRAF mutations.12 Although, CIMP+ cancers share many clinical features with MSI related cancers, their prognosis is different. CIMP+ cancers are associated with poor prognosis,13, 14 while MSI related cancers have a good prognosis.15, 16 Multiple genes may be responsible for the prognostic effects of DNA methylation in CRC, including WNT pathway genes. Abnormal activation of the WNT/beta catenin pathway is frequently found in gastrointestinal cancers17, 18 and colon carcinogenesis.17, 19, 20 One of the important mechanisms of WNT pathway activation is the decreased production of gene products which have an inhibitory effect on WNT pathway. SFRP, DKK and WNT5A are recognized to be WNT pathway antagonists21. The promoter region of WNT5A is frequently methylated in colon cancer tissue, and preserved WNT5A expression was reported to be associated with good prognosis in colon cancer22 while promoter methylation of WNT pathway antagonists was associated with poor prognosis.23, 24 There are embryologic, histological, physiologic and biochemical differences between proximal colon and distal colons.25, 26 Proximal colon consists of the cecum, ascending colon, and proximal 2/3 of the transverse colon. It develops from the embryonic midgut, while the distal colon develops from the embryonic hindgut. There is a difference in a gene expression between the proximal and distal colons. More than a 1000 genes were differentially expressed in the adult colon, but only 87 genes differentially expressed in the fetal stage.27 Of these, around 70% of the genes were highly expressed in distal colon. Based on these results, it is reasonable to consider that proximal colon and distal colons are physiologically distinct, and that the cancers that arise from them could also be quite different.
In this study, we evaluate the potential role of DNA promoter methylation biomarkers, genetic biomarkers (KRAS, BRAF mutation) and global DNA methylation biomarkers to predict recurrence and disease-free survival (DFS) according to the cancer location in curatively resected stage III colon cancer.
MATERIALS AND METHODS
Tissue Samples
We used 161 stage III colon adenocarcinoma specimens obtained at the time of curative resection at the Yonsei Cancer Center, Severance Hospital (Seoul, Korea) from 1997 to 2006. The specimens were immediately frozen in liquid nitrogen and stored at −80°C. We excluded cases of hereditary colon cancer. The collection of samples was approved by the Severance Institutional Review Board, and informed consent was obtained from patients to use their surgical specimens and clinicopathologic data for research purposes.
Assay of DNA methylation
Bisulfite-treated genomic DNA was used to evaluate the methylation status of 2 global methylation markers (LINE-1, Alu) and the methylation status of 9 CpG island (MINT1, MINT2, MINT31, hMLH1, p16, p14, SFRP1, SFRP2 and WNT5A). Bisulfite treatment of DNA was performed with an EpiTect bisulfite kit (QIAGEN, Valencia, CA) according to the manufacturer’s protocol. 1μl of bisulfite-treated DNA was used as a template in subsequent polymerase chain reactions (PCR). All PCR assays included a denaturation step at 95°C for 30 seconds, followed by an annealing step at various temperatures for 30 seconds, and an extension step at 72°C for 30 seconds. After PCR, the biotinylated strand was captured on streptavidin-coated beads (Amersham Bioscience, Uppsala, Sweden) and incubated with sequencing primers. Pyrosequencing was performed with PSQ HS 96 Gold single-nucleotide polymorphism reagents on a PS QHS 96 pyrosequencing machine (Biotage, Uppsala, Sweden). The protocol for pyrosequencing has been described in detail previously28. Pyrosequencing quantitatively measures the methylation status of several CpG sites in a given sequence. Therefore, we could determine the mean percentage of methylation of detected sites as a representative value.
Assay of BRAF and KRAS mutations
Genomic DNA was used to study the mutation status of BRAF, KRAS genes. Mutation status was determined with pyrosequencing assays. Mutations of BRAF codon 600, KRAS codon 12 and 13 were determined by a Pyrosequencing machine (Biotage, Uppsala, Sweden).29, 30
Data Analysis and Statistics
Pyrosequencing presents the methylation level and mutation level as a continuous value. Methylation status of CpG Island markers was analyzed as either continuous or categorical variables (negative: methylation level <15%, positive: methylation level ≥15%). Methylation status of global methylation markers was analyzed as either continuous or categorical variables (divided into two groups by the median value). Mutation status was analyzed as a categorical variable (wild type status: mutation level <15%, mutation: mutation level ≥15%). All clinicopathologic variables except age were used as categorical variables. Differences in continuous variables between 2 groups were evaluated by the Student’s t test and differences in categorical variables were evaluated by the chi-square test. Correlations of methylation levels between methylation biomarkers were analyzed by calculating Spearman’s nonparametric correlation coefficients (r and P, respectively). K-means clustering on the basis of both genetic and epigenetic profiling was performed to identify potential discrete subgroups among colon cancer patients. K means clustering analysis was conducted using ArrayTrack version 3.4.0 (NCTR/FDA, AR, USA). DFS (DFS) was measured from the date of resection of colon cancer to the date of event or the last follow up date before December 31, 2008. Event was defined as recurrence, death due to any cause, or development of a 2nd primary in colorectal cancer. The median follow up duration was 46 months. The Kaplan–Meier method was used to calculate and display disease free survival curves, and log-rank test was performed to determine differences among all groups. Cox proportional hazards regression method was used to determine independent prognostic factors.
All p values are 2 sided, and a P value of less than 0.05 was considered statistically significant.
RESULTS
Clinicopathologic Characteristics
We studied 161 patients selected based on sample availability. Mean age was 61 years (range 31–84), 93 patients were males (58%), and 76 tumors (47%) were located in the proximal colon. All patients were treated with postoperative adjuvant chemotherapy consisting of 5-fluorouracil and leucovorin. Among the 156 patients with adequate follow up data, there were 48 recurrences (31%), 23 in proximal colon and 25 in distal colon. The clinicopathologic features of the patients analyzed by tumor location are summarized in Table 1. Overall, there were no differences in sex, age, histology, differentiation, T stage, N stage and recurrence rate between proximal colon cancer and distal colon cancers.
Table 1.
Clinicopathologic characteristics according to tumor location
| Location Proximal | Distal | p value | |
|---|---|---|---|
| No | 76 | 85 | |
| Age | |||
| mean | 61.9 | 60 | 0.315 |
| (range) | (31–84) | (31–82) | |
| Sex | |||
| Male | 44 | 49 | 0.975 |
| Female | 32 | 36 | |
| Histology | |||
| Adeno | 70 | 83 | 0.106 |
| Mucinous | 6 | 2 | |
| Differentiation | |||
| WD | 8 | 10 | 0.824 |
| MD | 58 | 70 | |
| PD | 4 | 3 | |
| T stage | |||
| 1 | 1 | 2 | 0.664 |
| 2 | 5 | 10 | |
| 3 | 55 | 58 | |
| 4 | 15 | 15 | |
| N stage | |||
| 1 | 54 | 57 | 0.585 |
| 2 | 22 | 28 | |
| Recurrence | |||
| No | 52 | 56 | 0.979 |
| Yes | 23 | 25 | |
WD, well differentiated; MD, moderately differentiated; PD, Poorly differentiated; Adeno, adenocarcinoma: Mucinous, mucinous adenocarcinoma
Mutations of BRAF, KRAS and Microsatellites
Mutation status of BRAF at codon 600 and KRAS at codon 12, 13 was determined by pyrosequencing. There were 7 cases (4.3%) with BRAF mutation, all located in the proximal colon. As for KRAS, 56 (34.8%) cases showed mutations, and these were not associated with age, gender, tumor location or histology. There was no case harboring both KRAS and BRAF mutations. Microsatellite instability (MSI) status was previously determined, and data were available on 91 patients. In these, MSI was present in 17 (18.7%), and was associated with proximal location.
Gene specific Methylation analysis
The methylation frequencies of the 9 genes analyzed were 17% for MINT1, 22% for MINT2, 19% for MINT31, 16% for P16, 6% for MLH1, 9% for P14, 54% for WNT5A, 93% for SFRP2 and 99% for SFRP1. Methylation of all of the genes showed significant positive correlations between each other (not shown), consistent with the presence of CIMP in a subset of cases. Seven genes (all except SFRP1 and SFRP2) showed strong correlations and appeared to be excellent CIMP markers. For descriptive purposes, we defined CIMP as positive when 3 or more among the 7 markers were positive. Based on this definition, 29 cases (18%) were CIMP+. As previously reported,11, 12 CIMP was significantly associated with female sex, proximal colon cancer, BRAF mutation and microsatellite instability high (MSI-H).
K-means Clustering Based on Combined Genetic and Epigenetic Information
We have previously reported that colon cancer falls into three distinct groups based on combined genetic and epigenetic analysis30. In the current data set, three distinct groups were similarly identified by K-mean clustering analysis of the promoter methylation status of the 9 genes and the mutation status of BRAF and KRAS (Fig. 1). The clinicopathologic and molecular features of the 3 groups are summarized in Table 2. The CIMP1 (methylation high) group was characterized by a relatively high rate of BRAF mutation and MSI-H, and most cases (82%) were located in proximal colon. The CIMP2 group was characterized by a high rate of KRAS mutation while the CIMP-negative group had rare mutations and low levels of methylation. CIMP2 and CIMP-negative cases were slightly more common in distal cancers.
FIGURE 1.

K-means clustering analysis based on genetic and epigenetic information. Ninety-nine cases were classified as group 1 (low methylation), 40 cases were classified as group 2 (intermediate methylation), and 22 cases were classified as group 3 (high methylation).
Table 2.
Clinicopathologic characteristics according to groups by K means clustering analysis
| Group 1:low methyl | 2: intermediate | 3:high methyl | p value | |
|---|---|---|---|---|
| No | 99 | 40 | 22 | |
| Age | ||||
| mean | 60.8 | 59.3 | 64.3 | 0.257 |
| Sex | ||||
| Male | 60 | 22 | 11 | 0.608 |
| Female | 39 | 18 | 11 | |
| Site | ||||
| Proximal | 42 | 16 | 18 | 0.002* |
| Distal | 57 | 24 | 4 | |
| Histology | ||||
| Adeno | 94 | 38 | 21 | 0.995 |
| Mucinous | 5 | 2 | 1 | |
| Differentiation | ||||
| WD | 12 | 5 | 1 | 0.646 |
| MD | 78 | 32 | 18 | |
| PD | 4 | 1 | 2 | |
| T stage | ||||
| 1 | 3 | 0 | 0 | 0.344 |
| 2 | 8 | 5 | 2 | |
| 3 | 74 | 26 | 13 | |
| 4 | 14 | 9 | 7 | |
| N stage | ||||
| 1 | 70 | 26 | 15 | 0.802 |
| 2 | 29 | 14 | 7 | |
| Recurrence | ||||
| No | 67 | 29 | 12 | 0.424 |
| Yes | 28 | 11 | 9 | |
| LINE1 | ||||
| mean±SD | 50.1±8.4 | 50.4±4.6 | 53.6±6.2 | 0.14 |
| MSI status** | ||||
| MSS or MSI-L | 47 | 21 | 6 | 0.034* |
| MSI-H | 10 | 2 | 5 | |
WD, well differentiated; MD, moderately differentiated; PD, Poorly differentiated; Adeno, adenocarcinoma: Mucinous, mucinous adenocarcinoma
significant difference among groups by K means clustering analysis
available for a subset of patients only
Given the reproducibility of the classification of colon cancer into three groups, we evaluated recurrence rates and DFS by this classification. Overall, CIMP1 cases had the highest rate of recurrences (9/21 or 42.9% compared to 39/135 or 28.9% in CIMP2 and CIMP-negative) but this was not statistically significant. Because of the strong site imbalance in distribution of cases, we evaluated DFS by site. There was a significant DFS difference among the 3 groups in proximal colon cancer (Fig. 2a), showing the worst survival in CIMP1 (HR; 3.9, 95% CI; 1.08–14.35, P= .015). This difference was not observed in distal colon cancer (P= .304) (Fig. 2b).
FIGURE 2.
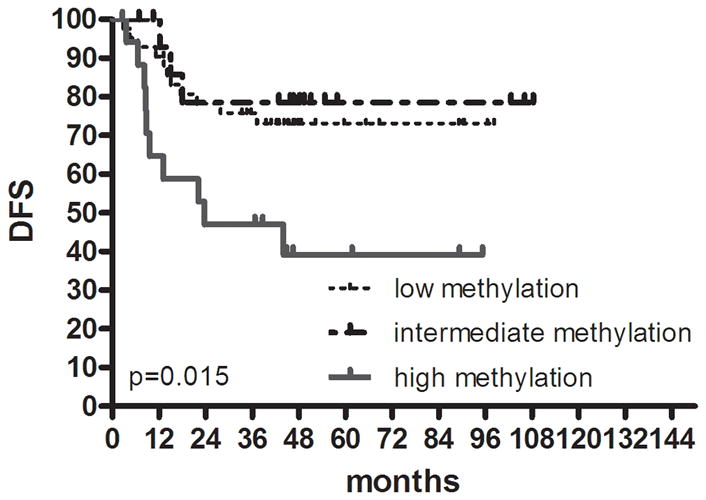
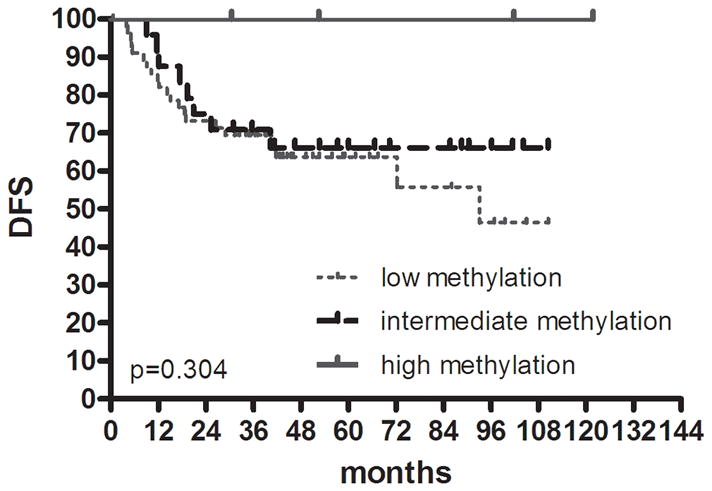
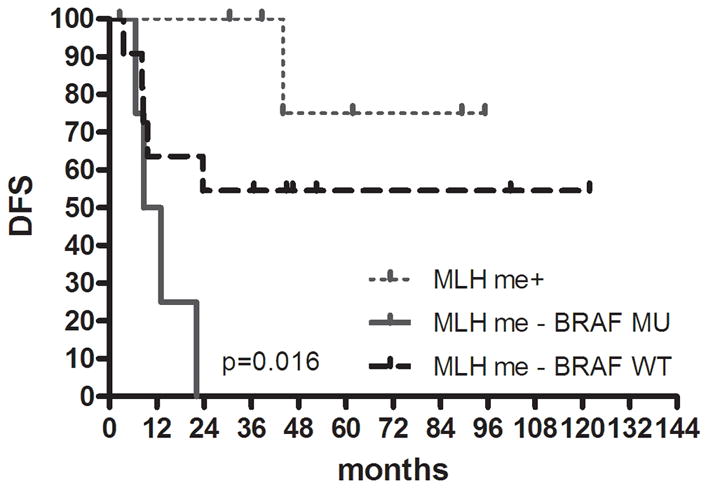
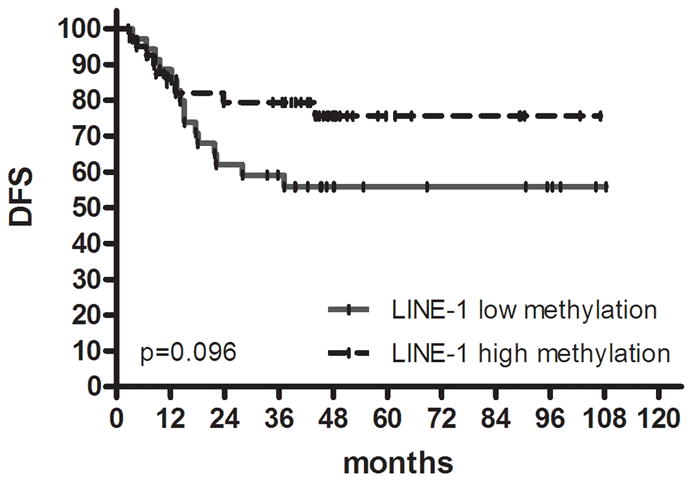
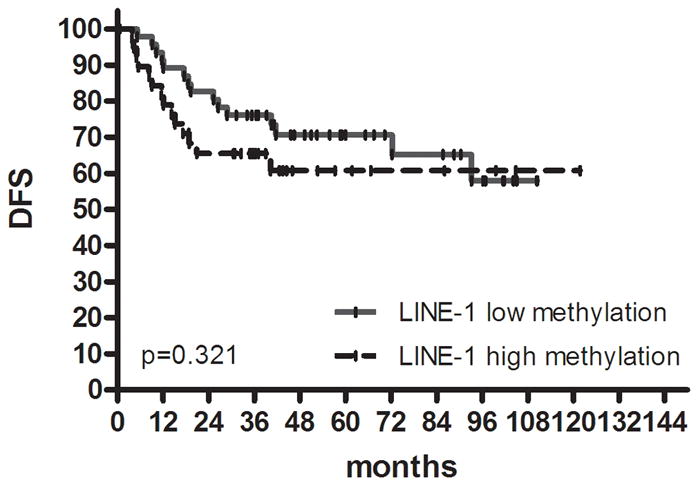
Kaplan-Meier survival estimates in colon cancer. DFS in (a) proximal colon cancer and (b) distal colon cancer according to groups classified by K-means clustering analysis using genetic and epigenetic information. DFS in (c) colon cancer according to groups classified by MLH methylation and BRAF mutation status in the high methylation group. DFS in (d) proximal colon cancer and (e) distal colon cancer according to groups classified by LINE-1 methylation.
CIMP1 is associated with both MLH1 methylation and BRAF mutation. Previous data suggested that MLH1 methylation is associated with good prognosis, while BRAF mutation leads to poor prognosis31. To test this, we subdivided CIMP1 into 3 groups (MLH1 methylation positive, N=7; MLH1 methylation negative and BRAF mutation positive, N=4; neither neither MLH1 methylation nor BRAF mutation, N=11) and evaluated DFS. Despite the very small number of patients in each group, there was a significant DFS difference between the 3 subgroups, showing the best survival in MLH methylation+ patients and the worst survival in MLH methylation-and BRAF mutated patients (P= .016) (Fig. 2c).
Global DNA Methylation Analysis
We evaluated global DNA methylation using LINE-1 and Alu methylation. High methylation of LINE-1 was significantly associated with CIMP1, high methylation of Alu, low methylation of SFRP1 and low methylation of SFRP2. No differences were noted in age, gender, tumor location, histology, KRAS status and MSI status according to LINE-1 methylation status. In proximal colon cancer, the methylation level of LINE-1 was significantly lower in recurred patients than in non-recurred patients (non-recurred patients; 52.3±7.2 vs. recurred patients; 48.5±8.6, P= .049) (Fig. 3). No difference was found in distal colon cancer. Low methylation of LINE-1 in proximal colon cancer was associated with a trend towards shorter DFS (P= .097). In distal colon cancer, there was no difference in DFS survival according to methylation status of LINE-1 (Fig. 2d, e).
FIGURE 3.
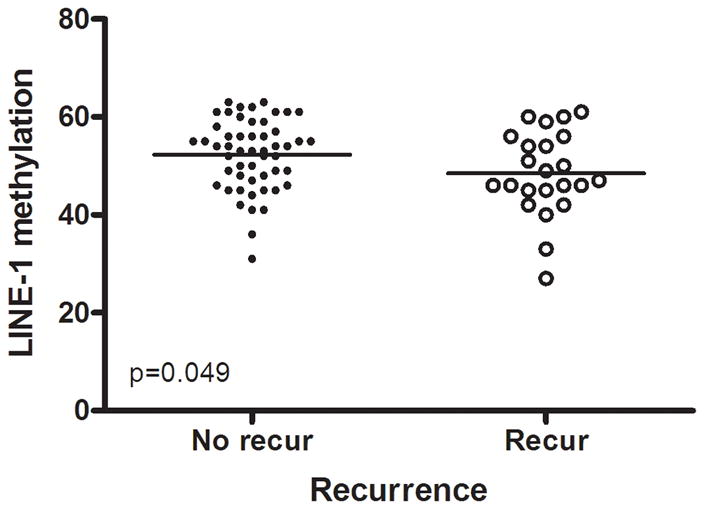
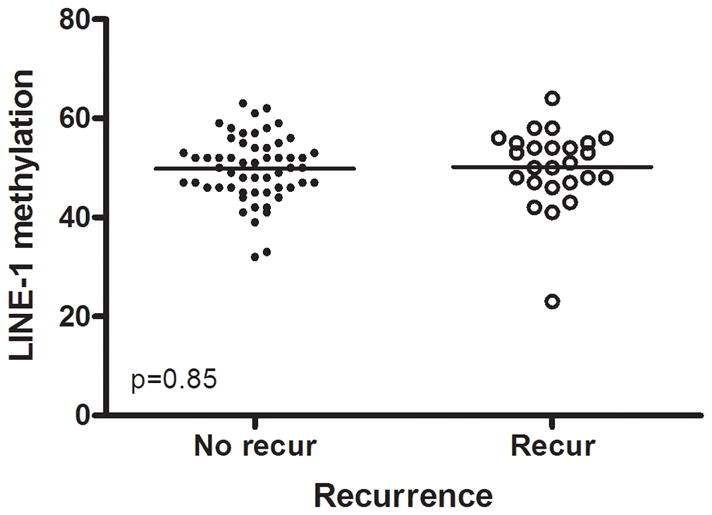
Methylation levels of LINE-1 according to recurrence. In proximal colon cancer, the methylation level of LINE-1 was significantly lower in recurred patients than in non-recurred patients (a), but not in distal cancer (b).
Multivariate Analysis of DFS
Table 3 shows multivariate analysis that included known clinicopathologic characteristics associated with DFS (T stage, N stage, tumor location, CEA) and other potential molecular biomarkers (LINE-1 methylation status, BRAF status, KRAS status and grouping by K means clustering analysis of genetic and epigenetic information), LINE-1 methylation and grouping by K means clustering analysis were independent prognostic factors for DFS in proximal colon cancer (P= .040 for LINE-1 methylation status, P=0.008 for grouping by K means clustering analysis). N stage was the only independent prognostic factor in distal colon cancer (P= .004). In multivariate analysis using classification based on epigenetic information alone (CIMP) instead of using k-means clusters, BRAF status, LINE-1 methylation status and CIMP status were independent prognostic factors for DFS in proximal colon cancer (P= .035 for BRAF status, P= .007 for LINE-1 methylation status, P= .011 for CIMP status) but not in distal colon cancer.
Table 3.
Multivariate Cox regression model of prognostic factors of DFS in colon cancer patients according to location
| HR | 95% CI | p | |
|---|---|---|---|
| All colon | |||
| N stage | 0.001 | ||
| N1 | 1 | ||
| N2 | 2.56 | 1.48–4.43 | |
| Proximal colon | |||
| LINE-1 methylation | 0.040 | ||
| high | 1 | ||
| low | 2.43 | 1.04–5.64 | |
| K means clustering | 0.008 | ||
| Group 1 | 1.28 | 0.36–4.59 | |
| Group 2 | 1 | ||
| Group 3 | 4.44 | 1.22–16.25 | |
| Distal colon | |||
| N stage | 0.004 | ||
| N1 | 1 | ||
| N2 | 3.01 | 1.43–6.35 | |
Abbreviations: HR, hazard ratio; CI, confidence interval
DISCUSSION
In this study, we show that methylation biomarkers play a differential role in CRC recurrence and DFS by tumor location. Using gene methylation and mutation, we could cluster cases into three distinct groups. The high methylation group demonstrated a significant association with CIMP+, BRAF mutation and MSI-H. The intermediate methylation group showed a significant association with high frequency of KRAS mutation. These molecular features were almost the same as those that we previously reported30 in a different population of patients, demonstrating the reproducibility of this classification. Methylation related biomarkers influenced recurrence and DFS in resected stage III proximal colon cancer, but not in distal colon cancer. The study adds to the growing literature on differences between proximal and distal cancers, and suggests that these may have to be taken into account in management and clinical trials in this disease.
CIMP negative colon cancers are evenly distributed throughout the colon, but CIMP1 colon cancers are principally located in proximal colon.32 The cause of this difference is unknown. It may be that site-specific carcinogens or differences in the cell of origin may explain this variation in DNA methylation. Still, only about half of proximal cancers are CIMP1, and our data now suggest that DNA methylation may help in classification of these patients for prognostic purposes. A high risk for recurrence in stage III CRC may lead to more intensive surveillance and novel adjuvant therapy strategies. We have previously reported that the methylation status of several CIMP markers was associated with poor survival in stage IV CRC14 but it is not yet known whether this is modulated by site. One of the paradoxical findings on the effects of CIMP on survival is the fact that CIMP1 is also associated with MLH1 methylation, which results in MSI. MSI is generally a favorable prognostic factor in CRC.15, 16 MSI was relatively rare in the population of patients we studied, which explains why the dominant effect of CIMP was negative on DFS. In a small, pilot analysis, we did find that MLH1 methylated cases a good outcome, while CIMP1, MLH1 unmethylated cases had a strikingly high recurrence rate, regardless of BRAF mutation. It is interesting to consider why the two groups of CIMP1 cases (MLH1 methylated/unmethylated) would have such opposing consequences. An attractive hypothesis is that the poor prognosis is imparted by DNA hypermethylation of genes such as WNT5A that result in a more aggressive behavior (increased invasion for example). In turn, this invasive phenotype may be countered by induction of an immune response that is most pronounced in MSI positive cases.33
Here, we confirm a previous report on the prognostic impact of LINE1 methylation on outcome of CRC,10 but show that this is also limited to proximal cancers. Others have examined the effect of global DNA methylation on clinical outcomes in various cancers. In one study, the level of global DNA methylation was significantly lower in prostate cancer than in the normal prostate, but there was no difference according to recurrence.34 In ovarian cancer, the level of LINE-1 methylation was significantly lower than in normal tissue and there was a shortened survival in the low methylation group35. The mechanisms by which low levels of LINE-1 methylation are associated with a poor outcome remain to be determined. Possibilities include association with genomic instability, or with activation of expression of selected genes.
It is interesting to consider why DNA methylation was associated with recurrences in proximal cancers but not in distal cancers. A simple possibility relates to the rarity of CIMP1 cases in distal cancer, which limits our power to detect a prognostic impact there. Larger studies should address this issue. It is also possible that some other molecular marker, not measured here, has a dominant effect on recurrences and thus negates the effect of methylation differences on outcomes. Indeed, deletions of chromosome 18 are associated with recurrences in stage III CRC,36 and these are more common in distal cancers and CIMP-negative cases.37, 38 Thus, it may be that DNA methylation is a dominant prognostic factor in proximal cancers, while genetic instability is a dominant prognostic factor in distal cancers. Our studies and these hypotheses, which need to be confirmed in a larger population, pave the way for individualized management of stage III CRC.
In summary, methylation biomarkers such as methylation of WNT5A, CIMP markers and LINE-1 can predict disease recurrence and DFS in resected, stage III proximal colon cancer, but not in distal cancers. However, as the number of CIMP1 cases was small in distal CRC, further study is required to validate our findings. Classification of CRC by both genetic and epigenetic profiles will likely improve the capability to predict prognosis and to apply tailored therapy in this disease, but the classification will also have to take into account differences between proximal and distal cancers.
Acknowledgments
Source of Support
This work was supported by National Institutes of Health grant CA098006 and a grant of the Korea Health 21 R&D Project, Ministry of Health & Welfare, Republic of Korea. (0405-BC01-0604-0002). JPI is an American Cancer Society Clinical Research professor supported by a generous gift from the F. M. Kirby Foundation.
Footnotes
Financial Disclosure
The authors made no disclosures
References
- 1.Baylin SB, Hoppener JW, de Bustros A, Steenbergh PH, Lips CJ, Nelkin BD. DNA methylation patterns of the calcitonin gene in human lung cancers and lymphomas. Cancer Res. 1986;46:2917–2922. [PubMed] [Google Scholar]
- 2.Issa JP. Colon cancer: it’s CIN or CIMP. Clin Cancer Res. 2008;14:5939–5940. doi: 10.1158/1078-0432.CCR-08-1596. [DOI] [PubMed] [Google Scholar]
- 3.Issa JP, Ottaviano YL, Celano P, Hamilton SR, Davidson NE, Baylin SB. Methylation of the oestrogen receptor CpG island links ageing and neoplasia in human colon. Nat Genet. 1994;7:536–540. doi: 10.1038/ng0894-536. [DOI] [PubMed] [Google Scholar]
- 4.Feinberg AP, Vogelstein B. Hypomethylation distinguishes genes of some human cancers from their normal counterparts. Nature. 1983;301:89–92. doi: 10.1038/301089a0. [DOI] [PubMed] [Google Scholar]
- 5.Lu LJ, Randerath E, Randerath K. DNA hypomethylation in Morris hepatomas. Cancer Lett. 1983;19:231–239. doi: 10.1016/0304-3835(83)90159-3. [DOI] [PubMed] [Google Scholar]
- 6.Gaudet F, Hodgson JG, Eden A, et al. Induction of tumors in mice by genomic hypomethylation. Science. 2003;300:489–492. doi: 10.1126/science.1083558. [DOI] [PubMed] [Google Scholar]
- 7.Matsuzaki K, Deng G, Tanaka H, Kakar S, Miura S, Kim YS. The relationship between global methylation level, loss of heterozygosity, and microsatellite instability in sporadic colorectal cancer. Clin Cancer Res. 2005;11:8564–8569. doi: 10.1158/1078-0432.CCR-05-0859. [DOI] [PubMed] [Google Scholar]
- 8.Rodriguez J, Frigola J, Vendrell E, et al. Chromosomal instability correlates with genome-wide DNA demethylation in human primary colorectal cancers. Cancer Res. 2006;66:8462–9468. doi: 10.1158/0008-5472.CAN-06-0293. [DOI] [PubMed] [Google Scholar]
- 9.Yang AS, Estecio MR, Doshi K, Kondo Y, Tajara EH, Issa JP. A simple method for estimating global DNA methylation using bisulfite PCR of repetitive DNA elements. Nucleic Acids Res. 2004;32:e38. doi: 10.1093/nar/gnh032. [DOI] [PMC free article] [PubMed] [Google Scholar]
- 10.Ogino S, Nosho K, Kirkner GJ, et al. A cohort study of tumoral LINE-1 hypomethylation and prognosis in colon cancer. J Natl Cancer Inst. 2008;100:1734–1738. doi: 10.1093/jnci/djn359. [DOI] [PMC free article] [PubMed] [Google Scholar]
- 11.Toyota M, Ahuja N, Ohe-Toyota M, Herman JG, Baylin SB, Issa JP. CpG island methylator phenotype in colorectal cancer. Proc Natl Acad Sci U S A. 1999;96:8681–8686. doi: 10.1073/pnas.96.15.8681. [DOI] [PMC free article] [PubMed] [Google Scholar]
- 12.Weisenberger DJ, Siegmund KD, Campan M, et al. CpG island methylator phenotype underlies sporadic microsatellite instability and is tightly associated with BRAF mutation in colorectal cancer. Nat Genet. 2006;38:787–793. doi: 10.1038/ng1834. [DOI] [PubMed] [Google Scholar]
- 13.Ward RL, Cheong K, Ku SL, Meagher A, O’Connor T, Hawkins NJ. Adverse prognostic effect of methylation in colorectal cancer is reversed by microsatellite instability. J Clin Oncol. 2003;21:3729–3736. doi: 10.1200/JCO.2003.03.123. [DOI] [PubMed] [Google Scholar]
- 14.Shen L, Catalano PJ, Benson AB, 3rd, O’Dwyer P, Hamilton SR, Issa JP. Association between DNA methylation and shortened survival in patients with advanced colorectal cancer treated with 5-fluorouracil based chemotherapy. Clin Cancer Res. 2007;13:6093–6098. doi: 10.1158/1078-0432.CCR-07-1011. [DOI] [PMC free article] [PubMed] [Google Scholar]
- 15.Ribic CM, Sargent DJ, Moore MJ, et al. Tumor microsatellite-instability status as a predictor of benefit from fluorouracil-based adjuvant chemotherapy for colon cancer. N Engl J Med. 2003;349:247–257. doi: 10.1056/NEJMoa022289. [DOI] [PMC free article] [PubMed] [Google Scholar]
- 16.Kohonen-Corish MR, Daniel JJ, Chan C, et al. Low microsatellite instability is associated with poor prognosis in stage C colon cancer. J Clin Oncol. 2005;23:2318–2324. doi: 10.1200/JCO.2005.00.109. [DOI] [PubMed] [Google Scholar]
- 17.Morin PJ, Sparks AB, Korinek V, et al. Activation of beta-catenin-Tcf signaling in colon cancer by mutations in beta-catenin or APC. Science. 1997;275:1787–1790. doi: 10.1126/science.275.5307.1787. [DOI] [PubMed] [Google Scholar]
- 18.Taketo MM. Wnt signaling and gastrointestinal tumorigenesis in mouse models. Oncogene. 2006;25:7522–7530. doi: 10.1038/sj.onc.1210058. [DOI] [PubMed] [Google Scholar]
- 19.Rubinfeld B, Souza B, Albert I, et al. Association of the APC gene product with beta-catenin. Science. 1993;262:1731–1734. doi: 10.1126/science.8259518. [DOI] [PubMed] [Google Scholar]
- 20.Su LK, Vogelstein B, Kinzler KW. Association of the APC tumor suppressor protein with catenins. Science. 1993;262:1734–1737. doi: 10.1126/science.8259519. [DOI] [PubMed] [Google Scholar]
- 21.Kawano Y, Kypta R. Secreted antagonists of the Wnt signalling pathway. J Cell Sci. 2003;116:2627–2634. doi: 10.1242/jcs.00623. [DOI] [PubMed] [Google Scholar]
- 22.Dejmek J, Dejmek A, Safholm A, Sjolander A, Andersson T. Wnt-5a protein expression in primary dukes B colon cancers identifies a subgroup of patients with good prognosis. Cancer Res. 2005;65:9142–9146. doi: 10.1158/0008-5472.CAN-05-1710. [DOI] [PubMed] [Google Scholar]
- 23.Martin V, Agirre X, Jimenez-Velasco A, et al. Methylation status of Wnt signaling pathway genes affects the clinical outcome of Philadelphia-positive acute lymphoblastic leukemia. Cancer Sci. 2008;99:1865–1868. doi: 10.1111/j.1349-7006.2008.00884.x. [DOI] [PMC free article] [PubMed] [Google Scholar]
- 24.Yu J, Tao Q, Cheng YY, et al. Promoter methylation of the Wnt/beta-catenin signaling antagonist Dkk-3 is associated with poor survival in gastric cancer. Cancer. 2009;115:49–60. doi: 10.1002/cncr.23989. [DOI] [PubMed] [Google Scholar]
- 25.Iacopetta B. Are there two sides to colorectal cancer? Int J Cancer. 2002;101:403–408. doi: 10.1002/ijc.10635. [DOI] [PubMed] [Google Scholar]
- 26.Bufill JA. Colorectal cancer: evidence for distinct genetic categories based on proximal or distal tumor location. Ann Intern Med. 1990;113:779–788. doi: 10.7326/0003-4819-113-10-779. [DOI] [PubMed] [Google Scholar]
- 27.Glebov OK, Rodriguez LM, Nakahara K, et al. Distinguishing right from left colon by the pattern of gene expression. Cancer Epidemiol Biomarkers Prev. 2003;12:755–762. [PubMed] [Google Scholar]
- 28.Colella S, Shen L, Baggerly KA, Issa JP, Krahe R. Sensitive and quantitative universal Pyrosequencing methylation analysis of CpG sites. Biotechniques. 2003;35:146–150. doi: 10.2144/03351md01. [DOI] [PubMed] [Google Scholar]
- 29.Ogino S, Kawasaki T, Brahmandam M, et al. Sensitive sequencing method for KRAS mutation detection by Pyrosequencing. J Mol Diagn. 2005;7:413–421. doi: 10.1016/S1525-1578(10)60571-5. [DOI] [PMC free article] [PubMed] [Google Scholar]
- 30.Shen L, Toyota M, Kondo Y, et al. Integrated genetic and epigenetic analysis identifies three different subclasses of colon cancer. Proc Natl Acad Sci U S A. 2007;104:18654–18659. doi: 10.1073/pnas.0704652104. [DOI] [PMC free article] [PubMed] [Google Scholar]
- 31.Samowitz WS, Sweeney C, Herrick J, et al. Poor survival associated with the BRAF V600E mutation in microsatellite-stable colon cancers. Cancer Res. 2005;65:6063–6069. doi: 10.1158/0008-5472.CAN-05-0404. [DOI] [PubMed] [Google Scholar]
- 32.Toyota M, Ohe-Toyota M, Ahuja N, Issa JP. Distinct genetic profiles in colorectal tumors with or without the CpG island methylator phenotype. Proc Natl Acad Sci U S A. 2000;97:710–715. doi: 10.1073/pnas.97.2.710. [DOI] [PMC free article] [PubMed] [Google Scholar]
- 33.Dolcetti R, Viel A, Doglioni C, et al. High prevalence of activated intraepithelial cytotoxic T lymphocytes and increased neoplastic cell apoptosis in colorectal carcinomas with microsatellite instability. Am J Pathol. 1999;154:1805–1813. doi: 10.1016/S0002-9440(10)65436-3. [DOI] [PMC free article] [PubMed] [Google Scholar]
- 34.Brothman AR, Swanson G, Maxwell TM, et al. Global hypomethylation is common in prostate cancer cells: a quantitative predictor for clinical outcome? Cancer Genet Cytogenet. 2005;156:31–36. doi: 10.1016/j.cancergencyto.2004.04.004. [DOI] [PubMed] [Google Scholar]
- 35.Pattamadilok J, Huapai N, Rattanatanyong P, et al. LINE-1 hypomethylation level as a potential prognostic factor for epithelial ovarian cancer. Int J Gynecol Cancer. 2008;18:711–717. doi: 10.1111/j.1525-1438.2007.01117.x. [DOI] [PubMed] [Google Scholar]
- 36.Halling KC, French AJ, McDonnell SK, et al. Microsatellite instability and 8p allelic imbalance in stage B2 and C colorectal cancers. J Natl Cancer Inst. 1999;91:1295–1303. doi: 10.1093/jnci/91.15.1295. [DOI] [PubMed] [Google Scholar]
- 37.Azzoni C, Bottarelli L, Campanini N, et al. Distinct molecular patterns based on proximal and distal sporadic colorectal cancer: arguments for different mechanisms in the tumorigenesis. Int J Colorectal Dis. 2007;22:115–126. doi: 10.1007/s00384-006-0093-x. [DOI] [PubMed] [Google Scholar]
- 38.Ogino S, Kawasaki T, Kirkner GJ, Ohnishi M, Fuchs CS. 18q loss of heterozygosity in microsatellite stable colorectal cancer is correlated with CpG island methylator phenotype-negative (CIMP-0) and inversely with CIMP-low and CIMP-high. BMC Cancer. 2007;7:72. doi: 10.1186/1471-2407-7-72. [DOI] [PMC free article] [PubMed] [Google Scholar]


