

Abstract
DC-SIGN, a Ca2+-dependent transmembrane lectin, is found assembled in microdomains on the plasma membranes of dendritic cells. These microdomains bind a large variety of pathogens and facilitate their uptake for subsequent antigen presentation. In this study, DC-SIGN dynamics in microdomains were explored with several fluorescence microscopy methods and compared with dynamics for influenza hemagglutinin (HA), which is also found in plasma membrane microdomains. Fluorescence imaging indicated that DC-SIGN microdomains may contain other C-type lectins and that the DC-SIGN cytoplasmic region is not required for microdomain formation. Fluorescence recovery after photobleaching measurements showed that neither full-length nor cytoplasmically truncated DC-SIGN in microdomains appreciably exchanged with like molecules in other microdomains and the membrane surround, whereas HA in microdomains exchanged almost completely. Line-scan fluorescence correlation spectroscopy indicated an essentially undetectable lateral mobility for DC-SIGN but an appreciable mobility for HA within their respective domains. Single-particle tracking with defined-valency quantum dots confirmed that HA has significant mobility within microdomains, whereas DC-SIGN does not. By contrast, fluorescence recovery after photobleaching indicated that inner leaflet lipids are able to move through DC-SIGN microdomains. The surprising stability of DC-SIGN microdomains may reflect structural features that enhance pathogen uptake either by providing high-avidity platforms and/or by protecting against rapid microdomain endocytosis.
Introduction
Immature dendritic cells are highly endocytic professional antigen presenting cells that recognize pathogen-associated molecular patterns (PAMPs) to mediate antigen acquisition (1,2). Antigen recognition is facilitated by calcium-dependent antigen-capture receptors, called C-type lectins, that bind to high mannose structures present on the surfaces of numerous pathogens including viruses, bacteria, yeast, and parasites (3,4). One C-type lectin abundantly expressed on immature dendritic cells is DC-SIGN (dendritic cell-specific intercellular adhesion molecule-3-grabbing nonintegrin), also termed CD209. Other C-type lectins are also found on immature dendritic cells, including dectin-1 and macrophage mannose receptor (MMR, or CD206). The molecular details through which these transmembrane receptors mediate pathogen uptake are at present not fully understood. The work described in this article focuses primarily on DC-SIGN.
DC-SIGN is thought to exist as a tetramer in the plasma membrane through interactions of the extracellular repeat domains of the protein (5–7). Transmission electron microscopy and near-field scanning optical microscopy studies have determined that DC-SIGN molecules (presumably in the form of tetramers) in fixed cells are found in distinct protein microdomains on the nanometer scale (8–10). More recently, the distribution and dynamics of DC-SIGN microdomains on the plasma membranes of live dendritic cells were examined by using wide-field and confocal fluorescence microscopy techniques (11). The clustering of DC-SIGN is required for efficient pathogen binding and internalization (8). DC-SIGN clustering increases binding avidity, which may improve binding to small or multivalent ligands. The particular molecular interactions that mediate the clustering of DC-SIGN have not yet been determined and, furthermore, the dynamics of DC-SIGN molecules within microdomains have not been investigated.
In this article, we describe our findings regarding the dynamics of the general pathogen receptor DC-SIGN, and compare the dynamics to those of the well-studied influenza hemagglutinin (HA). We find that DC-SIGN in microdomains is partially colocalized with dectin-1, MMR, and clathrin. Multiple fluorescence microscopy techniques indicate that DC-SIGN is essentially immobilized in microdomains and that this stability is not dependent on the cytoplasmic tail of DC-SIGN. These findings contrast with HA, which also forms microdomains on the plasma membrane, but is laterally mobile within and outside microdomains and exchanges between these two regions. Although DC-SIGN shows no appreciable mobility within microdomains, lipids are free to move through these small regions. Taken together, our results strongly suggest that microdomains containing DC-SIGN have a complex, unexpected underlying molecular structure.
Materials and Methods
Due to space limitations, this section is described in the Supporting Material. Some references (11,22–28) also pertain to the methods.
Results and Discussion
DC-SIGN partially colocalizes with other transmembrane C-type lectins and clathrin
Previous work has shown that DC-SIGN appears as small (several hundred nanometers, but in many cases greater than optical resolution) clusters, or microdomains, on the plasma membranes of live and fixed dendritic cells (8–11). While it is clear that DC-SIGN ectopically expressed in fibroblasts and other cell types is sufficient for microdomain formation (11), we asked whether other C-type lectins mix with DC-SIGN in microdomains on dendritic cells.
Using widefield fluorescence microscopy, we studied colocalization on fixed, immature human dendritic cells of two candidate molecules, dectin-1 and macrophage mannose receptor (MMR), which are C-type lectin transmembrane proteins that might be expected to be contained in DC-SIGN domains. As shown in Fig. 1, A and B, both dectin-1 and MMR are also present in microdomains. These clusters sometimes, but not always, colocalize with DC-SIGN microdomains (quantified in Fig. S1 in the Supporting Material). Thus, DC-SIGN microdomains appear heterogeneous in the sense that they may or may not contain dectin-1 and/or MMR. Conversely, dectin-1 and MMR microdomains may or may not contain DC-SIGN. A variety of C-type lectin microdomains of different compositions could facilitate pathogen recognition, internalization, and subsequent antigen presentation in part by multiplexing signals from different pattern recognition receptors within the same domain.
Figure 1.
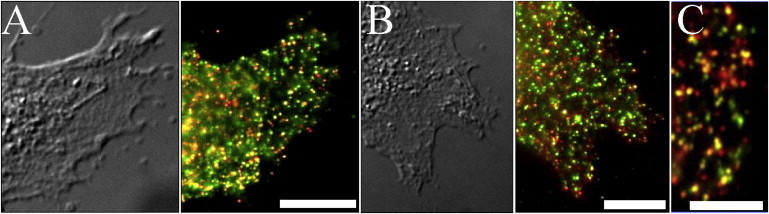
DC-SIGN partially colocalizes with other lectins and clathrin on immature dendritic cells. (A and B) Differential interference contrast image of a dendritic cell (left) and an overlay of the same area stained for DC-SIGN (DCN46 and anti-mouse-Alexa568) in red and either dectin-1 stained with AF1859 and anti-goat-Alexa488 (A) or CD206 stained with AF2534 and anti-goat-Alexa488 (B) in green (right). (C) Overlay of a dendritic cell stained for DC-SIGN (H-200 and anti-rabbit-Alexa488) in green and Clathrin LC (CON.1 and anti-mouse-Alexa568) in red. Areas of colocalization are yellow. Scale bars, 10 μm (A and B), 5 μm (C).
Clathrin-coated pits are thought to mediate the internalization of cargo-loaded DC-SIGN microdomains (12). As shown in Fig. 1 C, individual clathrin microdomains can be visualized on the cell periphery. Examining the images of these regions indicates that clathrin microdomains are sometimes, but far from always, colocalized with DC-SIGN domains. This result implies that clathrin is not required for DC-SIGN domain stability. However, it is possible that the DC-SIGN domains containing clathrin are more mature, and that DC-SIGN acquires clathrin before it is internalized.
The images in Fig. 1 were obtained from fixed (and subsequently permeabilized, for clathrin) cells by using two-color indirect immunofluorescence labeling. The observed colocalization is above what would be expected due to random distribution of the proteins, as determined by a bivariate Ripley's K-analysis (Fig. S1). Minimal fluorescence was observed in either the green (dectin-1, MMR, or DC-SIGN, in the case of clathrin labeling) or red (colocalized partner) channels when cells were treated only with the secondary, labeled antibodies and not the primary antibodies, or when NIH 3T3 cells (that do not endogenously express either HA or DC-SIGN) were stained with primary and secondary antibodies, indicating specificity of labeling. It is highly unlikely that the domains shown in Fig. 1 were induced by the double-antibody labeling because 1), the cells were fixed before antibody treatment, and 2), DC-SIGN domains with very similar appearance were observed on live cells treated only with fluorescently labeled anti-DC-SIGN Fabs (11). Also, other transmembrane proteins that form microdomains, including some members of the tetraspanin family, do not colocalize with DC-SIGN (data not shown).
Comparison of DC-SIGN microdomains with those of HA
The manner in which cells pre-form molecular subassemblies to carry out different functions is a topic of current interest. Thus, it is valuable to compare the properties of DC-SIGN microdomains with those of another membrane protein known to form plasma membrane microdomains. For this purpose, influenza hemagglutinin (HA) was selected. HA is a glycoprotein found on the surface of influenza viruses and plays a key role in the process through which immunological cells bind and internalize the virus, and subsequently present it to other immunological cells for antiviral immunity (13). HA also assembles in microdomains on virally infected cell surfaces and these HA-containing clusters are presumed sites of viral budding (14,15). When HA is expressed alone in uninfected cells (e.g., fibroblasts), it forms plasma membrane microdomains on both fixed and live cells (16,17). The size and density of microdomains containing HA in uninfected NIH 3T3 fibroblasts stably expressing HA (HAb2 cells) are roughly similar to those of DC-SIGN microdomains (Fig. 2) and are used for comparison purposes for the remainder of the work described herein.
Figure 2.
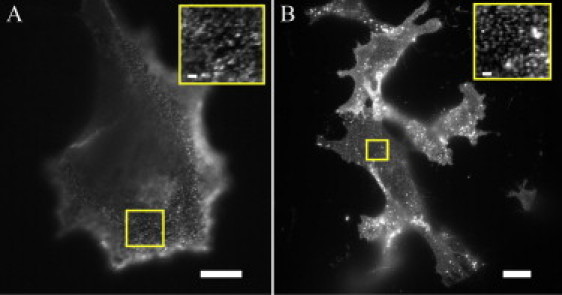
Comparison of DC-SIGN and HA microdomains. (A) DC-SIGN expression on a dendritic cell stained with DCN46 and antimouse-Alexa488. (B) HA expression on an HAb2 cell stained with FC125 and anti-mouse-Alexa488. (Insets) Higher magnification of areas outlined in main figures. Scale bars, 10 μm (1 μm in insets).
DC-SIGN does not require its cytoplasmic tail to form membrane microdomains
The possibility arises that the formation of DC-SIGN clusters and/or their subsequent stability requires molecular interactions involving the 40-amino-acid N-terminal cytoplasmic region (Fig. 3 A). To address this question, mutants of DC-SIGN (Δ35-DCSIGN and Δ20-DCSIGN) in which the cytoplasmic domain was partially (Δ20) or almost completely (Δ35) deleted were ectopically expressed in NIH 3T3 cells using a retroviral expression system. Δ35- and Δ20-DCSIGN expression on these cell lines was visualized by using indirect immunofluorescence, after fixation, with the primary monoclonal antibody DCN46. As shown in Fig. 3, B and C, ectopically expressed Δ20-DCSIGN or Δ35-DCSIGN both form membrane microdomains on NIH 3T3 cells. Therefore, DC-SIGN microdomain assembly does not require the cytoplasmic tail. This result indicates either that the cytoskeleton is not required or that cytoskeletal factors participate in forming and/or maintaining DC-SIGN microdomains only through one or more unknown intermediary molecules.
Figure 3.
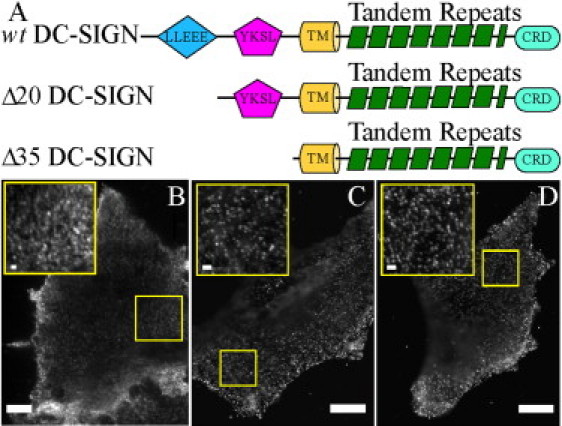
Ectopic expression of DC-SIGN with truncations in the cytoplasmic tail forms membrane microdomains. (A) Schematic representations, not to scale, of wild-type (wt) full-length DC-SIGN, Δ20-DCSIGN, and Δ35-DCSIGN, the latter two of which have deletions in the cytoplasmic tail of DC-SIGN. The cytoplasmic tail is depicted to the left of the transmembrane (TM) domain, whereas the extracellular portion of the wt protein is depicted to the right of the TM domain. Two internalization motifs are present in the cytoplasmic tail, a di-leucine-based motif (LLEEE) and a tyrosine-based motif (YKSL). The extracellular portion of the protein contains 7.5 tandem repeats, which are thought to mediate the tetramerization of DC-SIGN, followed by a carbohydrate recognition domain (CRD). (DC-SIGN is a type 2 membrane protein, so that its C-terminus is at the end of the ectodomain.) (B–D) NIH 3T3 cells stably expressing either wild-type (wt) full-length DC-SIGN (B), Δ20-DCSIGN (C), or Δ35-DCSIGN (D) stained for DC-SIGN (DCN46 and anti-mouse-Alexa488). (Insets) Higher magnification of areas outlined in main figures. Scale bars, 10 μm (1 μm in insets).
Ability of molecules within microdomains to exchange with molecules of the same type from other cellular regions
One way to address the stability of plasma membrane microdomains is to characterize the degree to which molecules within the microdomains can exchange with molecules of the same type residing in 1), the areas of the membrane surrounding the domains; 2), nearby microdomains, with an intermediate step requiring diffusion through the distance between domains; or 3), the cell interior. Confocal fluorescence recovery after photobleaching (FRAP) was used to address this question. These measurements were carried out for HA, full-length DC-SIGN, Δ35-DCSIGN, and a lipid-linked fluorescent protein residing in the inner leaflet of the plasma membrane (denoted as PMT-mRFP). For all four molecules, exchange mobility was probed for molecules residing within either HA or DC-SIGN domains. Confocal FRAP was also used to examine the exchange capability of PMT-mRFP and HA in regions not identified as domains.
For the confocal FRAP measurements, first, small, circular regions surrounding single domains were selected. The mean fluorescence intensity from these circular regions of interest was monitored before and after photobleaching. The degree of photobleaching in the circular tornado scan was restricted to ∼50% so that the domains could be tracked as they moved (slightly) as a whole in the membrane after the bleach pulse. Two aspects related to domain stability can be addressed by this type of measurement: the recoverable percentage, P∞, and the half-time for recovery, τ1/2 (see Materials and Methods). The apparent diffusion coefficient can then be calculated for each τ1/2 value for the area of the bleach spot used in each experiment.
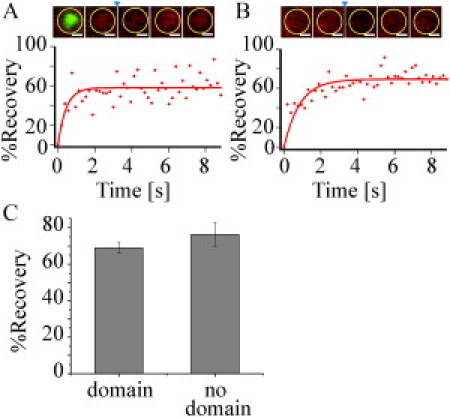
Fig. 4 A illustrates the results of a typical confocal FRAP measurement of an HA microdomain labeled with Alexa488-conjugated FC125 on the surface of an HAb2 cell. Consistent with previous reports (18–20), these measurements indicated that overall, HA in microdomains exhibits a large recoverable percentage (P∞ = 68 ± 10%, mean ± standard errors of the mean (SEM); Table 1). This result indicates that HA molecules within their microdomains exchange with those from outside the microdomains on a relatively fast timescale. The τ1/2 time in general should depend on the size of the bleached area, the fractions of the area occupied by the domains, the diffusion coefficients of the HA within and outside the domains, and the rate of exchange associated with HA moving into and out of domains. Apparent diffusion coefficients, calculated for each recovery curve using the τ1/2 and the radius of the bleach spot, yielded an average of D = 0.10 ± 0.01 μm2/s. These values are based on the assumption that possible kinetic barriers for HA leaving and entering domains are negligible and that the D values for HA in domains and the surround are comparable. The fact that the diffusion coefficients are similar to those reported previously in works that did not emphasize domains (18–20) suggests that the assumptions above are valid.
Figure 4.
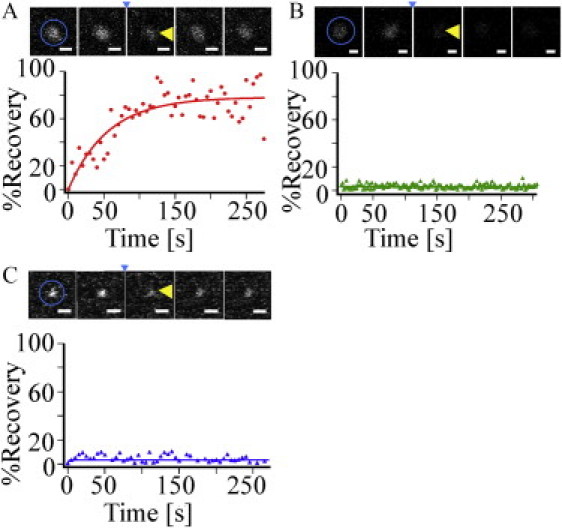
Ability of molecules within microdomains to exchange with molecules of the same type from other cellular regions. (A–C) Fluorescence recovery of a bleached domain on an HAb2 (A), MX-DCSIGN (B), or Δ35-MX-DCSIGN (C) cell stained with either FC125 (A) or DC6 (B and C) conjugated to Alexa488. A montage showing the bleaching of a representative cluster is above each recovery profile. The area of photobleaching is indicated by the circle in the first image. Images before photobleaching (t ≈ −10 and −5 s) are shown to the left of the small arrowhead, which indicates the first image directly after the time of photobleaching (t ≈ 0 s); images after photobleaching are shown to the right of the arrow (t ≈ 100 and 200 s). The bleached domain is indicated by a large arrowhead. Given the definition of P(t), the plotted function is zero immediately after photobleaching. Scale bars, 500 nm.
Table 1.
Mobility of molecules associated with DC-SIGN and HA microdomains
| FRAP |
Line-scan FCS |
Qdot tracking |
||||||
|---|---|---|---|---|---|---|---|---|
| P∞ | D (μm2/s) | n | D (μm2/s) | n | D (μm2/s) | R2 | n | |
| HA | 68 ± 10 | 0.10 ± 0.01 | 15 | 0.127 ± 0.005 | 31 | 0.103 ± 0.003 | 0.82 | 25 |
| DC-SIGN | ∼0 | ∼0 | 12 | 0.0025 ± 0.0004 | 35 | 0.003 ± 0.001 | 0.76 | 31 |
| Δ35-DCSIGN | ∼0 | ∼0 | 15 | 0.002 ± 0.001 | 28 | 0.0004 ± 0.0001 | 0.99 | 19 |
| PMT-mRFP (nondomain) | 76 ± 6 | 1.8 ± 0.2 | 8 | |||||
| PMT-mRFP in DC-SIGN domains | 69 ± 3 | 1.7 ± 0.2 | 18 | |||||
Uncertainties are standard deviations of the mean. The parameter n is the number of trials.
Fig. 4 B shows a representative confocal FRAP measurement for a domain containing full-length, wild-type DC-SIGN, labeled with Alexa488-conjugated DC6, on the surface of a MX-DCSIGN cell. Very little to zero recovery is detectable after >4 min. This result is consistent with previous measurements (11) and contrasts starkly with the results for HA domains. There are several possible explanations for the lack of DC-SIGN recovery: 1), DC-SIGN is extremely restricted in terms of its mobility within microdomains and therefore does not exchange with DC-SIGN in the surrounding membrane on a measurable timescale; 2), DC-SIGN is mobile within domains, but through an unknown molecular mechanism, the domains maintain a strict separation between molecules in the domain and those in the surrounding membrane; or 3), the density of DC-SIGN between microdomains is so low and the domains are so sparse that mobility between domains cannot be observed by confocal FRAP. As shown below, the apparent diffusion coefficient of DC-SIGN within domains is extremely low, and therefore, the first explanation offers the most likely scenario.
The question arises of whether the cytoplasmic region of DC-SIGN participates in, or is responsible for, the dramatic observed difference between the exchanges of HA and full-length DC-SIGN in microdomains with the membrane surround. Fig. 4 C shows a typical confocal FRAP measurement for a domain containing Δ35-DCSIGN, labeled with Alexa488-conjugated DC6, on the surface of a Δ35-MX-DCSIGN cell. As shown, DC-SIGN lacking its cytoplasmic region exhibits no appreciable difference from full-length DC-SIGN in these measurements. The average recoverable percentage is essentially zero on the timescale of the measurement. Therefore, direct association of the cytoplasmic region of full-length DC-SIGN with the cytoskeleton can be eliminated as the primary cause of DC-SIGN microdomain stability.
The observation that DC-SIGN domains are heterogeneous, at least in some cases containing dectin-1 and MMR, raises the essential question of possible subdomain structure. One issue related to this question is whether or not lipids within DC-SIGN domains can freely exchange with the membrane surround. It is interesting to note that Pinaud et al. (21) find that a GPI-anchored probe dynamically partitions into GM1-enriched domains, indicating that this probe can diffuse through such domains, usually, but not always, with a reduced diffusion coefficient within the domain. Confocal FRAP was carried out on NIH 3T3 cells transiently expressing DC-SIGN and PMT-mRFP, fluorescent in the red channel. In these measurements, plasma membrane microdomain regions for photobleaching (and prebleach and postbleach observation) of PMT-mRFP were selected by DC-SIGN expression as reflected by labeling with DCN46 followed by Alexa488-conjugated goat polyclonal IgG specific for mouse IgG. Microdomains were identified by the green channel (DC-SIGN) fluorescence, but FRAP measurements were carried out on these regions in the red channel (PMT-mRFP). As shown in Fig. 5 A and Table 1, PMT-mRFP exhibited significant recovery after photobleaching (P∞ = 69 ± 3%), with an apparent diffusion coefficient of D = 1.7 ± 0.2 μm2/s. These results indicate first that although DC-SIGN is extremely restrained within its plasma membrane microdomains, lipids are not. The percentage recoveries are equivalent to those observed in FRAP measurements of PMT-mRFP in regions of the plasma membrane that do not contain DC-SIGN (P∞ = 76 ± 6%, D = 1.8 ± 0.2 μm2/s; Fig. 5, B and C, and Table 1). Values of the apparent diffusion coefficients for PMT-mRFP, but not the recoverable percentages, are possibly underestimated because appreciable diffusion through the bleached region may occur during the bleach pulse. However, because the measured apparent D values are quite high and are consistent with other measurements of PMT-mRFP (22) and other lipid (23) diffusion, it is unlikely that these possible artifacts are significant within the context of the work described here. More important, the substantial recovery of the lipid analog suggests that it may diffuse between smaller, elemental units containing DC-SIGN, not resolvable by wide-field microscopic methods. Whether the lipid analog can actually enter these putative units is an open question at this juncture.
Figure 5.
Ability of lipids within DC-SIGN microdomains to exchange with lipids in the surrounding membrane. Representative fluorescence recovery of a bleached PMT-mRFP membrane region, containing (A) or not containing (B) a DC-SIGN domain, on an NIH 3T3 cell coexpressing PMT-mRFP and DC-SIGN. To identify membrane regions containing domains, cells were stained with DC-SIGN using DCN46 and goat antimouse-Alexa488 secondary antibody. A montage showing the bleaching of a representative membrane region is above each recovery profile. The area of defined photobleaching is indicated by the yellow circle. Images before photobleaching (t ≈ −0.38 and −0.19 s) are shown to the left of the small arrowhead, which indicates the first image directly after the time of photobleaching (t ≈ 0 s); images after photobleaching are shown to the right of the arrow (t ≈ 3.8 and 9.4 s). For the experiment in a membrane region containing a DC-SIGN domain (A), the first image in the montage is the same area shown in the subsequent images, but this image is for DC-SIGN stained with DCN46 and anti-mouse-Alexa488 in green, whereas the subsequent images are for the PMT-mRFP stained in red. Given the definition of P(t), the plotted function is zero immediately after photobleaching. Scale bars, 500 nm. (C) A graph showing the average percent recovery for PMT-mRFP on transfected NIH 3T3 cells in membrane domains in areas containing (left) or not containing (right) a DC-SIGN domain. Uncertainties are given as SEM values. Representative FRAP curves are from a single experiment, whereas the bar graph in Fig. 5 C represents an average for all of the measurements. Although the variance in data points for individual percent recovery curves can be larger than the SEM in Fig. 5C, the SEM refers to the variance between multiple experiments (n = 8 and 18; Table 1). The percent recoveries from the representative curves are slightly lower than the means, but they fall within one standard deviation of the mean.
Intradomain mobility monitored by line-scan FCS
As described above, confocal FRAP indicates that the rate of exchange of both DC-SIGN and Δ35-DCSIGN between microdomains and the surrounding membrane is extremely low (i.e., not observable). A possible explanation for this result is that DC-SIGN is essentially immobile in domains (see above). To address this possibility, a technique is required that offers greater spatial resolution than can be achieved using conventional FRAP. In recent work, the inherent temporal and spatial components of data acquired with a standard laser scanning confocal microscope have been combined with fluorescence correlation spectroscopy analysis to determine rates of apparent diffusion or binding kinetics on the spatial scale of a single pixel (24–26). Line-scan fluorescence correlation spectroscopy (FCS) is one such method. In this method, data are acquired by repetitively scanning the same single line. The data can be visualized by placing successive lines directly underneath the previous line scan, creating a line-scan carpet, which is similar to a kymograph. Temporal fluctuations in the intensity of a single pixel in a carpet column, sampled on the millisecond timescale, are sufficient to produce autocorrelation functions that capture aspects of membrane diffusion over an area determined by the point spread function (PSF) but with a spatial resolution determined by the lateral pixel size.
To establish the use of line-scan FCS to study the lateral diffusion of molecules within membrane microdomains, we initially investigated the intradomain diffusion of HA. HAb2 cells, stably expressing HA, were stained with anti-HA FC125 conjugated to Alexa488. Line scans were acquired and arranged in line-scan carpets (Fig. 6 A), in which domains of high fluorescence intensity are color-coded to appear more red on the carpet and background and areas of lower fluorescence intensity are color-coded to appear more blue. The domains were centered to remove horizontal positional jitter and then detrended to remove the influence of slowly varying components like photobleaching (Fig. 6 B). Apparent diffusion coefficients were calculated for single pixels by analyzing the fluorescence intensity fluctuations over time in single columns of the line-scan carpets; these analyses were carried out for each lateral pixel in each carpet to determine the apparent diffusion coefficients of HA within, at the edges, and outside of microdomains (Fig. 6 C). This analysis indicated that HA is highly mobile within domains, with a mean apparent diffusion coefficient of D = 0.127 ± 0.005 μm2/s, and that the apparent diffusion coefficients were approximately constant across the microdomains (Fig. 6 D). The apparent D for HA outside of domains was similar (data not shown).
Figure 6.
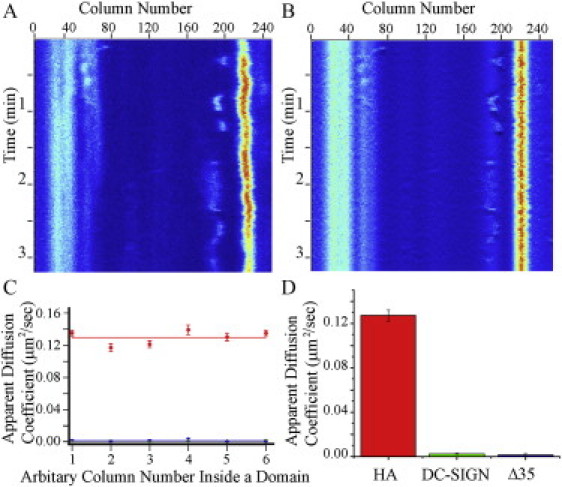
Intradomain mobility monitored by line-scan FCS. (A) A line-scan carpet, in which a single 256-pixel line is repetitively scanned (20.0 μs/pixel) on the cell membrane of an HAb2 cell that has been stained with FC125 conjugated to Alexa488. Successive lines (∼6 ms/line) are placed directly below the previous line. The pixel intensity is shown in heat map, with red indicating high intensity and blue indicating low intensity. There is a domain in focus centered around Column 225. (B) The line-scan carpet from A after alignment of the domain (to remove effects of movement of the entire domain) and removal of the effect of photobleaching (moving average subtraction). (C) The average apparent diffusion coefficients of columns in a domain. In this case, Column 1 has been standardized to represent the leftmost column of a domain in a given line-scan carpet. The average D over many domains was calculated. Line scans were acquired on domains on HAb2 cells labeled with FC125 conjugated to Alexa488 (red line), MX-DCSIGN cells labeled with DC6 conjugated to Alexa488 (green line), or Δ35-MX-DCSIGN cells labeled with DC6 conjugated to Alexa488 (blue line). Green and blue lines are essentially superimposed. (D) Apparent diffusion coefficients were calculated for all columns within domains and averaged from line scans acquired as described in C. Uncertainties are SEMs.
Line-scan FCS was next used to probe the lateral mobility of DC-SIGN and Δ35-DCSIGN (labeled with Alexa488-conjugated DC6) within microdomains on MX-DCSIGN and Δ35-MX-DCSIGN 3T3 cells. These data indicated that both molecules are essentially immobilized within their domains (Fig. 6). The average apparent diffusion coefficients for DC-SIGN and Δ35-DCSIGN in microdomains were found to be D = 0.0025 ± 0.0004 μm2/s and D = 0.002 ± 0.001 μm2/s, respectively (Fig. 6 and Table 1). Furthermore, for both DC-SIGN and Δ35-DCSIGN, the diffusion coefficient was sometimes so small that the autocorrelation functions could not be fit to the appropriate functional form (see Materials and Methods). The calculated average diffusion coefficients are in the range of the lower limit of what could be measured with line-scan FCS under our experimental conditions (see Materials and Methods). Thus, the results indicate that DC-SIGN within its microdomains, unlike HA, undergoes very little lateral diffusion and is immobilized in some way. This immobilization can account for the lack of exchange of DC-SIGN and Δ35-DCSIGN between microdomains and the surrounding membrane on the timescale of confocal FRAP measurements.
Defined-valency quantum-dot tracking confirms that DC-SIGN and Δ35-DC-SIGN exhibit much more restricted mobility within domains than does HA
To corroborate the line-scan FCS results and obtain additional information, quantum-dot (Qdot) tracking was employed to more directly investigate the dynamics of DC-SIGN molecules within microdomains at high speeds and with very high spatial resolution. In this type of measurement, it is important to use Qdots with limited valency, as Qdots with high valency have the potential to cross-link DC-SIGN and yield results in which the measured lateral mobility is artifactually decreased. Therefore, a new, synthetic Qdot method was employed in which Qdots covalently linked to streptavidin through biotinylated polyethylene glycol (PEG) spacers are subjected to gel electrophoresis (27). This technique separates Qdots bound to none, one, or two streptavidin molecules into distinct bands, which are then cut from gels to isolate Qdots of defined valency (28).
Qdots conjugated to single streptavidin molecules were preincubated with biotin-anti-DC-SIGN or biotin-anti-HA antibodies. The maximum biotin valency of the Qdots is three; however, one of these biotin binding sites is most likely sterically inaccessible due to the streptavidin structure, strongly suggesting that the maximum valency of these Qdots is two. In addition, the two remaining binding sites are likely too close together to accommodate two antibodies. NIH 3T3 cells stably expressing HA, DC-SIGN, or Δ35-DC-SIGN were labeled with these preincubated Qdots and movies were acquired at 100 Hz for 10 s. Single-particle tracking analysis was then carried out. Tracking analysis was restricted to single Qdots, which were identified by avoiding very bright clusters and observing Qdot blinking during the video.
Representative Qdot traces are shown in Fig. 7 and the results are summarized in Table 1. In all cases, plots of the mean-squared displacement (MSD) as a function of time saturated during the period of investigation. The initial slopes were high for HA but very low for DC-SIGN and Δ35-DC-SIGN. Apparent diffusion coefficients were calculated from the initial slopes of these plots (by using only the first 10 points). This analysis gave D = 0.103 ± 0.003 μm2/s (R2 = 0.82) for HA, which is approximately equal to the value measured by FRAP and line-scan FCS (Table 1). Approximately 28% of the traces were on Qdots that were determined to be immobile and were not used to calculate the average D. The apparent diffusion coefficients for DC-SIGN and Δ35-DC-SIGN were 0.003 ± 0.001 μm2/s (R2 = 0.76) and 0.0004 ± 0.0001 μm2/s (R2 = 0.99), respectively. Positional jitter arising from mechanical fluctuations, flexibility through the PEG-streptavidin-antibody linkers, and/or statistical noise associated with the Gaussian fits was evaluated by carrying out tracking analyses for Qdots strongly adhered to glass surfaces. These measurements gave apparent D values of 0.0025 ± 0.0001 μm2/s (R2 = 0.47). Therefore, the diffusion coefficients of DC-SIGN and Δ35-DC-SIGN measured by Qdot tracking are within the range of those produced by fluctuations due to sources other than lateral diffusion, consistent with the results obtained with line-scan FCS and confirming essential immobility of DC-SIGN within its microdomains.
Figure 7.
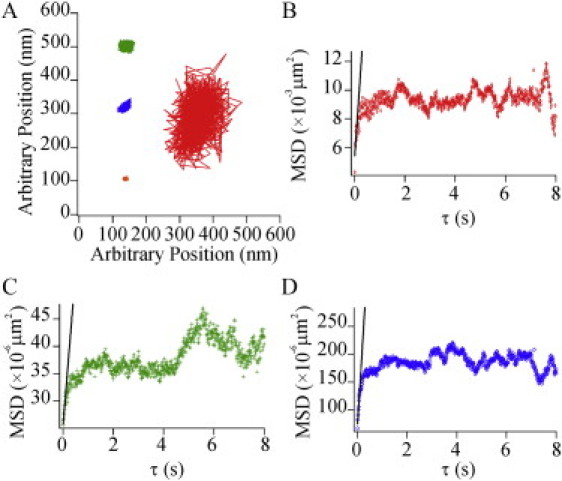
Defined-valency Qdot tracking confirms that DC-SIGN and Δ35-DCSIGN exhibit much more restricted mobility than HA within domains. Qdots bound to a single streptavidin were preincubated with either biotinylated anti-HA and used to label HAb2 cells, biotinylated anti-DC-SIGN and used to label MX-DCSIGN cells, biotinylated anti-DC-SIGN and used to label Δ35-MX-DCSIGN cells, or found adhered to the glass in a region with no cell present. (A) Representative trajectories of Qdots bound to either HA (right), DC-SIGN (top left), or Δ35-DCSIGN (middle left), or adhered to the glass (bottom left) from videos acquired at 100 Hz for 10 s. (B–D) MSD versus τ plots from trajectories for Qdots bound to either HA (B), DC-SIGN (C), or Δ35-DCSIGN (D). The best-fit line for the first 10 points from the MSD plots, which is used to calculate the D value, is indicated by the straight black line in each plot. Note that the ordinate is much smaller in C and D than it is in B.
Conclusion
Pathogen recognition by DC-SIGN is implicated in the defense or infection route against many critical players in human disease, including HIV-1, dengue virus, hepatitis C, and Candida (2–4). This calcium-dependent (C-type) transmembrane lectin is endogenously expressed in small microdomains on the plasma membranes of immature dendritic cells, key mediators between the innate and the adaptive arms of the immune system, and DC-SIGN clusters are required for efficient pathogen binding and internalization (8–11). The manner in which DC-SIGN clusters mediate either crucial (infection defense) or detrimental (infection) functions is of considerable interest. In this work, we have reported a number of observations that both enhance current understanding of the structure and dynamics of DC-SIGN microdomains and also raise a number of intriguing questions.
Colocalization imaging showed that DC-SIGN clusters sometimes, but not always, contain two other C-type transmembrane lectins (dectin-1 and MMR); furthermore, DC-SIGN clusters are partially colocalized with clathrin. The observation that DC-SIGN microdomains may or may not contain more than one C-type lectin implies that these clusters are heterogeneous in composition, i.e., that a spectrum of microdomain subtypes exists. This conclusion is supported by recent work showing that the multiplexing of C-type lectins is regulated so that pattern recognition receptors sample the phagosome in a sequential manner (29). Multiple C-type lectins are also found in contact sites between dendritic cells and yeast that stimulate formation of a recently defined cellular protrusive structure, the fungipod, which participates in fungal recognition by dendritic cells ((30,31) and A. K. Neumann and K. Jacobson unpublished observations). The compositional heterogeneity of C-type lectin microdomains may be required for efficient pathogen recognition and processing.
Cell imaging showed that two forms of DC-SIGN with partially or almost completely deleted cytoplasmic regions form plasma membrane microdomains that appear, within classical light-microscopic resolution, to be similar in size and distribution to those formed by wild-type, full-length DC-SIGN. Therefore, DC-SIGN domain formation and/or stability do not require direct interactions between DC-SIGN and cytoskeletal components close to the inner leaflet of the plasma membrane. However, whether the truncation mutants form a domain substructure identical to that of wild-type DC-SIGN domains remains an open question.
Consistent with previous results (11,18–20), confocal FRAP measurements showed that neither DC-SIGN nor cytoplasmically truncated DC-SIGN in microdomains undergoes measurable exchange with the pool of like proteins in the surrounding membrane, whereas HA in microdomains (19) does exchange with the surround. Apparent plasma membrane diffusion coefficients calculated for HA are consistent with long-range diffusion coefficients of a number of transmembrane proteins (∼0.1 μm2/s), but for DC-SIGN and its variants, the measurements yield apparent diffusion coefficients so low that it is not possible to distinguish between the possibilities of extremely slow mobility and instrumental constraints.
To further illuminate the FRAP results, both line-scan FCS and Qdot tracking measurements were carried out for DC-SIGN, cytoplasmically truncated DC-SIGN, and HA. These measurements yielded apparent diffusion coefficients for HA, both within and outside microdomains, that were consistent with the D values measured by confocal FRAP. More important, these measurements showed that the two forms of DC-SIGN were so limited in their intradomain mobilities that, again, it was not possible to distinguish between the possibilities of extremely slow mobility and instrumental limitations. Thus, the mobility of DC-SIGN variants within microdomains is very low, and most likely accounts for the lack of exchange between the domains and their surrounds observed by confocal FRAP.
It came as a surprise that although DC-SIGN and cytoplasmically truncated DC-SIGN are unable to exchange with the membrane surround, a lipid-linked fluorescent protein bound to the inner leaflet of the plasma membrane does undergo significant exchange with like proteins in the surrounding membrane. Thus, lipid molecules can permeate and diffuse through these domains relatively unimpeded, suggesting that the bilayer is contiguous within the domains despite the fact that in wide-field microscopy, they appear continuous and can be sized (11). This result strongly suggests that not only are DC-SIGN microdomains heterogeneous in composition, they also possess a complex internal structure with features smaller than can be resolved by conventional fluorescence microscopy, consistent with earlier results obtained with near-field microscopy (10). We are currently conducting superresolution microscopy studies to explore C-type lectin domain structure on smaller lengthscales (M. S. Itano, C. Steinhauer, P. Liu, A. K. Neumann, P. Tinnefeld, K. Jacobson, and N. L. Thompson, unpublished observations).
Precisely which protein, or perhaps lipid, components maintain the surprising stability of DC-SIGN in microdomains, and possibly other cell-surface microdomains containing C-type lectins, is a key structural issue. DC-SIGN microdomains might be organized through direct interactions between DC-SIGN molecules, although this possibility seems at present to be too simple a picture, given that we now know that DC-SIGN microdomains contain a number of other molecules and have preliminary results from superresolution microscopy (data not shown) suggesting otherwise. Three possible hypotheses for explaining the stability of DC-SIGN microdomains include attachments to other microdomain-forming transmembrane proteins (e.g., tetraspanins (32)); interaction of DC-SIGN with as yet unidentified molecules that bridge the gap to the cytoskeleton; and binding to members of the secreted family of galectins (33) known to organize membrane scaffolds. The resolution of this important issue awaits advanced compositional and microcopic investigations.
Taken together, our results highlight the fact that DC-SIGN microdomains are considerably more complex than previously thought and may provide a prototype for certain other cell-surface, protein-containing microdomains. Moreover, signaling is initiated from these domains (2–4,30) and they can be rapidly transported rearward in dendritic cells to sites of internalization (11). It is clear that a better understanding of how the composition, structure, and dynamics of C-type lectin domains mediate pathogen internalization could suggest means to modulate pathogen entry and antigen acquisition in cells of the innate immune system.
Acknowledgments
We thank Judith White, Thomas Braciale, and Robert Doms for their generous gifts of HAb2, FC125, and DC6 cell lines, respectively. We thank Ichiro Maruyama for the PMT-mRFP construct, Cai Huang for the modified pEGFP-C1 vector, and Dan Littman for the pMX-Δ20-DCSIGN and pMX-Δ35-DCSIGN plasmids. We also thank Xiang Wang, Department of Chemistry, University of North Carolina, Chapel Hill, North Carolina, and Michelle Digman, Laboratory for Fluorescence Dynamics, Department of Biomedical Engineering, University of California, Irvine, California, for their contributions.
This work was supported primarily by National Institutes of Health (NIH) grant GM-041402 (K.J. and N.L.T.). Additional funding was provided by NIH Cell Migration Consortium grant GM-064346 (K.J.), National Science Foundation grant MCB-0641087 (N.L.T.), NIH grant P41-RR-003155 (E.G.), NIH grant P50-GM-076516 (E.G.), European Commission grant Nanognostics (W.J.P.), and German Research Foundation grant PA794/11-1 (W.J.P.).
Supporting Material
References
- 1.Banchereau J., Steinman R.M. Dendritic cells and the control of immunity. Nature. 1998;392:245–252. doi: 10.1038/32588. [DOI] [PubMed] [Google Scholar]
- 2.Weis W.I., Taylor M.E., Drickamer K. The C-type lectin superfamily in the immune system. Immunol. Rev. 1998;163:19–34. doi: 10.1111/j.1600-065x.1998.tb01185.x. [DOI] [PubMed] [Google Scholar]
- 3.Cambi A., Koopman M., Figdor C.G. How C-type lectins detect pathogens. Cell. Microbiol. 2005;7:481–488. doi: 10.1111/j.1462-5822.2005.00506.x. [DOI] [PubMed] [Google Scholar]
- 4.Svajger U., Anderluh M., Obermajer N. C-type lectin DC-SIGN: an adhesion, signalling and antigen-uptake molecule that guides dendritic cells in immunity. Cell. Signal. 2010;22:1397–1405. doi: 10.1016/j.cellsig.2010.03.018. [DOI] [PMC free article] [PubMed] [Google Scholar]
- 5.Feinberg H., Guo Y., Weis W.I. Extended neck regions stabilize tetramers of the receptors DC-SIGN and DC-SIGNR. J. Biol. Chem. 2005;280:1327–1335. doi: 10.1074/jbc.M409925200. [DOI] [PubMed] [Google Scholar]
- 6.Serrano-Gómez D., Sierra-Filardi E., Corbí A.L. Structural requirements for multimerization of the pathogen receptor dendritic cell-specific ICAM3-grabbing non-integrin (CD209) on the cell surface. J. Biol. Chem. 2008;283:3889–3903. doi: 10.1074/jbc.M706004200. [DOI] [PubMed] [Google Scholar]
- 7.Yu Q.D., Oldring A.P., Taylor M.E. Autonomous tetramerization domains in the glycan-binding receptors DC-SIGN and DC-SIGNR. J. Mol. Biol. 2009;387:1075–1080. doi: 10.1016/j.jmb.2009.02.046. [DOI] [PMC free article] [PubMed] [Google Scholar]
- 8.Cambi A., de Lange F., Figdor C.G. Microdomains of the C-type lectin DC-SIGN are portals for virus entry into dendritic cells. J. Cell Biol. 2004;164:145–155. doi: 10.1083/jcb.200306112. [DOI] [PMC free article] [PubMed] [Google Scholar]
- 9.de Bakker B.I., de Lange F., Garcia-Parajo M.F. Nanoscale organization of the pathogen receptor DC-SIGN mapped by single-molecule high-resolution fluorescence microscopy. ChemPhysChem. 2007;8:1473–1480. doi: 10.1002/cphc.200700169. [DOI] [PubMed] [Google Scholar]
- 10.Koopman M., Cambi A., Garcia-Parajo M.F. Near-field scanning optical microscopy in liquid for high resolution single molecule detection on dendritic cells. FEBS Lett. 2004;573:6–10. doi: 10.1016/j.febslet.2004.07.035. [DOI] [PubMed] [Google Scholar]
- 11.Neumann A.K., Thompson N.L., Jacobson K. Distribution and lateral mobility of DC-SIGN on immature dendritic cells—implications for pathogen uptake. J. Cell Sci. 2008;121:634–643. doi: 10.1242/jcs.022418. [DOI] [PubMed] [Google Scholar]
- 12.Cambi A., Beeren I., Figdor C.G. The C-type lectin DC-SIGN internalizes soluble antigens and HIV-1 virions via a clathrin-dependent mechanism. Eur. J. Immunol. 2009;39:1923–1928. doi: 10.1002/eji.200939351. [DOI] [PubMed] [Google Scholar]
- 13.Gamblin S.J., Skehel J.J. Influenza hemagglutinin and neuraminidase membrane glycoproteins. J. Biol. Chem. 2010;285:28403–28409. doi: 10.1074/jbc.R110.129809. [DOI] [PMC free article] [PubMed] [Google Scholar]
- 14.Takeda M., Leser G.P., Lamb R.A. Influenza virus hemagglutinin concentrates in lipid raft microdomains for efficient viral fusion. Proc. Natl. Acad. Sci. USA. 2003;100:14610–14617. doi: 10.1073/pnas.2235620100. [DOI] [PMC free article] [PubMed] [Google Scholar]
- 15.Leser G.P., Lamb R.A. Influenza virus assembly and budding in raft-derived microdomains: a quantitative analysis of the surface distribution of HA, NA and M2 proteins. Virology. 2005;342:215–227. doi: 10.1016/j.virol.2005.09.049. [DOI] [PubMed] [Google Scholar]
- 16.Hess S.T., Kumar M., Zimmerberg J. Quantitative electron microscopy and fluorescence spectroscopy of the membrane distribution of influenza hemagglutinin. J. Cell Biol. 2005;169:965–976. doi: 10.1083/jcb.200412058. [DOI] [PMC free article] [PubMed] [Google Scholar]
- 17.Hess S.T., Gould T.J., Zimmerberg J. Dynamic clustered distribution of hemagglutinin resolved at 40 nm in living cell membranes discriminates between raft theories. Proc. Natl. Acad. Sci. USA. 2007;104:17370–17375. doi: 10.1073/pnas.0708066104. [DOI] [PMC free article] [PubMed] [Google Scholar]
- 18.Ellens H., Bentz J., White J.M. Fusion of influenza hemagglutinin-expressing fibroblasts with glycophorin-bearing liposomes: role of hemagglutinin surface density. Biochemistry. 1990;29:9697–9707. doi: 10.1021/bi00493a027. [DOI] [PubMed] [Google Scholar]
- 19.Shvartsman D.E., Kotler M., Henis Y.I. Differently anchored influenza hemagglutinin mutants display distinct interaction dynamics with mutual rafts. J. Cell Biol. 2003;163:879–888. doi: 10.1083/jcb.200308142. [DOI] [PMC free article] [PubMed] [Google Scholar]
- 20.Engel S., Scolari S., Veit M. FLIM-FRET and FRAP reveal association of influenza virus haemagglutinin with membrane rafts. Biochem. J. 2010;425:567–573. doi: 10.1042/BJ20091388. [DOI] [PubMed] [Google Scholar]
- 21.Pinaud F., Michalet X., Weiss S. Dynamic partitioning of a glycosyl-phosphatidylinositol-anchored protein in glycosphingolipid-rich microdomains imaged by single-quantum dot tracking. Traffic. 2009;10:691–712. doi: 10.1111/j.1600-0854.2009.00902.x. [DOI] [PMC free article] [PubMed] [Google Scholar]
- 22.Liu P., Sudhaharan T., Wohland T. Investigation of the dimerization of proteins from the epidermal growth factor receptor family by single wavelength fluorescence cross-correlation spectroscopy. Biophys. J. 2007;93:684–698. doi: 10.1529/biophysj.106.102087. [DOI] [PMC free article] [PubMed] [Google Scholar]
- 23.Zhang L., Granick S. Lipid diffusion compared in outer and inner leaflets of planar supported bilayers. J. Chem. Phys. 2005;123:211104. doi: 10.1063/1.2138699. [DOI] [PubMed] [Google Scholar]
- 24.Digman M.A., Brown C.M., Gratton E. Measuring fast dynamics in solutions and cells with a laser scanning microscope. Biophys. J. 2005;89:1317–1327. doi: 10.1529/biophysj.105.062836. [DOI] [PMC free article] [PubMed] [Google Scholar]
- 25.Petrásek Z., Schwille P. Precise measurement of diffusion coefficients using scanning fluorescence correlation spectroscopy. Biophys. J. 2008;94:1437–1448. doi: 10.1529/biophysj.107.108811. [DOI] [PMC free article] [PubMed] [Google Scholar]
- 26.Ries J., Chiantia S., Schwille P. Accurate determination of membrane dynamics with line-scan FCS. Biophys. J. 2009;96:1999–2008. doi: 10.1016/j.bpj.2008.12.3888. [DOI] [PMC free article] [PubMed] [Google Scholar]
- 27.Sperling R.A., Pellegrino T., Parak W.J. Electrophoretic separation of nanoparticles with a discrete number of functional groups. Adv. Funct. Mater. 2006;16:943–948. [Google Scholar]
- 28.Lin C.-A. J., Sperling R.A., Parak W.J. Design of an amphiphilic polymer for nanoparticle coating and functionalization. Small. 2008;4:334–341. doi: 10.1002/smll.200700654. [DOI] [PubMed] [Google Scholar]
- 29.Heinsbroek S.E., Taylor P.R., Gordon S. Stage-specific sampling by pattern recognition receptors during Candida albicans phagocytosis. PLoS Pathog. 2008;4:e1000218. doi: 10.1371/journal.ppat.1000218. [DOI] [PMC free article] [PubMed] [Google Scholar]
- 30.Neumann A.K., Jacobson K. A novel pseudopodial component of the dendritic cell anti-fungal response: the fungipod. PLoS Pathog. 2010;6:e1000760. doi: 10.1371/journal.ppat.1000760. [DOI] [PMC free article] [PubMed] [Google Scholar]
- 31.Goodridge H.S., Reyes C.N., Underhill D.M. Activation of the innate immune receptor Dectin-1 upon formation of a ‘phagocytic synapse’. Nature. 2011;472:471–475. doi: 10.1038/nature10071. [DOI] [PMC free article] [PubMed] [Google Scholar]
- 32.Hemler M.E. Tetraspanin functions and associated microdomains. Nat. Rev. Mol. Cell Biol. 2005;6:801–811. doi: 10.1038/nrm1736. [DOI] [PubMed] [Google Scholar]
- 33.Grigorian A., Torossian S., Demetriou M. T-cell growth, cell surface organization, and the galectin-glycoprotein lattice. Immunol. Rev. 2009;230:232–246. doi: 10.1111/j.1600-065X.2009.00796.x. [DOI] [PMC free article] [PubMed] [Google Scholar]
Associated Data
This section collects any data citations, data availability statements, or supplementary materials included in this article.