

Abstract
In Escherichia coli, ribosomes concentrate near the cylindrical wall and at the endcaps, whereas the chromosomal DNA segregates in the more centrally located nucleoid. A simple statistical model recovers the observed ribosome-nucleoid segregation remarkably well. Plectonemic DNA is represented as a hyperbranched hard-sphere polymer, and multiple ribosomes that simultaneously translate the same mRNA strand (polysomes) are represented as freely jointed chains of hard spheres. There are no attractive interactions between particles, only excluded-volume effects. At realistic DNA and ribosome concentrations, segregation arises primarily from two effects: the DNA polymer avoids walls to maximize conformational entropy, and the polysomes occupy the empty space near the walls to maximize translational entropy. In this complex system, maximizing total entropy results in spatial organization of the components. Due to coupling of mRNA to DNA through RNA polymerase, the same entropic effects should favor the placement of highly expressed genes at the interface between the nucleoid and the ribosome-rich periphery. Such a placement would enable efficient cotranscriptional translation and facile transertion of membrane proteins into the cytoplasmic membrane. Finally, in the model, monofunctional DNA polymer beads representing the tips of plectonemes preferentially locate near the cylindrical wall. This suggests that initiation of transcription may occur preferentially near the ribosome-rich periphery.
Introduction
Despite its lack of organelles, the bacterial cytoplasm exhibits a high degree of spatial organization (1,2). The chromosomal DNA is condensed into a central region called the nucleoid (3), and specific DNA loci adopt specific locations during the cell cycle (4,5). In rapidly growing Escherichia coli and Bacillus subtilis, the ribosomes strongly concentrate in the cytoplasmic periphery, including the two poles (i.e., outside the nucleoid) (6–8). Many proteins and even some lipids are known to have specific addresses in the cell (2,9,10). Although in a few cases the molecular mechanisms underlying this organization are understood (11), many important examples lack an explanation at present.
The segregation of the chromosomal DNA from the majority of the ribosomes is puzzling from a biochemical perspective. In all growth conditions, ribosomes translate mRNA while it is being synthesized. Such cotranscriptional translation is important for general transcription (12,13), transcriptional attenuation (14), and transcriptional polarity (15). However, this mechanism apparently requires that the portion of the genome that is being actively expressed must remain in close proximity to the pool of ribosomes at the cytoplasmic periphery. When conditions change and the cell expresses a different set of genes, the spatial distribution of the chromosomal DNA must rearrange to position a new set of active genes near the ribosome pool. Finally, ∼10% of the expressed proteins are membrane proteins that are typically inserted into the cytoplasmic membrane as they are translated (16,17). Most of these genes are likely to be located very near the cytoplasmic membrane.
We know of no biochemical mechanism that explains why ribosomes segregate to the cell periphery or how actively expressed genes might be transported to that ribosome-rich region of space. The spatial extent of the nucleoid has been viewed as a compromise between condensing and expanding forces (18). Condensing forces include supercoiling and the binding of DNA by nucleoid associated proteins (19). Expanding forces include the large unperturbed spatial extent of the free DNA polymer and transertion. The free DNA polymer has a radius of gyration (Rg) ∼10 times larger than the radius of the cell. Compression to the size of the cytoplasm results in a restoring force in the direction of expansion (20). Coupled transcription, translation, and insertion of membrane proteins (transertion) may exert force on the DNA through the DNA-RNAP-mRNA-ribosome macromolecular assembly.
The 4.6 Mbp circular E. coli chromosome (21) has a contour length of 1.6 mm, which is much larger than the rod-shaped cell dimensions of 2–4 μm in length and 0.5 μm in radius (Fig. 1 A). Nevertheless, in rapidly growing cells, the chromosomal DNA does not fill the entire cytoplasmic volume. Instead, it is condensed into a region of space called the nucleoid. The nucleoid is sometimes considered to be a separate phase from the surrounding cytoplasmic periphery (3). The size and shape of the nucleoid are both sensitive to growth conditions and to drug treatments that halt transcription or translation (7,8,22–24).
Figure 1.
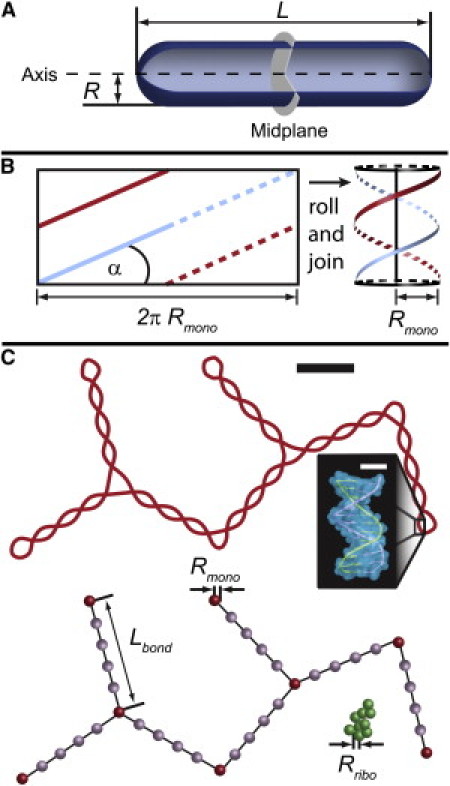
Model parameters. (A) Model of an E. coli cell as a spherocylindrical container. (B) Plectoneme parameters. We consider a plectoneme as two linear double strands of DNA wrapped around a cylinder (29). (C) Hard-sphere model of DNA polymer configuration. The top representation shows a projection of the plectoneme into the plane of the page. The bottom representation shows the bead types for the same configuration. Dark beads are node beads, light beads are bond beads and the beads in the clump are ribosome beads. The black scale bar is 100 nm and the white scale bar is 1 nm.
When isolated from other cellular components, the E. coli chromosome is a branched, plectonemic structure of supercoiled DNA whose physical properties are reasonably well understood. For DNA whose supercoiling is due to twist without writhing, electron microscopy (EM) has revealed a quantitative relationship among σlink, the plectoneme opening angle α, the plectoneme radius r, and the branching ratio (25,26). A model plectoneme then becomes two strands of double-stranded DNA wrapped around a cylinder (Fig. 1 B). Here σlink is the specific linking deficit, i.e., the ratio of excess twists to the number of twists in the relaxed DNA. The value σlink = 0.1 corresponds to a configuration with one extra twist for every 10 twists of relaxed DNA or 11 total twists per 105 bp.
Here we describe a simple model that treats the chromosomal DNA as a hyperbranched polymer, monomeric ribosomes as hard spheres, and chains of ribosomes simultaneously translating the same mRNA strand (polysomes) as freely jointed chains of hard-sphere ribosomes. We base our model on experimental values for E. coli in various growth conditions; the lack of content data prohibits examination of other species. It is well known that in simple model systems, maximizing the configurational and translational entropy of the overall system can lead to demixing or spatial segregation of the components (27,28). In our system, we find that when a mixture of polymer and small spheres is confined, the polymer occupies the interior section of the container while the small spheres occupy the periphery. The DNA, represented by the hyperbranched polymer, avoids the hard cytoplasmic wall to maximize conformational entropy. The ribosomes, represented by hard spheres, segregate to the cylindrical wall and endcaps to sample the space left unoccupied by the DNA and thus maximize their translational entropy. For realistic ribosome and DNA concentrations, the DNA polymer compresses even further, especially in the axial dimension, as ribosomes preferentially occupy the endcap volumes. Our simulation results are qualitatively consistent with what is known about the spatial distribution of ribosomes and the nucleoid in E. coli during growth, as well as the effects of certain drugs that interfere with transcription or translation (23). We conclude that any realistic description of ribosome segregation and nucleoid compaction must include the physical effects of excluded volume and polymer conformational entropy in a quantitative fashion.
Although wall avoidance is likely an important force driving nucleoid condensation, other condensing forces are also important. In addition, transertion remains a plausible driving force toward nucleoid expansion. However, given the spatial distribution of the DNA, the transertion mechanism appears to be feasible mainly along the cylindrical portion of the cytoplasmic membrane, where the distance over which the DNA is depleted can be bridged by a moderately sized mRNA. According to both experimental results and the model, in the endcaps the DNA is far from the cytoplasmic membrane. The model thus suggests that transertion can cause nucleoid expansion primarily in the radial direction. Axial expansion could be due to cell growth and elongation between two radial transertion sites embedded in the membrane.
Entropically driven ribosome segregation may also provide a mechanism for efficient translation of highly expressed mRNA. For a gene located within the nucleoid, its mRNA transcript will bind more and more ribosomes as it lengthens. As these polysomes grow, the same entropic effects will provide a driving force toward segregation of the polysomes, the mRNA chains, and the gene itself to the cell periphery. If this assemblage manages to find the ribosome-rich periphery, the multiple polysomes that are sprouting from the same active gene will provide a strong force to maintain localization of that gene in the cytoplasmic periphery. The efficiency of formation and reformation of the translation apparatus would then be enhanced by the high local concentration of components. The E. coli cytoplasmic periphery, including the polar endcaps, might thus become a localized, highly efficient protein factory.
Materials and Methods
Model
Little is known about the detailed geometry of the chromosomal DNA in live bacterial cells. Isolated nucleoids can be obtained by enzymatic or osmotic disruption of the cell wall. After such a treatment, the isolated chromosome exhibits a branched, plectonemic structure with specific linking difference σlink = –0.08 (29). It is difficult to estimate the σlink-value in cells because architectural proteins stabilize a fraction of the total linking deficit, and these proteins often unbind during nucleoid liberation. In live cells, the estimated value is smaller in magnitude: σlink ≈ –0.025 (30). This value is regulated by the activities of topoisomerases and the binding of nucleoid associated proteins. We use previous EM data to make a coarse-grained model of the plectonemic E. coli chromosome. We estimate σlink = –0.03, which corresponds to α = 56° and r = 11.8 nm (26). We model the entire DNA polymer as a hyperbranched chain of hard spheres (Fig. 1 C). These hard spheres (referred to as node beads (red)) are connected by volumeless rods of length Lbond = 200 nm, roughly twice the estimated persistence length of a plectoneme with these parameters (20). Each node bead is freely jointed, meaning that there is no correlation between the direction of the incoming rod and the direction of the outgoing rod from the same bead. There can be one, two, or three rods coming from each bead. This functionality is allowed to equilibrate in a Monte Carlo (MC) scheme that treats all functionalities on an equal footing. In the model, the nucleoid is confined within a spherocylinder (Fig. 1 A) with dimensions chosen to mimic the known bacterial cell dimensions (see Table S1 in the Supporting Material). In live cells, most of the ribosomes are present as polysomes (31–33). We therefore model the ribosomes as polysomes of freely jointed chains of 20-nm-diameter hard spheres (34).
Two important considerations are the volume excluded to the ribosomes by the plectonemic structure and the mutually excluded volume of the plectoneme branches. A realistic three-dimensional structure for a plectoneme branch excludes more volume to a ribosome sphere than it does to other plectoneme branches, because the narrow double-stranded DNA segments forming two branches can nestle up against each other more closely than a ribosome sphere can approach the branch axis. We mimic this differential excluded volume effect by adding four additional bond beads (Fig. 1 C, purple) between each pair of plectoneme branch node beads. In the simulations, node beads cannot overlap each other but bond beads can, mimicking the self-excluded volume of realistic plectonemes. However, a ribosome bead can overlap neither the node beads nor the additional bond beads. Geometric estimates included in the Supporting Material justify the choice of four additional bond beads along each bond.
We compared two realistic cell-growth conditions, termed poor growth and moderate growth. Table 1 summarizes details of the experimental parameters used to describe the two different cell-growth conditions, and the corresponding model parameters. The two models differ in cell dimensions, total amount of DNA, and total number of ribosomes (35,36). Although the ribosome and DNA bead diameters remain the same in both growth conditions, the cell in the moderate-growth condition has a larger radius and length, and contains a larger number of polysomes and DNA beads per cell. Cells in rich-growth conditions have so many ribosomes and so little available volume that the model becomes prohibitively large and slow to equilibrate.
Table 1.
Model parameters
| Name | Unit | Poor-growth media | Moderate-growth media | |
|---|---|---|---|---|
| Length of the cylindrical region | l | μm | 2 | 2.3 |
| Radius of the end-cap | R | μm | 0.25 | 0.35 |
| Total length of the spherocylinder | L | μm | 2.5 | 3 |
| Volume of spherocylinder | V | μm3 | 0.46 | 1.06 |
| Radius of a DNA plectoneme bead | Rmono | nm | 10 | 10 |
| Bond length∗ | Lbond | nm | 200 | 200 |
| Radius of ribosome† | Rribo | nm | 10 | 10 |
| Number of DNA plectoneme beads‡ | Nmono | No. of beads | 4500 | 6700 |
| Number of beads per polysome chain§ | Nseg | No. of beads/chain | 10 | 13 |
| Number of polysome chains | Npolysome | No. of chains | 450 | 1538 |
| Total number of ribosome beads | Npolysome Nseg | No. of beads | 4500 | 19,994 |
| Mean DNA bead concentration | CD | 103 beads/μm3 | 9.82 | 6.29 |
| Mean ribosome concentration | CR | 103 beads/μm3 | 9.82 | 18.78 |
MC methodology
The simulation proceeds in three stages: 1), generation of an initial configuration; 2), equilibration; and 3), averaging of properties. In all three stages, MC moves are proposed based on random numbers and accepted if the configuration is free of overlap between beads and the entire system is within the confinement volume. These MC moves are designed to examine the equilibrium properties of the system and do not mimic molecular motions. As explained above, overlap is not allowed between the following bead combinations: ribosome-node, ribosome-bond, ribosome-ribosome, and node-node. Overlap is allowed in both the bond-bond and bond-node cases. The fundamental MC move for the DNA polymer is a cluster move (Fig. 2) as proposed by Madras and Janse van Rensburg (37). A bond in the DNA polymer is chosen at random and cut, dividing the polymer into two pieces. An attaching bead is chosen at random from the smaller piece, and a branching bead is chosen from the larger piece. If either of these beads is already attached to three beads, a new bead is chosen. The cluster of beads in the smaller piece is randomly reoriented and attached to the larger piece by adding a bond between the attaching and branching breads.
Figure 2.
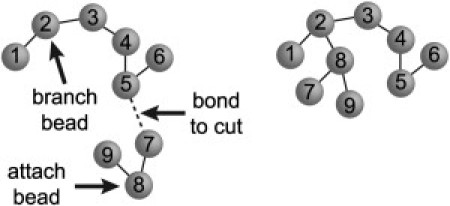
Cluster move schematic. A random bond is cut and one bead from each part is picked. The smaller piece is reattached to the large piece by adding a bond between these two beads.
One can generate a hyperbranched chain from a linear chain by performing such MC moves. For the case of the DNA polymer in our model, however, the linear chain will not fit inside the cell. Therefore, we start with a linear chain in an infinite cylinder (with the desired radius R) and then perform cluster moves to equilibrate the DNA polymer. Once the structure is equilibrated, we perform moves to decrease the size of the cell by only choosing branching beads that are within the dimensions of the cell. Roughly 106 moves with this method are sufficient to generate a configuration of the DNA polymer in the cell. Afterward, the polysomes are inserted inside the cell by means of a growth and equilibration algorithm for off-lattice systems (38). In this algorithm, Npolysome monomers (one for each polysome chain) are randomly inserted into the simulation cell, avoiding any hard-sphere overlaps. The growing process then proceeds through several cycles. In each cycle, an attempt is made to move an existing chain of polysome (using MC moves described below), and then an attempt is made to lengthen an unfinished polysome chain by one ribosome. The attempted move is accepted if there is no overlap between beads. The MC moves for the polysomes are a combination of unbiased moves (translation or rotation moves) and efficient biased MC moves, including reptation (39), continuum-configuration bias (40), and Dickman-Hall (41) moves. All of these types of moves are chosen with equal probability. Using these biased and unbiased moves, we are able to insert and equilibrate the desired number of polysomes very efficiently. This same set of moves (translation, rotation, reptation, continuum-configuration bias, and Dickman-Hall) is also used during equilibration and production.
After generating the initial configuration, we equilibrate the system by making MC moves until its properties (see below) reach a steady value. In practice, we perform 108 MC moves to equilibrate the system. Then we perform 100 independent production runs, each with 108 moves. During both equilibration and production, we choose to move either a node bead or a polysome with equal probability. Configurations are saved at an interval of 5 × 10⁵ moves and are used to calculate the equilibrium properties of the DNA polymer and ribosomes. The properties we examine for the DNA polymer are its size and shape. We measure the size by the Rg and the semi-axis lengths of an equivalent ellipsoid (a, b, and c semi-axes) (42). We measure the shape of the polymer by its asphericity (Ad) (43), and the fraction of node beads of each functionality (f1, f2, and f3). The asphericity is a parameter that is obtained from the moment of inertia tensor and takes on a value of zero for a uniform sphere and one for a rod.
Results
The single-configuration snapshots of Fig. 3 give a good qualitative view of the essential results for both poor- and moderate-growth conditions. Each image depicts those DNA (red) and/or ribosome (green) beads whose centers lie within a 50-nm-thick central slab of the cell. As expected, even in the absence of polysomes (Fig. 3 A) the DNA polymer avoids the walls to maximize configurational entropy. The DNA compacts primarily in the axial direction when we add polysomes to the poor-growth condition model (Fig. 3 C).
Figure 3.
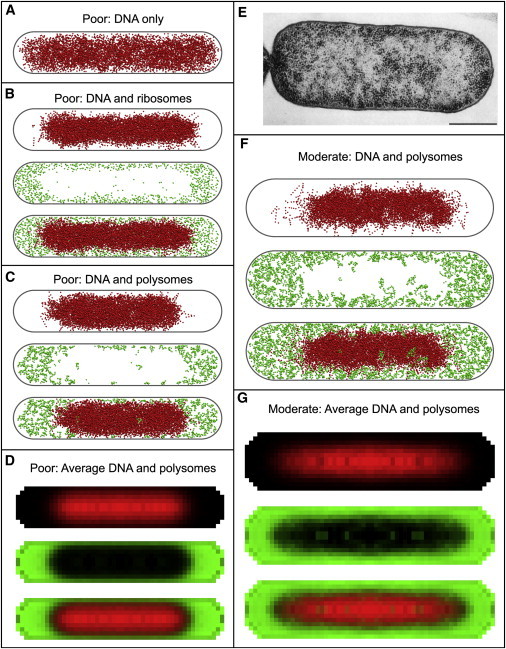
Distribution of DNA and ribosomes. Panels A-D correspond to poor growth conditions and F-G correspond to moderate growth conditions. (A) A 50 nm central slice through a snapshot of the DNA polymer configuration with no ribosomes present. (B) 50 nm central slice showing DNA (top) and ribosomes (middle) when ribosomes are present as monomers. A merge of both types of beads is shown at the bottom. (C and F) 50 nm central slice showing DNA (top) and ribosomes (middle) when ribosomes are present as polymers. A merge of both types of beads is shown at the bottom. (D and G) Average distribution of DNA (top) and ribosomes (middle) in an infinitesimal central slice. A merge of both types of beads is shown at the bottom. (E) Electron microscope image of DNA (light gray regions) and ribosomes (dark dots) from a thin section of an E. coli cell. Reproduced from Hobot et al. (46) with permission from American Society for Microbiology.
For the moderate-growth condition, the cell is larger (R = 350 nm, total Lcell = 3.0 μm), the DNA bead concentration is 35% smaller, and the mean ribosome concentration is twice as large (Table 1). Fig. 3 F shows that, again, the compaction of the DNA polymer occurs primarily in the axial direction, but it is significant in the radial direction as well, with a thin layer of polysomes coating the cylindrical wall. This is likely due to the larger concentration of polysome beads in moderate conditions and the larger cell radius. The results suggest that at a high concentration of ribosomes, the ribosomes will preferentially displace DNA beads in the endcaps but will also displace DNA beads from the sidewall when necessary.
Additional quantitation of the distributions can be found in Fig. S1. Fig. 4 shows the distribution of DNA beads classified according to functionality (the number of rods emanating from each node bead). The average functionality decreases away from the axis. At the periphery of the cell, almost all the DNA beads are monofunctional.
Figure 4.
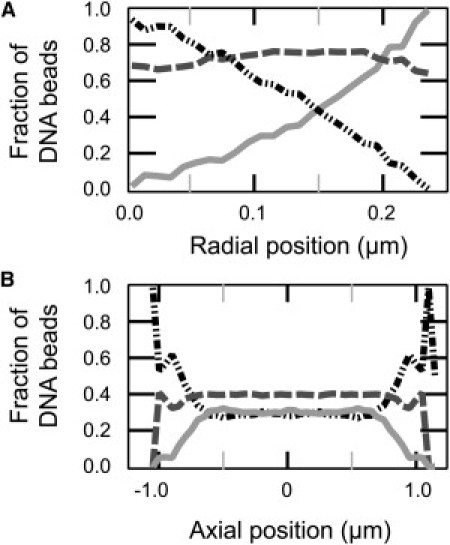
Fraction of DNA beads of a given functionality along the radial dimension (A) and axial dimension (B). Functionalities of DNA beads are plotted in light-gray solid (one bond), dark-gray dashed (two bonds), and black dash-dot (three bonds).
Table 2 provides a quantitative analysis of the equilibrium size and shape of the DNA polymer. In both poor- and moderate-growth conditions, Rg decreases by a factor of 3 when the free polymer is forced to reside within the cell boundaries. The polymer also becomes less spherical and Ad increases from ∼0.27 to 0.8. The addition of polysomes compacts Rg by an additional 25% (both poor- and moderate-growth conditions). Most of the compaction occurs in the axial direction, with the largest semi-axis length being shortened by 25%. The DNA polymer also becomes more spherical, as shown by a decrease in Ad. The results are consistent with a physical picture in which without ribosomes, the nucleoid is more highly compressed in the radial dimension than the axial dimension by the cell geometry. When polysomes occupy a substantial volume fraction, the nucleoid is compressed further. It preferentially compresses along the axial direction. The polysomes approach the walls more closely than the DNA polymer because they are more flexible and lose less configurational entropy there. The net result is a highly compacted nucleoid with polysomes concentrated in the endcaps and, to a lesser extent, at the cylindrical sidewalls.
Table 2.
Size and shape of the DNA polymer in various simulation conditions
| Growth condition∗ | Poor | Poor | Poor | Poor | Poor | Moderate | Moderate | Moderate | Moderate |
|---|---|---|---|---|---|---|---|---|---|
| DNA | + | + | + | + | − | + | + | + | − |
| Confined in spherocylinder | − | + | + | + | + | − | + | + | + |
| Monomeric ribosomes | − | − | + | − | − | − | − | − | − |
| Polysomes | − | − | − | + | + | − | − | + | + |
| Rg (nm)† | 2062 | 635 | 597 | 471 | NA | 2383 | 758 | 577 | NA |
| a (nm)‡ | 3787 | 1380 | 1299 | 1001 | NA | 4385 | 1633 | 1236 | NA |
| b (nm)‡ | 2163 | 242 | 219 | 233 | NA | 2520 | 322 | 264 | NA |
| c (nm)‡ | 1486 | 239 | 211 | 227 | NA | 1732 | 317 | 256 | NA |
| Ad§ | 0.270 | 0.836 | 0.850 | 0.732 | NA | 0.268 | 0.797 | 0.770 | NA |
See Table 1 for amount of DNA, size of containing spherocylinder, and number of ribosomes for each condition.
Radius of gyration for the DNA polymer.
a, b, and c are the semi-axis lengths of a spheroid with the same moments of inertia as the DNA polymer (42). For a sphere a = b = c and a cylinder, a >> (b = c).
Asphericity of the DNA polymer (43). This quantifies the deviation from a spherical shape (Ad = 0 is a perfect sphere, and Ad = 1 is a perfect cylinder).
For the poor-growth condition, we repeated the same calculations using only monomeric ribosomes instead of polysomes with the same total number of ribosomes in each case. The ribosome monomers approach the sidewall more closely than the polysomes (Fig. 3 B and Fig. S1), perhaps because they have no configurational entropy to lose. Relative to the case of no ribosomes, the Rg of the DNA polymer decreases by 6% and the semi-axis lengths decrease by 10–12%, resulting in a slightly less spherical polymer.
Discussion
Nucleoid-polysome segregation: comparison with experiment
Various experimental methods have been used to study the spatial distribution of both the nucleoid and the ribosomes (3,6–8,23,44–46). The consensus view is that the nucleoid is an irregular region of space near the central axis of the cytoplasm that is highly enriched in DNA, has a smaller average mass density than the periphery, and is strongly depleted of ribosomes. In Fig. 3 E we show an EM image of a thin, 40-nm slice of an E. coli cell grown in rich beef extract medium (reproduced from Hobot et al. (46)). The dark dots in the EM image are ribosomes, which concentrate near the cell wall and especially near the poles. The nucleoid appears to avoid the cytoplasmic membrane along the cylindrical wall and at the endcaps (45). We were unable to simulate cells under rich-growth conditions similar to those displayed in Fig. 3 E. Nevertheless, the qualitative agreement between the EM images and our simulation results (Fig. 3) is striking. Two-color fluorescence images of DNA and ribosomes in B. subtilis (7,8) and electron cryotomography of Bdellovibrio bacteriovorus cells (47) further support strong ribosome segregation to the cytoplasmic periphery. This segregation is apparently reduced in Caulobacter crescentus (48). We were unable to test the model for species other than E. coli because we lacked the necessary cellular content measurements.
Effects of transcription- and translation-halting drugs
When cells are treated with rifampin, which inhibits transcription, the axial extent of the nucleoid expands by an estimated factor of 1.7 (23). After transcription has been halted, the fraction of ribosomes that are present as polysomes presumably decreases as mRNA is translated and degraded. Fig. 3, B and C, and Fig. S1 compare the ribosome and DNA distributions for polysomes and the same number of monomeric ribosomes under poor-growth conditions. Monomeric ribosomes tend to locate along the cylindrical wall to a greater extent than the polysomes, which prefer the endcaps. As a consequence, in the transition from all polysomes to all monomeric ribosomes, the model DNA polymer indeed expands axially. However, the expansion factor is only 1.3, which is substantially smaller than the estimate from experiment. This may well arise from comparing poor-growth conditions in the model with rich-growth conditions in the experiments. The much higher overall concentration of ribosomes in rich conditions may amplify the effect on the axial extent of DNA of a transition from polysomes to monomer ribosomes. Alternatively, our simple DNA model may not be sufficiently compressible. The effect of rifampin on the experimental distribution of ribosomes remains unclear. Experimental data obtained in B. subtilis under different treatments and phases of the cell cycle are in conflict (7,8), and relevant data for E. coli are lacking. However, our model predicts that rifampin treatment would cause ribosomes to move from the endcaps to form a thicker layer along the cylindrical portion of the cell wall.
Upon treatment with chloramphenicol, a drug that halts translation, the axial dimension of nucleoids contracts by an estimated factor of 1.25 (23). This has been interpreted as arising from the loss of the expansive force of coupled transcription, translation, and insertion (transertion), an effect that is missing from our model. Because this mechanical coupling is missing from our model, it may be that the size of our DNA polymer is more compact than it would be in the live cells. We propose that the transertion mechanism works mainly in the radially direction, for which the distance between the confined DNA polymer and the membrane is shorter. This radial expansion could appear as an axial expansion if the cell elongates while radial pinning of the DNA occurs. The strong segregation of DNA from ribosomes in the polar endcaps, as shown experimentally and recovered in our model (Fig. 3), would indicate that transertion is primarily confined to the cylindrical walls (where DNA comes closer to the cytoplasmic membrane) and is less important in the endcap region. Experimentally, the distance over which the DNA is depleted in the endcap region is ∼500 nm (23). If the average mRNA is only 300 nm in length, it is hard to see how a partially transcribed mRNA would be able to span the 500 nm gap, not to mention the entropic penalty that would be incurred for stretching the mRNA.
Cotranscriptional translation drives the formation of a protein factory at the cell periphery
From the perspective of cellular function, spatial separation of the ribosomes from the chromosomal DNA has been puzzling for a long time. Multiple ribosomes begin making proteins from each mRNA template while RNAP is still producing the template itself (49), coupling transcription to translation. There are several known phenomena that require simultaneous binding between ribosomes and mRNA and between mRNA and RNA polymerase. In addition to its involvement in general transcription (12,13), this coupling is also essential for transcriptional polarity (15) and attenuation (14). This suggests that cotranscriptional translation occurs primarily at the interface between the nucleoid and the ribosome-rich cytoplasmic periphery. Accordingly, Bohrmann et al. (44) used EM of thin slices of cryo-fixed E. coli to infer a nucleoid geometry comprising a dense core near the cell's central axis plus multiple extended arms projecting outward toward the cytoplasmic periphery. They suggested that the arms correspond to the regions of the genome that are most actively transcribed. In this way, ribosomes could nestle among the nucleoid arms, enabling them to encounter actively transcribing RNAP and process nascent mRNA chains as they form. This predicts that RNAP should also concentrate at the interface between the nucleoid and the ribosomes. Indeed, EM images of cells immunostained for RNAP showed ∼65% of the RNAP at this interface (50).
Our model of segregation of polysomes by entropic forces suggests a novel (to our knowledge) entropic driving force by which the most rapidly transcribed genes would migrate to the cytoplasmic periphery where ribosomes concentrate. We suppose that transcription and translation of an active gene may begin anywhere in the nucleoid region. Both EM images and our simulations show a few ribosomes even in the central region of the nucleoid (Fig. 3, B and C). During transcription, several transcripts may be elongating from the same locus. As time goes on, each mRNA may spawn a polysome as successive ribosomes assemble and initiate translation. As these nascent polysomes grow longer, the entropic force will favor placement of the active gene and its associated mRNA strands and polysomes at the cell periphery. Once the active gene has found the periphery and grown many polysomes, the force maintaining its localization will persist as long as conditions dictate rapid expression of that gene.
A localized region in the cellular periphery that concentrates actively expressed genes, associated RNA polymerase, ribosomes, and ribosomal subunits could function as a sort of protein factory, rapidly and efficiently producing proteins that are important for a given set of external conditions. Upon termination of translation, ribosomes are disassembled into smaller components. We do not know their diffusion coefficients, but it is likely that diffusion of the subunits is slow, especially within the DNA meshwork of the nucleoid. If so, the concentration of ribosomes and actively transcribed genes in the cytoplasmic periphery would accelerate the process by which the translation apparatus disassembles, searches for a new initiation site by diffusion, and reassembles. The same segregation mechanism places ribosomes in close proximity to the cytoplasmic membrane, enabling the translation mechanism to efficiently insert membrane proteins.
Finally, several in vitro studies have shown a propensity of RNA polymerase to initiate transcription at terminal loops of DNA plectonemes, perhaps because the curvature of the loop facilitates wrapping of DNA around RNA polymerase (51). An intriguing result from our simulations is the different spatial distributions of mono-, di-, and trifunctional DNA beads (Fig. 4). The polymer preferentially places monofunctional beads (i.e., terminal loops of DNA plectonemes) near the cylindrical cell wall because they suffer a much smaller loss of configurational entropy there compared with di- or trifunctional beads. This suggests a mechanism by which transcription initiation sites might preferentially locate near the cell walls, further enhancing the efficiency of protein production.
Connection to other models
Other investigators have attempted to model condensation of the nucleoid and its segregation from the cytoplasmic periphery at various levels of detail. Odijk (52) postulated a two-phase model with one compartment containing the chromosomal DNA, and examined the partitioning of small globular proteins into the two compartments. This model attributes the phase segregation of nucleoid from the protein-rich periphery to the balance of osmotic pressure in the two compartments. Ribosomes were neglected in the model; it was stated that “they exert a negligible influence on the free-energy balance” between compartments. Our MC simulations might be viewed as an explicit realization of Odijk's theoretical model in a cell-shaped volume, using a particular set of size and charge parameters for the hard spheres. Of importance, no Coulombic effects are necessary to cause significant ribosome segregation.
The effects of configurational and translational entropy revealed by our model calculations have long been appreciated in different contexts. Stiff polymers tend to avoid hard walls to maximize conformational entropy (28). In mixtures of a few large hard spheres with numerous small hard spheres, the large spheres tend to aggregate to minimize the volume excluded to movement of the smaller spheres, thus increasing the smaller spheres' collective translational entropy. This has been suggested as a mechanism that would tend to colocalize actively transcribed rrn operons, for example (53). Others have proposed that the segregation of the two daughter chromosomes may be driven by an entropically favorable demixing of the two chromosomes (27). With our computational resources, we were unable to substitute two chromosomes for the single chromosome in our model to test for this demixing phenomenon. Remarkably, all of these aggregation and segregation effects arise in the complete absence of interparticle attractive forces.
Conclusions
We have presented a simple, hard-sphere model of the DNA and ribosomes in an E. coli cell that captures the observed segregation between nucleoid and ribosomes. We based the copy number, size, and physical properties of the components of our model on experimental results for two different growth conditions. In both conditions, the spatial segregation of DNA and ribosomes arises entirely from an entropically driven demixing of the plectonemic DNA polymer and ribosomes. The Rg of the DNA decreases by a factor of 3 when we confine the DNA polymer inside the spherocylindrical cell shape, and Ad increases from 0.27 to 0.8. Rg decreases by an additional factor of 1.25 when we include ribosomes in the model as either monomers or chains of monomers (polysomes). This decrease is primarily the result of a compaction of the DNA polymer along the long axis of the cell. The ribosome-rich cytoplasmic periphery is thicker near the endcaps of the cell and thinner along the cylindrical walls of the cell. We predict that upon a transition from all ribosome monomers to polysomes, the nucleoid would compress axially but expand radially. In our model, the coupling of transcription to translation would appear to be limited to a thin region near the surface of the nucleoid. The preference of the DNA polymer to place the tips of plectonemes near the surface may bring the site of transcription initiation near the ribosome-rich periphery. The continued expression of a desired genetic locus may thus provide a force that maintains the position of the gene near the ribosome-rich periphery. This placement of a gene near the periphery may be a general phenomenon that enhances the kinetics of protein expression when necessary. It need not involve specific properties of the genetic locus or protein.
Acknowledgments
J.M., Y.L., and A.Y. were supported by the National Science Foundation through the UW-Madison Nanoscale Science and Engineering Center (DMR-0832760) and CHE-0717569. B.P.B. and J.C.W. were supported by the National Institute of General Medical Sciences under grant R01GM086468 (an American Recovery and Reinvestment Act grant) and by the National Science Foundation under grant CHE-0452375. B.P.B. was supported in part by a National Institutes of Health training grant (NIH T32 GM08293). Computational support was provided by the National Center for Supercomputing Applications (Abe cluster) under grant number TG-CHE090065 and the Center for High Throughput Computing (UW-Madison) Condor supercomputing facility. This study was partially supported by the Donors of the Petroleum Research Fund, administered by the American Chemical Society.
Contributor Information
Arun Yethiraj, Email: yethiraj@chem.wisc.edu.
James C. Weisshaar, Email: weisshaar@chem.wisc.edu.
Supporting Material
References
- 1.Gitai Z. The new bacterial cell biology: moving parts and subcellular architecture. Cell. 2005;120:577–586. doi: 10.1016/j.cell.2005.02.026. [DOI] [PubMed] [Google Scholar]
- 2.Shapiro L., McAdams H.H., Losick R. Why and how bacteria localize proteins. Science. 2009;326:1225–1228. doi: 10.1126/science.1175685. [DOI] [PMC free article] [PubMed] [Google Scholar]
- 3.Valkenburg J.A., Woldringh C.L. Phase separation between nucleoid and cytoplasm in Escherichia coli as defined by immersive refractometry. J. Bacteriol. 1984;160:1151–1157. doi: 10.1128/jb.160.3.1151-1157.1984. [DOI] [PMC free article] [PubMed] [Google Scholar]
- 4.Espeli O., Mercier R., Boccard F. DNA dynamics vary according to macrodomain topography in the E. coli chromosome. Mol. Microbiol. 2008;68:1418–1427. doi: 10.1111/j.1365-2958.2008.06239.x. [DOI] [PubMed] [Google Scholar]
- 5.Wang X., Liu X., Sherratt D.J. The two Escherichia coli chromosome arms locate to separate cell halves. Genes Dev. 2006;20:1727–1731. doi: 10.1101/gad.388406. [DOI] [PMC free article] [PubMed] [Google Scholar]
- 6.Cabrera J.E., Jin D.J. The distribution of RNA polymerase in Escherichia coli is dynamic and sensitive to environmental cues. Mol. Microbiol. 2003;50:1493–1505. doi: 10.1046/j.1365-2958.2003.03805.x. [DOI] [PubMed] [Google Scholar]
- 7.Lewis P.J., Thaker S.D., Errington J. Compartmentalization of transcription and translation in Bacillus subtilis. EMBO J. 2000;19:710–718. doi: 10.1093/emboj/19.4.710. [DOI] [PMC free article] [PubMed] [Google Scholar]
- 8.Mascarenhas J., Weber M.H.W., Graumann P.L. Specific polar localization of ribosomes in Bacillus subtilis depends on active transcription. EMBO Rep. 2001;2:685–689. doi: 10.1093/embo-reports/kve160. [DOI] [PMC free article] [PubMed] [Google Scholar]
- 9.Romantsov T., Battle A.R., Hendel J.L., Martinac B., Wood J.M. Protein localization in Escherichia coli cells: comparison of cytoplasmic membrane proteins ProP, LacY, ProW, AqpZ, MscS, and MscL. J. Bacteriol. 2009 doi: 10.1128/JB.00967-09. JB.00967–00909-JB.00967–00909. [DOI] [PMC free article] [PubMed] [Google Scholar]
- 10.Romantsov T., Helbig S., Wood J.M. Cardiolipin promotes polar localization of osmosensory transporter ProP in Escherichia coli. Mol. Microbiol. 2007;64:1455–1465. doi: 10.1111/j.1365-2958.2007.05727.x. [DOI] [PubMed] [Google Scholar]
- 11.Lutkenhaus J. Assembly dynamics of the bacterial MinCDE system and spatial regulation of the Z ring. Annu. Rev. Biochem. 2007;76:539–562. doi: 10.1146/annurev.biochem.75.103004.142652. [DOI] [PubMed] [Google Scholar]
- 12.Burmann B.M., Schweimer K., Rösch P. A NusE:NusG complex links transcription and translation. Science. 2010;328:501–504. doi: 10.1126/science.1184953. [DOI] [PubMed] [Google Scholar]
- 13.Proshkin S., Rahmouni A.R., Nudler E. Cooperation between translating ribosomes and RNA polymerase in transcription elongation. Science. 2010;328:504–508. doi: 10.1126/science.1184939. [DOI] [PMC free article] [PubMed] [Google Scholar]
- 14.Yanofsky C. Attenuation in the control of expression of bacterial operons. Nature. 1981;289:751–758. doi: 10.1038/289751a0. [DOI] [PubMed] [Google Scholar]
- 15.Ruteshouser E.C., Richardson J.P. Identification and characterization of transcription termination sites in the Escherichia coli lacZ gene. J. Mol. Biol. 1989;208:23–43. doi: 10.1016/0022-2836(89)90085-5. [DOI] [PubMed] [Google Scholar]
- 16.Woldringh C.L. The role of co-transcriptional translation and protein translocation (transertion) in bacterial chromosome segregation. Mol. Microbiol. 2002;45:17–29. doi: 10.1046/j.1365-2958.2002.02993.x. [DOI] [PubMed] [Google Scholar]
- 17.Wallin E., von Heijne G. Genome-wide analysis of integral membrane proteins from eubacterial, archaean, and eukaryotic organisms. Protein Sci. 1998;7:1029–1038. doi: 10.1002/pro.5560070420. [DOI] [PMC free article] [PubMed] [Google Scholar]
- 18.Woldringh C.L., Jensen P.R., Westerhoff H.V. Structure and partitioning of bacterial DNA: determined by a balance of compaction and expansion forces? FEMS Microbiol. Lett. 1995;131:235–242. doi: 10.1111/j.1574-6968.1995.tb07782.x. [DOI] [PubMed] [Google Scholar]
- 19.Dame R.T. The role of nucleoid-associated proteins in the organization and compaction of bacterial chromatin. Mol. Microbiol. 2005;56:858–870. doi: 10.1111/j.1365-2958.2005.04598.x. [DOI] [PubMed] [Google Scholar]
- 20.Cunha S., Woldringh C.L., Odijk T. Polymer-mediated compaction and internal dynamics of isolated Escherichia coli nucleoids. J. Struct. Biol. 2001;136:53–66. doi: 10.1006/jsbi.2001.4420. [DOI] [PubMed] [Google Scholar]
- 21.Blattner F.R., Plunkett G., 3rd, Shao Y. The complete genome sequence of Escherichia coli K-12. Science. 1997;277:1453–1462. doi: 10.1126/science.277.5331.1453. [DOI] [PubMed] [Google Scholar]
- 22.Dworsky P., Schaechter M. Effect of rifampin on the structure and membrane attachment of the nucleoid of Escherichia coli. J. Bacteriol. 1973;116:1364–1374. doi: 10.1128/jb.116.3.1364-1374.1973. [DOI] [PMC free article] [PubMed] [Google Scholar]
- 23.Cabrera J.E., Cagliero C., Jin D.J. Active transcription of rRNA operons condenses the nucleoid in Escherichia coli: examining the effect of transcription on nucleoid structure in the absence of transertion. J. Bacteriol. 2009;191:4180–4185. doi: 10.1128/JB.01707-08. [DOI] [PMC free article] [PubMed] [Google Scholar]
- 24.Zimmerman S.B. Toroidal nucleoids in Escherichia coli exposed to chloramphenicol. J. Struct. Biol. 2002;138:199–206. doi: 10.1016/s1047-8477(02)00036-9. [DOI] [PubMed] [Google Scholar]
- 25.Boles T.C., White J.H., Cozzarelli N.R. Structure of plectonemically supercoiled DNA. J. Mol. Biol. 1990;213:931–951. doi: 10.1016/S0022-2836(05)80272-4. [DOI] [PubMed] [Google Scholar]
- 26.Ubbink J., Odijk T. Electrostatic-undulatory theory of plectonemically supercoiled DNA. Biophys. J. 1999;76:2502–2519. doi: 10.1016/S0006-3495(99)77405-9. [DOI] [PMC free article] [PubMed] [Google Scholar]
- 27.Jun S., Wright A. Entropy as the driver of chromosome segregation. Nat. Rev. Microbiol. 2010;8:600–607. doi: 10.1038/nrmicro2391. [DOI] [PMC free article] [PubMed] [Google Scholar]
- 28.Oosawa F., Asakura S. Surface tension of high-polymer solutions. J. Chem. Phys. 1954;22:1255. [Google Scholar]
- 29.Romantsov T., Fishov I., Krichevsky O. Internal structure and dynamics of isolated Escherichia coli nucleoids assessed by fluorescence correlation spectroscopy. Biophys. J. 2007;92:2875–2884. doi: 10.1529/biophysj.106.095729. [DOI] [PMC free article] [PubMed] [Google Scholar]
- 30.Bliska J.B., Cozzarelli N.R. Use of site-specific recombination as a probe of DNA structure and metabolism in vivo. J. Mol. Biol. 1987;194:205–218. doi: 10.1016/0022-2836(87)90369-x. [DOI] [PubMed] [Google Scholar]
- 31.Kennell D., Riezman H. Transcription and translation initiation frequencies of the Escherichia coli lac operon. J. Mol. Biol. 1977;114:1–21. doi: 10.1016/0022-2836(77)90279-0. [DOI] [PubMed] [Google Scholar]
- 32.Slayter H., Kiho Y., Rich A. An electron microscopic study of large bacterial polyribosomes. J. Cell Biol. 1968;37:583–590. doi: 10.1083/jcb.37.2.583. [DOI] [PMC free article] [PubMed] [Google Scholar]
- 33.Brandt F., Etchells S.A., Baumeister W. The native 3D organization of bacterial polysomes. Cell. 2009;136:261–271. doi: 10.1016/j.cell.2008.11.016. [DOI] [PubMed] [Google Scholar]
- 34.Schuwirth B.S., Borovinskaya M.A., Cate J.H. Structures of the bacterial ribosome at 3.5 Å resolution. Science. 2005;310:827–834. doi: 10.1126/science.1117230. [DOI] [PubMed] [Google Scholar]
- 35.Bremer, H., and P. P. Dennis. 1996. Modulation of chemical composition and other parameters of the cell by growth rate. In Escherichia coli and Salmonella: Cellular and Molecular Biology. R. Curtis III, F. C. Neidhardt, …, H. E. Umbarger, editors. ASM Press, Washington, DC. 1553–1569.
- 36.Woldringh C.L., Nanninga N. Structure of nucleoid and cytoplasm in the intact cell. In: Nanninga N., editor. Molecular Cytology of Escherichia coli. Academic Press; London: 1985. pp. 161–197. [Google Scholar]
- 37.Madras N., Janse van Rensburg E. Monte Carlo study of the θ-point for collapsing trees. J. Stat. Phys. 1997;86:1–36. [Google Scholar]
- 38.Yethiraj A. Molecular modeling of polymers at surfaces. Chem. Eng. J. 1999;74:109–115. [Google Scholar]
- 39.Wall F.T., Mandel F. Macromolecular dimensions obtained by an efficient Monte Carlo method without sample attrition. J. Chem. Phys. 1975;63:4592. [Google Scholar]
- 40.de Pablo J.J., Laso M., Suter U.W. Simulation of polyethylene above and below the melting point. J. Chem. Phys. 1992;96:2395–2403. [Google Scholar]
- 41.Dickman R., Hall C.K. High density Monte Carlo simulations of chain molecules: bulk equation of state and density profile near walls. J. Chem. Phys. 1988;89:3168. [Google Scholar]
- 42.Yethiraj A. Monte Carlo simulation of confined semiflexible polymer melts. J. Chem. Phys. 1994;101:2489–2497. [Google Scholar]
- 43.Yethiraj A. A Monte Carlo simulation study of branched polymers. J. Chem. Phys. 2006;125:204901. doi: 10.1063/1.2374884. [DOI] [PubMed] [Google Scholar]
- 44.Bohrmann B., Villiger W., Kellenberger E. Coralline shape of the bacterial nucleoid after cryofixation. J. Bacteriol. 1991;173:3149–3158. doi: 10.1128/jb.173.10.3149-3158.1991. [DOI] [PMC free article] [PubMed] [Google Scholar]
- 45.Robinow C., Kellenberger E. The bacterial nucleoid revisited. Microbiol. Rev. 1994;58:211–232. doi: 10.1128/mr.58.2.211-232.1994. [DOI] [PMC free article] [PubMed] [Google Scholar]
- 46.Hobot J.A., Villiger W., Kellenberger E. Shape and fine structure of nucleoids observed on sections of ultrarapidly frozen and cryosubstituted bacteria. J. Bacteriol. 1985;162:960–971. doi: 10.1128/jb.162.3.960-971.1985. [DOI] [PMC free article] [PubMed] [Google Scholar]
- 47.Milne J.L.S., Subramaniam S. Cryo-electron tomography of bacteria: progress, challenges and future prospects. Nat. Rev. Microbiol. 2009;7:666–675. doi: 10.1038/nrmicro2183. [DOI] [PMC free article] [PubMed] [Google Scholar]
- 48.Montero Llopis P., Jackson A.F., Jacobs-Wagner C. Spatial organization of the flow of genetic information in bacteria. Nature. 2010;466:77–81. doi: 10.1038/nature09152. [DOI] [PMC free article] [PubMed] [Google Scholar]
- 49.Miller O.L., Jr., Hamkalo B.A., Thomas C.A., Jr. Visualization of bacterial genes in action. Science. 1970;169:392–395. doi: 10.1126/science.169.3943.392. [DOI] [PubMed] [Google Scholar]
- 50.Dürrenberger M., Bjornsti M.A., Kellenberger E. Intracellular location of the histonelike protein HU in Escherichia coli. J. Bacteriol. 1988;170:4757–4768. doi: 10.1128/jb.170.10.4757-4768.1988. [DOI] [PMC free article] [PubMed] [Google Scholar]
- 51.Travers A., Muskhelishvili G. A common topology for bacterial and eukaryotic transcription initiation? EMBO Rep. 2007;8:147–151. doi: 10.1038/sj.embor.7400898. [DOI] [PMC free article] [PubMed] [Google Scholar]
- 52.Odijk T. Osmotic compaction of supercoiled DNA into a bacterial nucleoid. Biophys. Chem. 1998;73:23–29. doi: 10.1016/s0301-4622(98)00115-x. [DOI] [PubMed] [Google Scholar]
- 53.Marenduzzo D., Micheletti C., Cook P.R. Entropy-driven genome organization. Biophys. J. 2006;90:3712–3721. doi: 10.1529/biophysj.105.077685. [DOI] [PMC free article] [PubMed] [Google Scholar]
Associated Data
This section collects any data citations, data availability statements, or supplementary materials included in this article.