

Abstract
Aureochrome is a recently discovered blue light photosensor that controls a light-dependent morphology change. As a photosensor, it has a unique DNA binding domain (bZIP). Although the biological functions of aureochrome have been revealed, the fundamental photochemistry of this protein has not been elucidated. The photochemical reaction dynamics of the LOV (light, oxygen, or voltage) domain of aureochrome-1 (AUREO1-LOV) and the LOV domain with the bZIP domain (AUREO1-ZL) were studied by employing the transient-grating (TG) technique, using size-exclusion chromatography to verify results. For both samples, adduct formation takes place with a time constant of 2.8 μs. Although significant diffusion changes were observed for both AUREO1-LOV and AUREO1-ZL after adduct formation, the origins of these changes were significantly different. The TG signal of AUREO1-LOV was strongly concentration-dependent. From analysis of the signal, it was concluded that AUREO1-LOV exists in equilibrium between the monomer and dimer, and dimerization of the monomer is the main reaction, i.e., irradiation with blue light enhances the strength of the interdomain interaction. On the other hand, the reaction of AUREO1-ZL is independent of concentration, suggesting that an intraprotein conformational change occurs in the bZIP domain with a time constant of 160 ms. These results revealed the different reactions and roles of the two domains; the LOV domain acts as a photosensor, leading to a subsequent conformational change in the bZIP domain, which should change its ability to bind to DNA. A model is proposed that demonstrates how aureochrome uses blue light to control its affinity for DNA.
Introduction
Because light is essential for life, photosensors that obtain light information about the environment are of great importance. In particular, blue-light sensors are recognized to be of primary importance for a variety of functions (1–10). One of the blue-light sensors, the LOV domain, which is a subfamily of the Per-ARNT-Sim (PAS) superfamily, acts as a module for protein-protein interactions for signaling, and is found in a variety of sensor proteins (11–17). The tertiary structure of a LOV/PAS domain is commonly composed of an assembly of short α-helices and β-strands (PAS core), an α-helix (helical connector), and an antiparallel β-sheet composed of three strands (β-scaffold) (18–21). This LOV domain has a flavin mononucleotide (FMN) as the chromophore. Revealing the reaction mechanism of the LOV domain has been attracting many researchers.
Recently, a novel photosensor protein containing the LOV domain, aureochrome (AUREO), was discovered in Vaucheria frigida (22). There are two types of aureochrome, aureochrome-1 (AUREO1, 38.6 kDa) and aureochrome-2 (AUREO2, 39.2 kDa). Both AUREO1 and AUREO2 are found in a stramenopile alga, and these proteins have different functions. RNA interference experiments demonstrated that AUREO1 controls branch development, whereas AUREO2 allows development of a sex organ. This protein consists of a LOV domain at the C-terminal and basic region/leucine zipper (bZIP) domains. Aligned sequences of the LOV domain of AUREO are similar to LOV1 and LOV2 domains of phototropins, which are well-studied proteins that behave as blue-light receptors in plants but lack the Glu-Lys salt bridge that is conserved in all other known LOV domains. bZIP domains are known to form α-helical structures, and are widespread among eukaryotes, where they serve as transcription regulators. Hence, AUREO is a unique photosensor containing the bZIP domain. It has been reported that the bZIP domain of AUREO may be S-type, because it possesses a DNA binding site that recognizes the sequence TGACGT (22).
Although the primary sequence and function of AUREO have been elucidated, knowledge of the photoreaction dynamics is very limited. The LOV domain has an absorption spectrum with a peak at ∼447 nm. Upon irradiation with blue light, the peak shifts to 390 nm (formation of the LOV390 species) (23–27). From the characteristic spectrum and analogy with other LOV domain reactions, it seems reasonable to attribute this species to an adduct between FMN and a cysteinyl residue, which should be a trigger for subsequent reactions to realize the biological function. The half-lifetime of the active state determined by fluorescence measurements was reported to be 4.9 min (22).
The reaction mechanism of photosensor proteins containing both LOV and bZIP domains should be interesting, and it may open the door to a new type of photosensor. However, the photochemistry after adduct formation has not yet been clarified. One of the main reasons for the lack of research into the photochemistry of AUREO has been the difficulty of large-scale expression of this protein. However, in recent work, adequate amounts of this protein were successfully prepared for biophysical analysis (O. Hisatomi, K. Furuya, F. Takahashi, and H. Kataoka, unpublished). This allowed access to the LOV and bZIP domains of AUREO, making feasible a detailed investigation of the photoreaction of these proteins.
In this study, we investigated the photoreaction kinetics of AUREO1 from Vaucheria frigida. To elucidate the molecular mechanism of the reactions in detail, we used samples of the LOV domain of AUREO1 (AUREO1-LOV, 17.6 kDa, containing Pro204–Lys348) and the AUREO1-LOV domain containing the bZIP domain (AUREO1-ZL, 27.3 kDa, containing Gly114–Lys348), each of which has an additional eight amino acids (LEHHHHHH) at its C-terminal end. It was confirmed that AUREO1-ZL can selectively bind to a specific DNA sequence in AUREO1, TGACGT (O. Hisatomi, K. Furuya, F. Takahashi, and H. Kataoka, unpublished). Although the full-length protein is quite unstable and is not yet available, it is worth studying the photoreaction of these truncated proteins before studying the full-length protein to clarify the role of the domains.
We mostly used the laser-induced transient-grating (TG) method to probe the photoreaction of the prepared samples. The TG signal is created by diffraction of a probe light due to a spatial-sinusoidally modulated refractive index change induced by an interference pattern of the excitation light. Under the nonresonant condition of the probe light, the TG signal reflects the temperature change (thermal effect), volume change, and absorption spectrum change. Although the TG technique is applicable only to photoinitiated reactions, a big advantage is that the time trace of the signal reflecting the change in molecular volume, energy, or diffusion enables detection of reaction kinetics that cannot be measured using traditional UV/vis absorption spectroscopy (28–30). In this study, size-exclusion chromatography (SEC) was also used to support the data obtained from the TG measurement. Our results reveal the different reactions and roles of the two domains clearly: the photosensing role of the LOV domain, and the conformational change of the bZIP domain that should induce a biological function.
Material and Methods
Measurement
The experimental setup used was similar to that reported previously (28–30). Briefly, a laser pulse from a dye laser (HyperDye 300, Lumonics, Denver, CO; wavelength 465 nm, <10 μJ/pulse) pumped by an XeCl excimer laser (Lambda Physik, Santa Clara, CA; 308 nm) was used as an excitation beam for the TG experiments. The laser beam was split in two by a beam splitter, and these beams were crossed inside a sample to produce an interference pattern of the light intensity. A diode laser (835 nm) was also used for the TG experiments. The TG signal was isolated from the excitation laser beam with a glass filter and a pinhole and detected by a photomultiplier tube (R1477, Hamamatsu, Hamamatsu City, Japan). The grating wavenumber (q) was changed by changing the crossing angle of the two excitation beams. The magnitude of q was measured by the decay rate constant of the thermal grating signal of a calorimetric standard sample (bromocresole purple), which releases all of the photon energy from excitation as thermal energy within the response time of our system (∼20 ns) and the thermal diffusivity of water (as described below). Absorbance of the sample solution at 465 nm was adjusted to be 0.53 (250 μM). To avoid possible multiexcitation, the sample was stirred after each laser shot. (Hence, the repetition frequency was ∼0.5 shot/min.) It was calculated that since the laser power was very weak (<10 μJ/pulse) and the volume of the light-illuminated region (∼2 μL) was sufficiently smaller than the sample volume (∼200 μL), the photoproduct could not accumulate in the measured region and the effect of the multiexcitation should be negligible. (By our calculations, even if we used 10 μJ/pulse excitation and assumed a reaction quantum yield of unity, the concentration of the product would be 1.3 μM/laser shot. This concentration is sufficiently smaller than that of the reactant (250 μM).) Ten recorded signals were averaged to improve the signal/noise (S/N) ratio of the signal.
SEC measurements were performed using an ÄKTA purifier system with a Superdex 200 5/150 GL column (Pharmacia, Uppsala, Sweden). The buffer used for the sample was also used for column equilibration and as the eluent. In the analysis of the SEC, standard marker proteins of known molecular mass were used to calibrate the column. The following size markers were used: 290 kDa, glutamate dehydrogenase (yeast); 142 kDa, lactate dehydrogenase (pig heart); 32 kDa, myokinase (yeast); 12.4 kDa, cytochrome c (horse heart). The apparent molecular mass of the sample was determined from the calibration curve. A xenon lamp (SX-UI500XQ, USHIO, Tokyo, Japan) was used for light illumination during the SEC measurements.
Circular dichroism (CD) measurements were performed using a CD spectropolarimeter (J720W1, JASCO, Tokyo, Japan). The path length of the sample cell was 2 mm. For the CD measurement of the light-activated sample, the sample solution was initially illuminated continuously by a blue laser (Micro Laser System, 445 nm, 38 mW) for ∼5 min to accumulate the product. The sample solution was quickly transferred to the CD instrument and the CD spectrum was recorded within 1 min. Since the half-lifetime of the active state is 4.9 min, this spectrum is considered to be that of the light state. Furthermore, the absorption spectrum was measured under the same conditions and it was confirmed by this method that the spectrum was indeed the same as that of the light state.
All samples were filtered with a centrifugal filter (Durapore PVDF 0.1 μm) before use. All measurements were performed at 23°C.
Materials
The expression plasmids were constructed as described previously (31,32). In brief, a XhoI site (465-471) in AUREO1 cDNA was mutated to CACGAG with aureo1-dXhoIF (5′-AGAGATCACGAGTACGAAAAAAGTTT-3′) and aureo1-dXhoIR (5′-GTACTCGTGATCTCTTTGCATGTTCT-3′) primers, using a PrimeSTAR mutagenesis kit (Takara, Kyoto, Japan). The AUREO1 sequences from Gly113 to Lys348 (for AUREO1-ZL) and from Pro204 to Lys348 (for AUREO1-LOV) were amplified with AUREO1-bZIPF (5′-GGAATTCCATGGGAAGTATTAGCTCTGAG-3′) and AUREO1-CTR (5′-CCGCTCGAGTTTTCGTCTAAGCATATTC-3′) primers and AUREO1-P204F (5′-GAATTCCATGGGTCCTGATTATTCACTAGT-3′) and AUREO1-CTR primers, respectively. (The N-terminal amino acid residue is methione as a start amino acid.) Amplified DNA fragments were inserted between the NcoI and XhoI sites of a pET23d plasmid vector and introduced into BL21(DE3) cells (Invitrogen, Carlsbad, CA). Cells were cultured in 2xYT containing ampicillin, and expression of recombinant AUREOs was induced by the addition of 1 mM isopropyl-b-D-thiogalactopyranoside. Cells were harvested by centrifugation and disrupted by sonication in a lysis buffer (400 mM NaCl, 2 mM MgCl2, 2 mM dithiothreitol, 0.2 mM phenylmethylsulfonyl fluoride, 80 μg/ml DNaseI, and 20 mM Tris-HCl, pH 7.0). Cell debris was removed by centrifugation at 65,000 × g for 15 min, and recombinant AUREO1s were purified with a Ni-NTA column (Ni SepharoseTM6 Fast Flow, GE Healthcare, Piscataway, NJ) according to the manufacturer's instructions. After removing imidazole, recombinant AUREOs were stored in buffer solution (400 mM NaCl, 1 mM dithiothreitol, and 20 mM Tris-HCl, pH 7.0) at 4°C until they were used for analysis.
Results
Photoreaction of AUREO1-LOV
Reaction kinetics
The photoreaction of the LOV domain of AUREO1 (AUREO1-LOV) was investigated first. The TG signal measured at a concentration of 250 μM and a grating wavenumber of q2 = 1.46 × 10¹¹ m−2 is shown in Fig. 1 a. The signal rose within the response time of the TG system (∼20 ns), decayed, and then showed two rise-decay profiles before completely decaying to the baseline. The assignments of these phases were made based on the dependence on the grating wavenumber (q). The initial decay-rise component and subsequent decay component were well described by a biexponential function. The time constant of the first component was 2.8 μs and was independent of q2. A lifetime of 2.8 μs is similar to the reported time constants for adduct formation of LOV domains such as phototropin-1-LOV1 (4.0 μs), phototropin-1-LOV2 (1.9 μs) (24,34), phototropin-2-LOV1 (0.8 μs) (34), phototropin-2-LOV2 (0.9 μs) (30), and FKF1-LOV (4 μs) (35). Furthermore, changes in the absorption spectrum indicated the formation of the adduct of AUREO1 (22). Although we do not have evidence of the adduct formation with this time constant, it may be reasonable to attribute this phase to the formation of an AUREO1-LOV adduct. The component with a lower rate constant (the decaying component in 100 μs in Fig. 1 a) was dependent on q2, and this value agreed with the thermal diffusivity (Dth) times the square of q, Dthq2, which was determined from the decay rate of the TG signal from the calorimetric reference sample (bromocresole purple in aqueous solution) under the same conditions. This characteristic rate constant indicates that the second component is the thermal grating signal.
Figure 1.
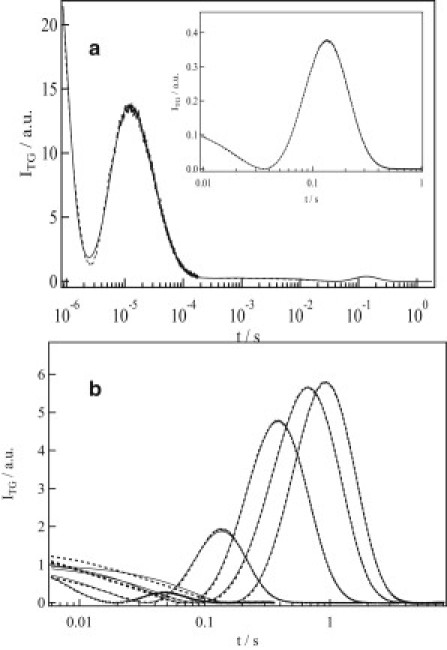
(a) A typical TG signal (dotted line) of AUREO1-LOV at a concentration of 250 μM at q2 = 15 × 1010 m−2. The line of best fit calculated based on a two-state model (Eqs. 1 and 3) is shown as a solid line. (Inset) Amplified signal of the diffusion peak. (b) The dependence of the diffusion signal of AUREO1-LOV on grating wavenumber (q) measured at, from left to right, q2 = 67, 15, 3.7, 2.0, and 1.5 × 10¹⁰ m−2 .
Therefore, the signal in the 10−6–10−3 s range of Fig. 1 a can be expressed by a biexponential function (the adduct formation process and the decay of the thermal grating signal), and the whole TG signal should be described as
| (1) |
where δnad and δnth denote the changes in refractive index caused by adduct formation and thermal grating, respectively, and kad is the rate constant of adduct formation. Furthermore, δnspe(t) is the species grating signal and represents the protein reaction. The second term represents the weak absorption contribution from adduct formation at the probe wavelength. In this study, we mostly focused our attention on the photochemical reaction occurring after this thermal grating signal, i.e., the species grating component δnspe(t).
To analyze the species grating signal, the TG signal was measured at various values of q. Because the rise-decay profile shifted as q was changed (Fig. 1 b), this profile represents protein diffusion processes. δnth is negative at the temperature used, so the changes in refractive index (δn) for the rise and decay components were determined to be negative and positive, respectively. From these signs, the rise and decay phases of the TG signal were attributed to diffusion of the reactant and product, respectively. Hence, the characteristic rise-decay profile (diffusion peak) is a clear indication that the product has a smaller diffusion coefficient (D) than the reactant. According to theoretical analysis, if D of AUREO1-LOV changes upon adduct formation () and then does not change further, the profile can be expressed as a biexponential function (28,29,36–38).
| (2) |
where δnR and δnP are the changes in refractive index of the reactant and product, respectively, and DR and DP are the diffusion coefficients of the reactant and product, respectively.
However, three prominent features were observed that cannot be explained by the above scenario. First, the profile of the diffusion peak does not fit a biexponential function. This feature is similar to phototropin-1-LOV2, where the profile was analyzed using a time-dependent D (34). Although the fact that the profile did not exhibit a biexponential fit does not necessarily mean that D is time-dependent, the following observations certainly indicate that an analysis based on a time-dependent D is appropriate. Second, the intensity of the species grating signal depended on q2 (Fig. 1 b). The TG signal over a fast timescale is weak and the intensity increases as the observation time range increases. Third, if the kinetics of the change in diffusion can be ignored, the time dependence should be expressed by exp(−Dq2t), and the shape of the signals plotted against q2t should be identical. However, when the signals were plotted against q2t, the signals did not appear to be superimposed (data not shown). This q2 dependence indicates that the apparent D changes during the observation time range. These three criteria show that D is time-dependent (30,34,39–43), so we concluded that DP is not constant over the experimental time range.
The signal from AUREO1-LOV was analyzed based on the model
where R, I, P, and k represent the reactant, an initial product (intermediate), the final product, and the rate constant of the change, respectively. In this case, the time profile of the TG signal can be expressed as (30,36)
| (3) |
where δnI and DI are the changes in refractive index caused by the formation of the intermediate species(I) and the diffusion coefficient of I, respectively.
To analyze the TG signal using the above equation to unambiguously determine the signal parameters, some parameters in Eq. 3 need to be found independently. First, the TG signal over a short time range (0.4–4 ms) was measured (at q2 = 5.3 × 10¹² m−2). On this short timescale, the signal decayed to the baseline monotonously, and this was expressed well by a single-exponential function. This implies that D does not change over a short time range, i.e., D of the adduct species (DI) is the same as DR (DI = DR in Eq. 3). From the single-exponential fitting, DR was unambiguously determined to be 9.8 × 10⁻¹¹ m2/s. Next, DP was determined to be 7.8 × 10⁻¹¹ m2/s from the biexponential fitting of the signal over a longer time range (0.4–4 s), in which the time dependence of D can be neglected. The good fit of the biexponential function means that D does not depend on time after 400 ms. Finally, by using these values of D, we could fit the signals well over the time range from 20 ms to 4 s (i.e., at various q2) using one adjustable parameter, k (Fig. 1 b). The time constant of the change in D from this fitting was 140 ms. This result clearly indicates that there is a reaction that takes place with this rate under these measurement conditions. The molecular origin of this change is described in the next section.
Comparison of DR with the D of water-soluble proteins of similar size, such as D = 9.0–9.5 × 10⁻¹¹ m2/s for chymotrypsinogen (25 kDa) (44) or D = 9.1 × 10⁻¹¹ m2/s for cryptocytochrome c (26 kDa) (45), reveals that DR is typical for a protein of the size of AUREO1-LOV (17.6 kDa). Therefore, the reactant in this reaction should be the monomer of AUREO1-LOV.
Concentration dependence of the TG signal and assignment of diffusion change
Next, the molecular origin of the observed change in D is considered. Generally, the origin of the change in D has been classified into two categories: oligomer formation and conformational change (diffusion-sensitive conformational change (DSCC)). We can discriminate between these origins based on the dependence of the rate on concentration. If the protein undergoes an intraprotein conformational change, the reaction rate (and D) should be independent of protein concentration, and the profile of the TG signal on any timescale should not depend on concentration, except for the absolute intensity. On the other hand, if this change in D is caused by a multimolecular process, the kinetics of the TG signal should be sensitive to protein concentration.
Before investigating the concentration dependence of the kinetics of the change in D, the diffusion signal was first measured at various concentrations (100–250 μM) over a long time range (400 ms to 6 s), i.e., at the low q of q2 = 1.6 × 10¹⁰ m−2. This timescale is longer than the time range of the change in D (140 ms at 250 μM in the previous section). It was expected that the profile of the signal would not depend on protein concentration, because the reaction kinetics (140 ms) cannot affect the diffusion signal even in the case of oligomer formation. However, an unexpected concentration dependence was observed; the relative signal normalized by the grating intensity just after the thermal grating signal (which reflects the number of photoexcited molecules) increased as the concentration decreased (Fig. 2 a).
Figure 2.
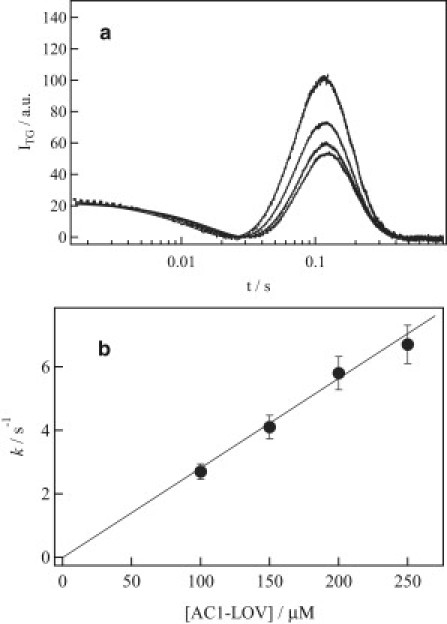
(a) Dependence of the diffusion signal of AUREO1-LOV on concentration measured at q2 = 1.6 × 10¹⁰ m−2. The concentrations are, from top to bottom, 100, 150, 200, and 250 μM. (b) Dependence of the rate constant (k) of the change in diffusion on concentration.
Because the reaction was completed before this time range, the intensity of the signal reflected the reaction efficiency, i.e., this concentration dependence should reflect that the population of the reactant that contributes to the diffusion signal increases as the concentration decreases. This result suggests that two species existed in the solution, a reactive and a nonreactive species, and that the fraction of the reactive species increased as the concentration decreased. (It should be noted here that the diffusion peak appeared because of a change in D. If photoexcitation did not lead to a change in D, a signal should not appear.) In other words, the photoexcitation of AUREO1-LOV yielded the blue-shifted species (LOV390) at any concentration, but at a high concentration, some fractions of the photoexcited species did not undergo a conformational change. The concentration dependence of the equilibrium suggests that an oligomer is involved in this phenomenon. In the previous section, we showed that the reactant is the monomer on the basis of the D value. Hence, the concentration dependence of the signal suggests that the dimer form exists, particularly at high concentration, and that it is not reactive.
The concentration dependence of the reaction rate was determined next by taking into account the concentration-dependent fraction of the reactive species. For this purpose, the TG signal was measured at various concentrations over a shorter time range (i.e., at a larger q2 of 1.8 × 10¹¹ m−2). The signals were analyzed using Eq. 3. The concentration dependence of the rate constant is shown in Fig. 2 b. The linear relationship of k versus concentration indicates that dimerization of the monomer is the main origin of the change in D. We measured the TG signal at a sufficiently weak power. The signal shape did not change by further decreasing the laser intensity. Hence, we consider that one monomer unit was excited to yield the dimer.
Size-exclusion chromatography measurements
To confirm that an equilibrium exists between the monomer and dimer using an independent method, the concentration dependence of the elution profile from SEC was examined. Fig. 3 a shows the elution profile of AUREO1-LOV at 296 K at a concentration of 175 μM. At this low concentration, the elution profile showed primarily a single peak. (Sometimes, tails appeared. We consider that the tailing of the SEC signal could be slightly decomposed fragments of the protein. Although we tried to purify the protein, it was difficult to avoid a small amount of contamination. However, we think such fragments do not undergo the photochemical reaction, since we observed only one diffusion coefficient of the reactant, which is reasonable for this protein. Therefore, this contamination should not affect the obtained results.) The molecular mass calculated from the peak position by using a calibration curve was 22.2 kDa (Fig. 3 c), which is fairly close to that of the monomer (17.8 kDa). When the initial concentration was increased from 175 to 350 μM, the peak shifted to an earlier elution volume. The molecular mass calculated from this peak (35.6 kDa) was close to that of a dimer, indicating a shift of distribution from monomer to dimer as the concentration increased. It should be noted here that the elution profile consisted of a single peak. If equilibration of the monomer and dimer is slow compared with the elution time (∼15 min), two peaks corresponding to the monomer and the dimer would be expected. The observation of a single peak that depended on the concentration indicated that the monomer and dimer achieve equilibrium within the elution time.
Figure 3.
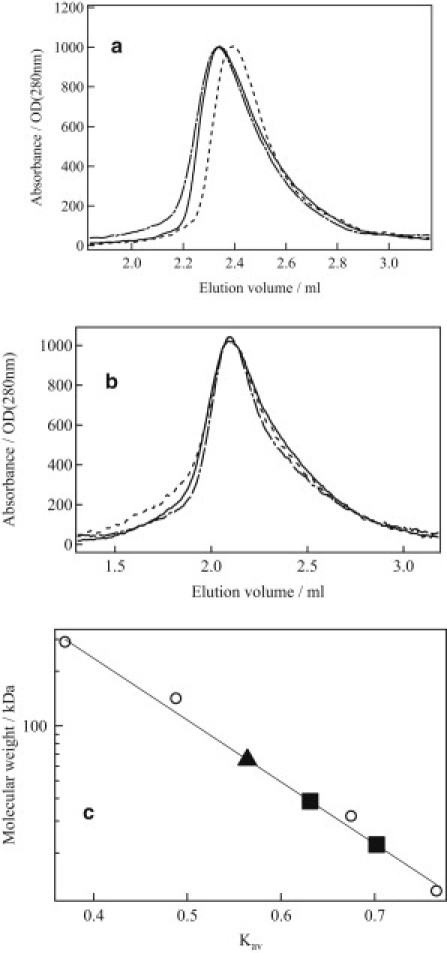
Elution profiles at 296 K from the concentration dependence experiments. (a) AUREO1-LOV: 350 μM, dark (solid line); 175 μM, dark (dotted line); 175 μM, light (dash-dotted line). (b) AUREO1-ZL: 250 μM, dark (solid line); 175 μM, dark (dotted line); 175 μM, light (dash-dotted line). (c) Partition coefficient (Kav) versus molecular weight. Kav = (Vr – V0)/(Vc – V0), where Vr is the volume of sample eluted, Vc the column volume (3 mL), and V0 the void volume of the column (0.93 mL). A calibration curve obtained using gel filtration standards (circles) is shown as a solid line. Squares represent the Kav for AUREO1-LOV. The square on the left is the position of a 350-μM sample in the dark superimposed on a 175-μM sample under irradiation with light. The square on the right is a 175-μM sample in the dark. The Kav for AUREO1-ZL (triangles) under light and dark conditions at 250 μM and 175 μM are superimposed.
The elution profile was also measured under light irradiation. The elution peak shifted to 38.5 kDa, which is consistent with that of the dimer (35.6 kDa). Therefore, SEC confirmed that an equilibrium exists between the monomer and dimer, and that the monomer is transformed into the dimer upon irradiation with blue light. It is important to stress that although SEC is a well established technique for the measurement of protein mass, the TG technique has many merits over SEC. For example, the TG method is more sensitive than SEC, because only the photoexcited species contribute to the signal, whereas all species (including unexcited ones) contribute to the SEC elution profile. In addition, the TG method is time-resolved, providing information on reaction intermediates and kinetics.
Photoreaction of AUREO1-ZL
The photoreaction of AUREO1-ZL was investigated next. A typical TG signal measured at a concentration of 250 μM and grating wavenumber of q2 = 3.8 × 10¹¹ m−2 is shown in Fig. 4 a. The essential features were quite similar to those observed for AUREO1-LOV. The signal decayed initially and then showed two rise-decay profiles before completely decaying to the baseline. The assignment of the initial phases is the same as that described in the previous section; i.e., the initial decay-rise-decay component is caused by adduct formation and the thermal grating signal. The subsequent rise-decay curve is from the protein diffusion signal, indicating that DP and DR differ. The signal intensity increased as the observation time window increased (Fig. 4 b). Using the criteria mentioned in the Reaction kinetics section above, we concluded that D changes within the time window of 150–160 ms. However, in contrast to AUREO1-LOV, in which a single-exponential decay profile was observed in the short time range, the TG signal of AUREO1-ZL showed a rise-decay profile over the same time range. This implies that there is a fast change in D, i.e., DI is different from DR. Analyzing the TG signals measured at various q2 using the method described above, we determined DR, DI, DP, and the reaction time constant to be 7.3, 6.9, 3.5 × 10⁻¹¹ m2/s, and 160 ms, respectively.
Figure 4.
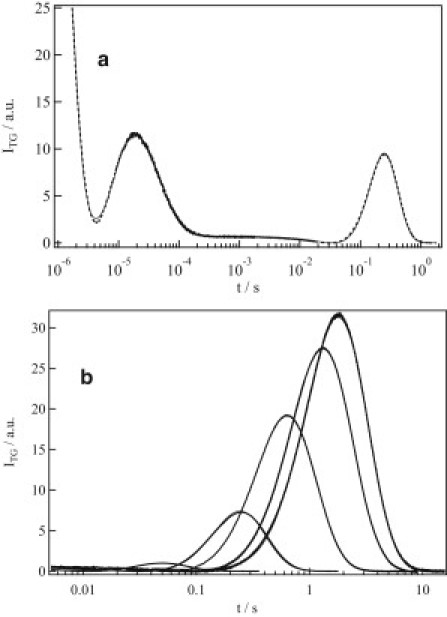
(a) A typical TG signal (dotted line) of AUREO1-ZL at a concentration of 250 μM at q2 = 7.2 × 10¹⁰ m−2. The line of best fit calculated based on a two-state model (Eqs. 1 and 3) is shown as a solid line. (b) Dependence of the diffusion signal of AUREO1-ZL (dotted line) on grating wavenumber (q) measured at, from left to right, 72, 12, 3.9, 1.7, and 1.2 × 10¹⁰ m−2. The solid line is the line of best fit, calculated based on a two-state model (Eqs. 1 and 3), which overlaps well with the observed signals.
It is interesting to note that the DR of AUREO1-ZL is much smaller than DR of AUREO1-LOV, and is even smaller than the dimer of AUREO1-LOV (DP). The molecular mass of AUREO1-ZL is 1.5 times greater than that of AUREO1-LOV. If the Stokes-Einstein relation holds, D is inversely proportional to the cubic root of the molecular mass. Hence, the DR of AUREO1-ZL cannot be explained only by the difference in molecular mass. On the other hand, this value is reasonable for the dimer of AUREO1-ZL. Hence, we consider that AUREO1-ZL exists as a dimer in the dark. This conclusion was confirmed by SEC measurements, as described below.
Although the time profile of the TG signal of AUREO1-ZL is similar to that of AUREO1-LOV, a significant difference was noted in the concentration dependence. In contrast to the significant dependence of the intensity and kinetics of AUREO1-LOV on concentration, the TG signal of AUREO1-ZL did not show any concentration dependence (data not shown). This feature indicates that the origin of the change in D is intramolecular, i.e., it is a conformational change.
This assignment was confirmed using SEC measurements. Fig. 3 b shows the elution profile of AUREO1-ZL, which consisted of a single peak. By plotting the peak positions on the calibration curve (Fig. 3 c), an apparent molecular mass of 65.1 kDa was determined, which is consistent with the molecular mass of the dimer of AUREO1-ZL (54.6 kDa). The elution profile under light irradiation was also measured. The position of the peak did not change, but the elution profile distorted slightly. This distortion probably reflects a conformational change in the protein.
To investigate changes in the secondary structure of the proteins, CD spectra of AUREO1-LOV and AUREO1-ZL were measure under dark and light conditions (Fig. 5). The CD spectra were almost identical, indicating that the change in the amount of the secondary structural is rather minor and therefore is not detected by CD. This indicates that measurement of D using the TG method is a very sensitive approach to detect conformational changes that are not identified by CD. This technique can detect a conformational change retaining the secondary structure.
Figure 5.
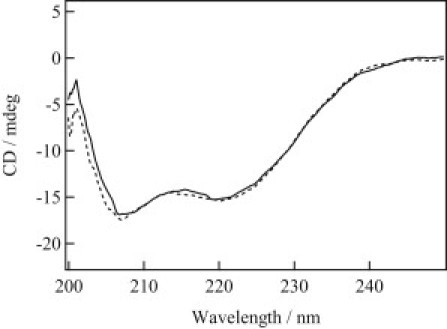
CD spectra of AUREO1-ZL in the dark (dotted line) and under light illumination (solid line).
Discussion
AUREO was identified as a transcription factor activated by blue light for controlling branch development in Vaucheria frigida. For this biological function, the protein consists of light-sensing (LOV) and functional (bZIP) domains. To understand the molecular mechanism of this function, it is essential to reveal the reaction mechanism of AUREO. As described in the above sections, the LOV domain of AUREO1 exists in equilibrium between the monomer and dimer forms, and the intermolecular interaction between the LOV domains increased upon irradiation with light. According to the change in D, the change in conformation accompanied by adduct formation is small, although the adduct formation certainly leads to some conformational change. The driving force for changing the interprotein interaction should be the minor conformational change or changes in protein dynamics (e.g., fluctuation), which should not change the time-averaged structure.
On the other hand, AUREO1-ZL exists predominantly as a dimer, indicating that the bZIP domain is the dimerization site. Indeed, bZIP domains are known as a protein dimerization domain found in many eukaryotic enhancer-type transcription factors (46–54). Because the photoreaction of the LOV domain does not change D, the observed conformational change that induces a change in D should be located in an area of the bZIP domain. The bZIP domain does not have a photosensitive chromophore, so the conformational change of the bZIP domain should be induced by photoreaction of the LOV domain. Considering the fact that LOV-LOV interaction increases upon photoexcitation, we speculate that changes in the relative location of the bZIP domain in the dimer form are induced by the relative locations of the LOV domains in the dimer form of AUREO1-ZL. A possible simplified picture of the reaction scheme is depicted in Fig. 6. (As described in the section Concentration dependence of the TG signal and assignment of diffusion change, only one monomer unit was excited in the dimer.) This scissor model proposes that the activity of the bZIP domain is controlled by the distance between the LOV domains. This model should be examined further, probably after determination of the structure of AUREO. For example, although we did not monitor the distance between the LOV domains in this study, it may be possible to detect the distance change by using the Förster resonance energy transfer method.
Figure 6.
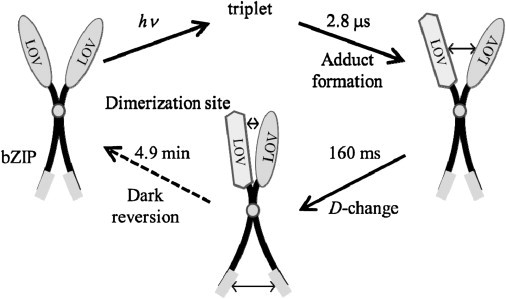
Schematic illustration of the photoreaction of AUREO1-ZL. By increasing the affinity of the LOV domains of the dimer unit upon blue light illumination, D changes with a time constant of 160 ms. This change may reflect the exposure of the hydrophilic region in the bZIP domain (gray rectangles).
The photoreaction of AUREO1-LOV was compared with that of a typical LOV domain of phototropins (phot1LOV2). It was reported in a previous study that phot1LOV2 exists in equilibrium between the monomer and dimer, and that the dimer (or monomer) exhibits the dissociation reaction (or dimerization reaction) upon irradiation with blue light (34). It was proposed in that article that this dissociation reaction is related to a conformational change of the linker region for the phot1LOV2-linker sample. In the case of the AUREO proteins, the dimerization reaction is dominant for the AUREO1-LOV domain.
Another interesting feature of the photoreaction of AUREO1 is the relatively large change in diffusion of the product compared with that of the reactant for AUREO1-ZL (DR/DP = 2.1). It is considered that this change reflects a change in the hydrogen-bonding network around the bZIP domain. This change must be related to the biological function; i.e., changing the AUREO1-DNA interaction upon illumination with light. It is known that the bZIP domain and DNA interact mainly through hydrogen bonding (55). Thus, this change could play a role in controlling the biological function. If the scissor model is correct, it is possible that the distance between the binding sites of bZIP domains directed by this conformational change in AUREO1 controls the interaction between AUREO1-ZL and DNA.
Conclusions
The photochemical reaction dynamics of the conformational changes and monomer/dimer equilibria of aureochrome were determined here for the first time that we know of. Both AUREO1-LOV and AUREO1-ZL exhibited reaction kinetics consistent with typical adduct formation of the LOV domains. After this reaction, a further reaction phase manifested itself as a change in diffusion in the millisecond time range. Concentration dependence experiments revealed that the main reactions of these proteins differ. AUREO1-LOV exists in a monomer-dimer equilibrium in the dark. Upon photoexcitation of the monomer, dimerization takes place, indicating that exposure to blue light controls the interprotein interaction. On the other hand, AUREO1-ZL exists as the dimer in the dark, and exhibits an intraprotein conformational change in the bZIP domain with a time constant of 160 ms. This conformational change is probably induced by blue-light-activated interprotein interactions. SEC measurements supported the results obtained from TG measurements. This is, to our knowledge, the first suggested model on the photoreaction mechanism of AUREO1.
Acknowledgments
This work was supported by a Grant-in-Aid for Scientific Research on Innovative Areas (Research in a proposed research area) (20107003) from the Ministry of Education, Culture, Sports, Science and Technology of Japan (to M.T.), and by a Grant-in-Aid for Scientific Research from the Ministry of Education, Culture, Sports, Science and Technology of Japan (to O.H.). T.T. acknowledges financial support from a research fellowship of the Global Charitable Organization Endowment program, Integrated Materials Science, Kyoto University, Japan.
Footnotes
Fumio Takahashi's present address is PRESTO, Japan Science and Technology Agency (JST), 4-1-8 Honcho Kawaguchi, Saitama 332-0012, Japan.
Hironao Kataoka's present address is Botanical Gardens, Tohoku University, 12-2 Kawauchi, Aoba-ku, Sendai 980-0862, Japan.
References
- 1.Zoltowski B.D., Vaccaro B., Crane B.R. Mechanism-based tuning of a LOV domain photoreceptor. Nat. Chem. Biol. 2009;5:827–834. doi: 10.1038/nchembio.210. [DOI] [PMC free article] [PubMed] [Google Scholar]
- 2.Crosson S., Rajagopal S., Moffat K. The LOV domain family: photoresponsive signaling modules coupled to diverse output domains. Biochemistry. 2003;42:2–10. doi: 10.1021/bi026978l. [DOI] [PubMed] [Google Scholar]
- 3.Wu Q., Gardner K.H. Structure and insight into blue light-induced changes in the BlrP1 BLUF domain. Biochemistry. 2009;48:2620–2629. doi: 10.1021/bi802237r. [DOI] [PubMed] [Google Scholar]
- 4.Matsumoto N., Hirano T., Yamamoto N. Functional analysis and intracellular localization of rice cryptochromes. Plant Physiol. 2003;133:1494–1503. doi: 10.1104/pp.103.025759. [DOI] [PMC free article] [PubMed] [Google Scholar]
- 5.Yang H.-Q., Tang R.-H., Cashmore A.R. The signaling mechanism of Arabidopsis CRY1 involves direct interaction with COP1. Plant Cell. 2001;13:2573–2587. doi: 10.1105/tpc.010367. [DOI] [PMC free article] [PubMed] [Google Scholar]
- 6.Li Q.-H., Yang H.-Q. Cryptochrome signaling in plants. Photochem. Photobiol. 2007;83:94–101. doi: 10.1562/2006-02-28-IR-826. [DOI] [PubMed] [Google Scholar]
- 7.Möglich A., Yang X., Moffat K. Structure and function of plant photoreceptors. Annu. Rev. Plant Biol. 2010;61:21–47. doi: 10.1146/annurev-arplant-042809-112259. [DOI] [PubMed] [Google Scholar]
- 8.Purcell E.B., McDonald C.A., Crosson S. An analysis of the solution structure and signaling mechanism of LovK, a sensor histidine kinase integrating light and redox signals. Biochemistry. 2010;49:6761–6770. doi: 10.1021/bi1006404. [DOI] [PMC free article] [PubMed] [Google Scholar]
- 9.Kyndt J.A., Fitch J.C., Cusanovich M.A. Regulation of the Ppr histidine kinase by light-induced interactions between its photoactive yellow protein and bacteriophytochrome domains. Biochemistry. 2010;49:1744–1754. doi: 10.1021/bi901591m. [DOI] [PubMed] [Google Scholar]
- 10.Barends T.R., Hartmann E., Schlichting I. Structure and mechanism of a bacterial light-regulated cyclic nucleotide phosphodiesterase. Nature. 2009;459:1015–1018. doi: 10.1038/nature07966. [DOI] [PubMed] [Google Scholar]
- 11.Ballario P., Talora C., Macino G. Roles in dimerization and blue light photoresponse of the PAS and LOV domains of Neurospora crassa white collar proteins. Mol. Microbiol. 1998;29:719–729. doi: 10.1046/j.1365-2958.1998.00955.x. [DOI] [PubMed] [Google Scholar]
- 12.Christie J.M., Salomon M., Briggs W.R. LOV (light, oxygen, or voltage) domains of the blue-light photoreceptor phototropin (nph1): binding sites for the chromophore flavin mononucleotide. Proc. Natl. Acad. Sci. USA. 1999;96:8779–8783. doi: 10.1073/pnas.96.15.8779. [DOI] [PMC free article] [PubMed] [Google Scholar]
- 13.Losi A., Quest B., Gärtner W. Listening to the blue: the time-resolved thermodynamics of the bacterial blue-light receptor YtvA and its isolated LOV domain. Photochem. Photobiol. Sci. 2003;2:759–766. doi: 10.1039/b301782f. [DOI] [PubMed] [Google Scholar]
- 14.Imaizumi T., Tran H.G., Kay S.A. FKF1 is essential for photoperiodic-specific light signalling in Arabidopsis. Nature. 2003;426:302–306. doi: 10.1038/nature02090. [DOI] [PubMed] [Google Scholar]
- 15.Nash A.I., Ko W.H., Gardner K.H. A conserved glutamine plays a central role in LOV domain signal transmission and its duration. Biochemistry. 2008;47:13842–13849. doi: 10.1021/bi801430e. [DOI] [PMC free article] [PubMed] [Google Scholar]
- 16.Ogura Y., Tokutomi S., Kiyosue T. PAS/LOV proteins: A proposed new class of plant blue light receptor. Plant Signal. Behav. 2008;3:966–968. doi: 10.4161/psb.6150. [DOI] [PMC free article] [PubMed] [Google Scholar]
- 17.Lamb J.S., Zoltowski B.D., Pollack L. Illuminating solution responses of a LOV domain protein with photocoupled small-angle x-ray scattering. J. Mol. Biol. 2009;393:909–919. doi: 10.1016/j.jmb.2009.08.045. [DOI] [PMC free article] [PubMed] [Google Scholar]
- 18.Crosson S., Moffat K. Structure of a flavin-binding plant photoreceptor domain: insights into light-mediated signal transduction. Proc. Natl. Acad. Sci. USA. 2001;98:2995–3000. doi: 10.1073/pnas.051520298. [DOI] [PMC free article] [PubMed] [Google Scholar]
- 19.Crosson S., Moffat K. Photoexcited structure of a plant photoreceptor domain reveals a light-driven molecular switch. Plant Cell. 2002;14:1067–1075. doi: 10.1105/tpc.010475. [DOI] [PMC free article] [PubMed] [Google Scholar]
- 20.Fedorov R., Schlichting I., Hegemann P. Crystal structures and molecular mechanism of a light-induced signaling switch: the Phot-LOV1 domain from Chlamydomonas reinhardtii. Biophys. J. 2003;84:2474–2482. doi: 10.1016/S0006-3495(03)75052-8. [DOI] [PMC free article] [PubMed] [Google Scholar]
- 21.Harper S.M., Neil L.C., Gardner K.H. Conformational changes in a photosensory LOV domain monitored by time-resolved NMR spectroscopy. J. Am. Chem. Soc. 2004;126:3390–3391. doi: 10.1021/ja038224f. [DOI] [PubMed] [Google Scholar]
- 22.Takahashi F., Yamagata D., Kataoka H. AUREOCHROME, a photoreceptor required for photomorphogenesis in stramenopiles. Proc. Natl. Acad. Sci. USA. 2007;104:19625–19630. doi: 10.1073/pnas.0707692104. [DOI] [PMC free article] [PubMed] [Google Scholar]
- 23.Swartz T.E., Corchnoy S.B., Bogomolni R.A. The photocycle of a flavin-binding domain of the blue light photoreceptor phototropin. J. Biol. Chem. 2001;276:36493–36500. doi: 10.1074/jbc.M103114200. [DOI] [PubMed] [Google Scholar]
- 24.Kottke T., Heberle J., Hegemann P. Phot-LOV1: photocycle of a blue-light receptor domain from the green alga Chlamydomonas reinhardtii. Biophys. J. 2003;84:1192–1201. doi: 10.1016/S0006-3495(03)74933-9. [DOI] [PMC free article] [PubMed] [Google Scholar]
- 25.Schüttrigkeit T.A., Kompa C.K., Michel-Beyerle M.E. Primary photophysics of the FMN binding LOV2 domain of the plant blue light receptor phototropin of Avena sativa. Chem. Phys. 2003;294:501–508. [Google Scholar]
- 26.Kennis J.T., Crosson S., van Grondelle R. Primary reactions of the LOV2 domain of phototropin, a plant blue-light photoreceptor. Biochemistry. 2003;42:3385–3392. doi: 10.1021/bi034022k. [DOI] [PubMed] [Google Scholar]
- 27.Schleicher E., Kowalczyk R.M., Weber S. On the reaction mechanism of adduct formation in LOV domains of the plant blue-light receptor phototropin. J. Am. Chem. Soc. 2004;126:11067–11076. doi: 10.1021/ja049553q. [DOI] [PubMed] [Google Scholar]
- 28.Nada T., Terazima M. A novel method for study of protein folding kinetics by monitoring diffusion coefficient in time domain. Biophys. J. 2003;85:1876–1881. doi: 10.1016/S0006-3495(03)74615-3. [DOI] [PMC free article] [PubMed] [Google Scholar]
- 29.Nishida S., Nada T., Terazima M. Kinetics of intermolecular interaction during protein folding of reduced cytochrome c. Biophys. J. 2004;87:2663–2675. doi: 10.1529/biophysj.104.042531. [DOI] [PMC free article] [PubMed] [Google Scholar]
- 30.Eitoku T., Nakasone Y., Terazima M. Conformational dynamics of phototropin 2 LOV2 domain with the linker upon photoexcitation. J. Am. Chem. Soc. 2005;127:13238–13244. doi: 10.1021/ja052523i. [DOI] [PubMed] [Google Scholar]
- 31.Goto T., Hisatomi O., Tokunaga F. Induced expression of hematopoietic- and neurologic-expressed sequence 1 in retinal pigment epithelial cells during newt retina regeneration. Exp. Eye Res. 2006;83:972–980. doi: 10.1016/j.exer.2006.05.004. [DOI] [PubMed] [Google Scholar]
- 32.Hasegawa A., Hisatomi O., Tokunaga F. Stathmin expression during newt retina regeneration. Exp. Eye Res. 2007;85:518–527. doi: 10.1016/j.exer.2007.07.003. [DOI] [PubMed] [Google Scholar]
- 33.Reference deleted in proof.
- 34.Nakasone Y., Eitoku T., Terazima M. Kinetic measurement of transient dimerization and dissociation reactions of Arabidopsis phototropin 1 LOV2 domain. Biophys. J. 2006;91:645–653. doi: 10.1529/biophysj.106.084772. [DOI] [PMC free article] [PubMed] [Google Scholar]
- 35.Zikihara K., Iwata T., Tokutomi S. Photoreaction cycle of the light, oxygen, and voltage domain in FKF1 determined by low-temperature absorption spectroscopy. Biochemistry. 2006;45:10828–10837. doi: 10.1021/bi0607857. [DOI] [PubMed] [Google Scholar]
- 36.Terazima M. Diffusion coefficients as a monitor of reaction kinetics of biological molecules. Phys. Chem. Chem. Phys. 2006;8:545–557. doi: 10.1039/b513509e. [DOI] [PubMed] [Google Scholar]
- 37.Terazima M., Okamoto K., Hirota N. Translational diffusion of transient radicals created by the photoinduced hydrogen abstraction reaction in solution: anomalous size dependence in the radical diffusion. J. Chem. Phys. 1995;102:2506–2516. [Google Scholar]
- 38.Terazima M. Is the translational diffusion of organic radicals different from that of closed-shell molecules? Acc. Chem. Res. 2000;33:687–694. doi: 10.1021/ar000003g. [DOI] [PubMed] [Google Scholar]
- 39.Tanaka K., Nakasone Y., Terazima M. Oligomeric-state-dependent conformational change of the BLUF protein TePixD (Tll0078) J. Mol. Biol. 2009;386:1290–1300. doi: 10.1016/j.jmb.2009.01.026. [DOI] [PubMed] [Google Scholar]
- 40.Nakasone Y., Ono T.A., Terazima M. Temperature-sensitive reaction of a photosensor protein YcgF: possibility of a role of temperature sensor. Biochemistry. 2010;49:2288–2296. doi: 10.1021/bi902121z. [DOI] [PubMed] [Google Scholar]
- 41.Hoshihara Y., Imamoto Y., Terazima M. Conformational changes in the N-terminal region of photoactive yellow protein: a time-resolved diffusion study. Biophys. J. 2008;94:2187–2193. doi: 10.1529/biophysj.107.115253. [DOI] [PMC free article] [PubMed] [Google Scholar]
- 42.Nakasone Y., Eitoku T., Terazima M. Stability of dimer and domain-domain interaction of Arabidopsis phototropin 1 LOV2. J. Mol. Biol. 2008;383:904–913. doi: 10.1016/j.jmb.2008.08.074. [DOI] [PubMed] [Google Scholar]
- 43.Nakasone Y., Ono T.A., Terazima M. Transient dimerization and conformational change of a BLUF protein: YcgF. J. Am. Chem. Soc. 2007;129:7028–7035. doi: 10.1021/ja065682q. [DOI] [PubMed] [Google Scholar]
- 44.Schröder M., von Lieres E., Hubbuch J. Direct quantification of intraparticle protein diffusion in chromatographic media. J. Phys. Chem. B. 2006;110:1429–1436. doi: 10.1021/jp0542726. [DOI] [PubMed] [Google Scholar]
- 45.Suzuki H., Iwasaki H. Studies on denitrification. V. Purification of denitrifying enzyme by means of electrophoresis. J. Biochem. 1962;52:190–192. doi: 10.1093/oxfordjournals.jbchem.a127595. [DOI] [PubMed] [Google Scholar]
- 46.Chang Y.-N., Dong D.L., Hayward S.D. The Epstein-Barr virus Zta transactivator: a member of the bZIP family with unique DNA-binding specificity and a dimerization domain that lacks the characteristic heptad leucine zipper motif. J. Virol. 1990;64:3358–3369. doi: 10.1128/jvi.64.7.3358-3369.1990. [DOI] [PMC free article] [PubMed] [Google Scholar]
- 47.Vinson C.R., Hai T., Boyd S.M. Dimerization specificity of the leucine zipper-containing bZIP motif on DNA binding: prediction and rational design. Genes Dev. 1993;7:1047–1058. doi: 10.1101/gad.7.6.1047. [DOI] [PubMed] [Google Scholar]
- 48.Blanco J.B., Vázquez O., Mascareñas J.L. High affinity, sequence specific DNA binding by synthetic tripyrrole-peptide conjugates. Chemistry. 2005;11:4171–4178. doi: 10.1002/chem.200500010. [DOI] [PubMed] [Google Scholar]
- 49.Nikolaev Y., Pervushin K. NMR spin state exchange spectroscopy reveals equilibrium of two distinct conformations of leucine zipper GCN4 in solution. J. Am. Chem. Soc. 2007;129:6461–6469. doi: 10.1021/ja0685295. [DOI] [PubMed] [Google Scholar]
- 50.Grigoryan G., Reinke A.W., Keating A.E. Design of protein-interaction specificity gives selective bZIP-binding peptides. Nature. 2009;458:859–864. doi: 10.1038/nature07885. [DOI] [PMC free article] [PubMed] [Google Scholar]
- 51.Azuma Y., Imanishi M., Futaki S. Cobalt(II)-responsive DNA binding of a GCN4-bZIP protein containing cysteine residues functionalized with iminodiacetic acid. Angew. Chem. Int. Ed. Engl. 2009;48:6853–6856. doi: 10.1002/anie.200902888. [DOI] [PubMed] [Google Scholar]
- 52.Etxebeste O., Herrero-García E., Espeso E.A. The bZIP-type transcription factor FlbB regulates distinct morphogenetic stages of colony formation in Aspergillus nidulans. Mol. Microbiol. 2009;73:775–789. doi: 10.1111/j.1365-2958.2009.06804.x. [DOI] [PubMed] [Google Scholar]
- 53.Gascoyne D.M., Long E., Brady H.J. The basic leucine zipper transcription factor E4BP4 is essential for natural killer cell development. Nat. Immunol. 2009;10:1118–1124. doi: 10.1038/ni.1787. [DOI] [PubMed] [Google Scholar]
- 54.Landschulz W.H., Johnson P.F., McKnight S.L. The leucine zipper: a hypothetical structure common to a new class of DNA binding proteins. Science. 1988;240:1759–1764. doi: 10.1126/science.3289117. [DOI] [PubMed] [Google Scholar]
- 55.Glover J.N., Harrison S.C. Crystal structure of the heterodimeric bZIP transcription factor c-Fos-c-Jun bound to DNA. Nature. 1995;373:257–261. doi: 10.1038/373257a0. [DOI] [PubMed] [Google Scholar]