

Abstract
Purpose
Age at menopause, a major marker in the reproductive life, may bias results for evaluation of breast cancer risk after menopause.
Methods
We follow 38,948 premenopausal women in 1980 and identify 2,586 who reported hysterectomy without bilateral oophorectomy, and 31,626 who reported natural menopause during 22 years of follow-up. We evaluate risk factors for natural menopause, impute age at natural menopause for women reporting hysterectomy without bilateral oophorectomy and estimate the hazard of reaching natural menopause in the next 2 years. We apply this imputed age at menopause to both increase sample size and to evaluate the relation between postmenopausal exposures and risk of breast cancer.
Results
Age, cigarette smoking, age at menarche, pregnancy history, body mass index, history of benign breast disease, and history of breast cancer were each significantly related to age at natural menopause; duration of oral contraceptive use and family history of breast cancer were not. The imputation increased sample size substantially and although some risk factors after menopause were weaker in the expanded model (height, and alcohol use), use of hormone therapy is less biased.
Conclusions
Imputing age at menopause increases sample size, broadens generalizability making it applicable to women with hysterectomy, and reduces bias.
Mesh headings: menopause, imputation, breast cancer
Introduction
Patterns of hormone therapy vary by presence or absence of a uterus and duration of use varies with age at menopause. Furthermore, as Pike described 1, and data have shown 2,3, appropriate control for age at menopause is necessary to accurately assess the relations of duration of use of postmenopausal hormones and breast cancer risk. Substantial bias towards the null, or underestimating the adverse effect is observed when age at menopause is misclassified 2. Hence variation in results for hormone use and risk of breast cancer may arise due to approaches commonly used to model age at menopause for women who have undergone hysterectomy prior to menopause.
Age at menopause has long been identified as a risk factor for breast cancer4, ovarian cancer 5, osteoporosis 6, and mortality 7. Hysterectomy is a major common surgical procedure with some 600,000 women discharged following this procedure each year from US hospitals 8. Major indications for hysterectomy in the US include uterine leiomyomas (30%), dysfunctional uterine bleeding (20%), genital prolapsed (15%), endometriosis and adenomyosis (20%), chronic pelvic pain (10%) and endometrial hyperplasia (6%)9. The proportion of hysterectomies accompanied by bilateral oophorectomy rises with age at surgery from approximately 33% at ages 25 to 29 to more than 70% at ages 45 to 54 8. For these women age at menopause equals age at hysterectomy, for those with ovaries not removed menopause occurs years later with the programmed senescence of the ovary and no clinical marker of menopause, i.e. cessation of menses. This surgical hysterectomy without bilateral oophorectomy leads to a prevalence of hysterectomy and / or missing age at menopause by age 50 that ranges up to more than 38% 10 in recent US based studies. In the UK Million Women Study, reflecting lower rates of hysterectomy in the UK, approximately 8.6% of women reported hysterectomy without bilateral oopohorecetomy when their mean age was 55.9 at baseline 11.
Missing age at menopause is addressed in a variety of ways in epidemiologic investigations. In the combined analysis of 50 studies completed before 1995, 11% of cases had hysterectomy before menopause and were eliminated from analysis 2. A recent French cohort excluded 14.3% of postmenopausal women because age at menopause was not accurate 12. Other epidemiologic studies allow women into analysis but stratify on type of surgery to account for missing age at menopause. Even others assume age at menopause is the age at hysterectomy 13. These approaches to analysis of epidemiologic data often ignore the fact that age at menopause is directly impacting estimation of the adverse effect of use, and duration of use, of postmenopausal hormone therapy and that misspecification leads to biased estimates 1. Furthermore, exclusion of women with hysterectomy reduces sample size limiting evaluation of other risk factors for postmenopausal breast cancer. In addition, application of models to predict risk of subsequent breast cancer either must exclude these women or provide biased estimates. One recent approach imputed age at menopause using baseline cohort data and assuming the distribution of age at menopause among women undergoing hysterectomy was the same as for women with natural menopause 14.
While numerous studies have identified factors that may relate to age at natural menopause, most have not had sufficiently large sample size to provide stable estimates, or did not control for confounding variables 15,16. Few have addressed these factors in combination including reproductive factors (menarche, nulliparity, oral contraceptive use, cigarette smoking, and socioeconomic status)17-20, though Gold and colleagues comprehensively address predictors in their national study of 14,620 women. They observed that current smoking, lower education attainment, being separated/widowed/divorced, non-employment and history of heart disease were independently associated with earlier natural menopause, while parity, prior oral contraceptive use, and Japanese ancestry were associated with later age at natural menopause 21. In Poland, similar results were observed for lifestyle factors including smoking, parity, and oral contraceptive use 22. Among African American women Palmer et al showed that smoking, parity, and body mass index had similar relations to natural menopause as reported for Caucasian populations 23. Cramer estimates age at menopause by combining multiple risk factors and provides a logistic regression formulation for dichotomized exposures including pack years of smoking; ovulatory cycles; depression; unilateral oophorectomy; and family history of early menopause 24. Simpson et al use an imputation approach with 9 years of follow-up in the Melbourne Collaborative Cohort Study 14. Neither of these models uses updated exposures over time to predict future age of natural menopause.
In this paper, we describe the methods we used to draw on the rich array of data from the Nurses’ Health Study to impute age at menopause conditional on age at hysterectomy for women who have had a hysterectomy and did not have both ovaries removed. We then evaluate the impact of this imputation on estimates for the effects of postmenopausal hormone therapy dividing time after surgery into two intervals, from surgery to imputed age at menopause – a period during which endogenous hormones may determine risk of breast cancer 25, and from imputed age at menopause through the postmenopausal years when the effect of exogenous hormones may be more directly related to risk 26. This provides the opportunity to include women with hysterectomy without bilateral oophorectomy in clinical applications of risk prediction models, increasing generalizability of models, and providing less biased estimates of future breast cancer risk.
Material and Methods
Participant Characteristics
The Nurses’ Health Study cohort was established in 1976, when 121,701 female, U.S. registered nurses between the ages of 30 and 55 years responded to a mailed questionnaire that inquired about risk factors for cancer and heart disease. The details of the establishment of this cohort have been previously reported 27,28. In 1976, women reported their age at first full-term pregnancy and the number of pregnancies lasting 6 months or more. In 1978, this information was updated and the women were asked to record the ages of their living children. Every 2 years, follow-up questionnaires have been mailed to the women to bring the information on risk factors up to date and to ascertain whether major medical events have occurred. Data on parity were updated through 1984, and in 1996 we asked women to report their age at each birth. This added information allowed for refinement of data when questionnaires had been missing during earlier follow-up. Deaths in the cohort are reported by family members or the postal service or identified by a search of the National Death Index. It is estimated that mortality ascertainment in this cohort of women is 98% complete 29,30.
Menopause is assessed on each follow-up questionnaire (http://www.channing.harvard.edu/nhs/questionnaires/index.shtml). A woman is asked,
“Have your periods ceased permanently”?
If yes, “Have you had either of your ovaries removed?”
If yes, “How many remain (none; one)”?
The short questionnaire administered to the last 5 percent of women in a follow-up cycle. Through the 1992 follow-up cycle this questionnaire only asked:
Have your periods ceased permanently (yes / no)?
All data are used prospectively with the classification at the beginning of a 2-year interval carrying through the whole of that interval to the next questionnaire.
Identification of Breast Cancer Cases
On each questionnaire, the participant is asked whether breast cancer had been diagnosed and, if so, the date of diagnosis. All women who report having breast cancer (or the next of kin for decedents) are contacted for permission to review their relevant medical records to confirm the diagnosis.
Population for Analysis
The approach included two stages. First we imputed age at menopause for women in the population with hysterectomy without bilateral oophorectomy. We then evaluated incidence of breast cancer among the total study population, including premenopausal women and women with either natural menopause or surgical menopause.
As depicted in Figure 1, we excluded from the analysis those who submitted duplicate responses at entry (n=123), those with an unknown date of diagnosis (n=7), and all women (n = 3,293) who reported breast or other cancer (excluding non-melanoma skin cancer) on the 1976 questionnaire. This left 118,278 women eligible for follow-up. A total of 12,643 women were missing parity in 1976, reported age at menarche less than 9 or greater than 21, were missing age at menopause on the baseline questionnaire, reported age at any birth greater than age at menopause, did not return any questionnaire after 1978, had an unknown age at first birth, or were missing duration of postmenopausal hormone therapy or unknown history of use. These women were excluded. This left a cohort of 105,635 women eligible for follow-up after exclusions 1 through 7. From this follow-up cohort, we further excluded women with missing height or unknown weight at age 18 years (n=18,237); 87,398 women remained. For analysis of breast cancer incidence, we further excluded women with type of menopause unknown who were postmenopausal at the first NHS questionnaire and those with type of postmenopausal hormone therapy unknown on all questionnaires. 86, 834 women remained for analysis and are included in models B and C in table 3.
Figure 1.
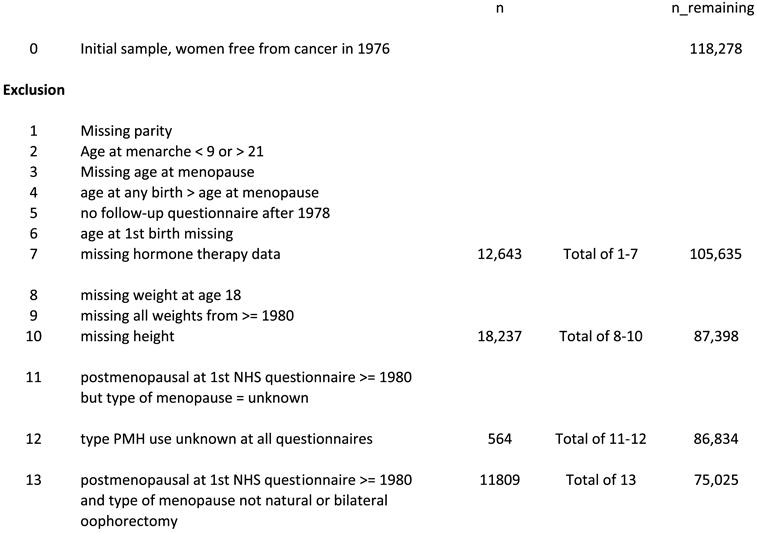
Flow of population with exclusions, Nurses’ Health Study
Note: number in exclusion 11 is not the same as in Table 3, since table 3 includes women who were premenopausal in 1980, but became postmenopausal at a later questionnaire, but with unknown type of menopause (n=6305).
TABLE 3.
Survival curve for natural menopause, natural + surgical menopause, and natural + imputed natural menopause
| Natural menopause
|
Natural menopause plus surgical menopause* |
Natural menopause plus imputed natural menopause† |
||||
|---|---|---|---|---|---|---|
| Age | Number of survivors | Survival probability | Number of survivors | Survival probability | Number of survivors | Survival probability |
| 30 | 53,249 | 1.0 | 53,249 | 1.0 | 53,249 | 1.0 |
| 35 | 53,186 | 1.0 | 53,183 | 0.999 | 53,189 | 1.0 |
| 40 | 52,959 | 0.997 | 51,735 | 0.982 | 52,285 | 0.993 |
| 45 | 47,138 | 0.966 | 46,633 | 0.915 | 48,008 | 0.942 |
| 50 | 29,130 | 0.713 | 28,857 | 0.625 | 29,873 | 0.651 |
| 55 | 4,203 | 0.181 | 4,011 | 0.138 | 4,476 | 0.147 |
| 60 | 163 | 0.028 | 161 | 0.019 | 161 | 0.015 |
| 65 | 15 | 0.014 | 15 | 0.009 | 15 | 0.007 |
| 70 | 0 | 0 | 0 | 0 | 0 | 0 |
| Censored | 21,623‡ | 14,301§ | 14,301§ | |||
| Postmenopausal | 31,626 | 38,948 | 38,948 | |||
Age at menopause = age at surgery.
Age at menopause for women with surgical menopause women other than bilateral oophrecomty = imputed age at natural menopause: age at menopause = reported age at menopause for women with natural menopause or bilateral oophorecetomy.
Censored includes 4656 bilateral oophorectomy; 630 unilateral oophorectomy; 1956 with hysterectomy; 56 with surgery and uncertain number of ovaries; 24 with radiation; 6305 women with unknown type of menopause; and 7996 women who were premenopausal as of 2002. Unknown menopause is caused by women answering a short follow-up questionnaire that does not obtain any details beyond “periods ceased (yes/no)?”
Censored includes 6305 women with unknown type of menopause and 7996 women who were premenopausal as of 2002.
Imputing age at menopause
2,586 women, who were premenopausal in 1980, reported hysterectomy or unilateral oophorectomy during follow-up. These women have been omitted from previous analyses using our log-incidence model due to missing age at menopause 31. In the majority of NHS analyses these women are added to follow-up time and considered postmenopausal based on the 90th percentile for age at natural menopause classified according to smoking status (54 for current smokers and 56 for non smokers). In such analyses age at menopause is defined as age at hysterectomy 13.
We developed a Cox Regression Model to identify risk factors associated with early or late natural menopause. We identified a study population of 53,249 women who were premenopausal in 1980 and had no missing covariate data (Table 1 presents data for 38,948 of these women who were premenopausal in 1980 and during 22 years had a natural menopause or hysterectomy) and case / non-case status. We then used a Cox regression model with hazard function defined by:
| (1) |
where X are the risk factors defined in 1980. This process was repeated for each 2-year interval, 1982-1984, …, 1998-2000, with risk factors updated every two years. At the beginning of each 2-year interval, women who had realized natural menopause in the previous 2-year interval were considered as “failures” and women who realized surgical or other types of menopause, or who died or developed cancer, were considered as censored. 31,626 women reported natural menopause during follow-up of whom 29,482 had no missing covariates. Covariates were updated in each 2-year interval. All 2-year intervals were considered in the same analysis. We used the AGGREGATE option of PROC PHREG of SAS to account for the correlation between outcomes for multiple 2-year time periods for the same woman32.
TABLE 1.
Distribution of covariates by type of menopause, Nurses’ Health Study, 1980 through 2002*
| Hysterectomy plus
|
Hysterectomy without
|
|||||
|---|---|---|---|---|---|---|
| Natural menopause
|
Bilateral oophorectomy
|
Bilateral oophorectomy
|
||||
| Variable | mean ± SD | n | mean ± SD | n | mean + SD | n |
| Age at menarche | 12.5 ± 1.4 | 31626 | 12.3 ± 1.4 | 4656 | 12.4 ± 1.4 | 2586 |
| Age at first birth† | 24.9 ± 3.2 | 30098 | 24.4 ± 2.8 | 4423 | 24.4 ± 2.8 | 2479 |
| Parity | 2.9 ± 1.5 | 31626 | 2.8 ± 1.4 | 4656 | 2.8 ± 1.3 | 2586 |
| Nulliparous, % | 4.8 | 31626 | 5.0 | 4656 | 4.1 | 2586 |
| Current BMI, kg/m2 | 25.5 ± 5.0 | 31593 | 25.6 ± 4.9 | 4646 | 24.8 ± 4.7 | 2582 |
| BMI at age 18 | 21.3 ± 2.9 | 28678 | 21.4 ± 3.0 | 4299 | 21.2 ± 2.9 | 2414 |
| Height, in | 64.5 ± 3.2 | 31626 | 64.5 ± 3.6 | 4656 | 64.6 ± 3.3 | 2586 |
| Alcohol, g/day | 6.2 ± 10.4 | 29997 | 5.8 ± 10.5 | 4438 | 5.7 ± 9.6 | 2470 |
| Age at menopause | 51.1 ± 3.2 | 31626 | 48.0 ± 4.3 | 4656 | 44.6 ± 4.8‡ | 2586 |
| Current smoking, % | 21.3 | 31558 | 16.9 | 4651 | 19.0 | 2583 |
| Past smoking, % | 34.6 | 31558 | 34.7 | 4651 | 30.9 | 2583 |
| Family Hx br ca, % | 8.7 | 31626 | 8.3 | 4656 | 5.9 | 2586 |
| Benign Br disease, % | 39.4 | 31626 | 41.6 | 4656 | 35.2 | 2586 |
| Median IQR | Median IQR | Median IQR | ||||
| Pack-years, (among ever smokers) | 16 (6–30) | 15391 | 11 (4–24) | 2049 | 11 (4–22) | 1142 |
| Ever OC use, % | 56.4 | 31586 | 65.0 | 4652 | 68.6 | 2585 |
| Duration OC use (months, among ever users) | 37 (13–80) | 17816 | 33 (12–71) | 3023 | 32 (12–68) | 1774 |
BMI = body mass index; IQR = interquartile range; OC = oral contraceptives.
38,868 women were premenopausal in 1980 and become postmenopausal during follow-up to 2002. Exposure variable values are on the basis of the survey administered just before the women became postmenopausal.
Among parous women.
For women with hysterectomy without bilateral oophorectomy this represents age at surgery.
We then estimated the hazard of reaching natural menopause in the next 2 years for a woman with 0 values (referent values for age 45-9; never smoker; parous; parity 3; age at first birth 24; age at menarche 12; no OC use; no benign breast disease; no family history; and no history of incident breast cancer, and zero for continuous covariates) for all covariates from the equation
| (2) |
Upon combining equation 1 and 2, we then estimated the hazard function for each 2 year interval for each woman and thus estimated the survival curve for each woman based on the Kaplan-Meier product limit method given by
| (3) |
where ts = age at surgery.
For each woman with surgical menopause at age ts we then estimated the probability of natural menopause from age t to t+2 by.
| (4) |
We than generated random uniform (U (0,1)) deviates using the RANUNI function of SAS to impute the age at natural menopause for each woman with surgical menopause. Specifically, if Ui(0), …, Ui(l) are a set of U (0,1) random deviates, then if Ui (0)<Pi(0) then the imputed age at natural menopause (tm) was set to ts +2; else if Ui (1)< Pi(1) then tm was set to age ts +4, …, etc. If a woman did not reach an imputed age at natural menopause by age 60, then tm was set to 60. Thus, each woman with surgical menopause at age t was assigned an imputed age at natural menopause (tm) by this process where t<tm ≤60. During the imputation process, the covariate values were updated up to the year of the last survey, after which they were carried forward at subsequent years. As an example, we estimate the survival curve for a typical woman to impute her age at menopause (See Appendix).
Breast cancer incidence
After all traditional exclusions, including missing age at menopause, a total of 75,025 women were followed for 1,257,005 person-years from 1980 to 2002 during which time 3669 cases of incident breast cancer occurred. After imputing age at menopause we included 86,834 women followed for 1,503,182 person years who reported 4,386 cases of invasive breast cancer. Analysis began in 1980 because this is the year when weight at age 18 years and alcohol intake were first reported. For the total cohort before exclusions, the observed incidence of breast cancer is comparable to the expected incidence based on the SEER rates 33 for white women, 1988-1992 (O/E = 1.0; 95%CI 0.98-1.03).
Description of the Log - Incidence Model of Breast Cancer
We fit the log-incidence model of breast cancer 34,35 to incident cases of invasive breast cancer that were identified during follow-up of the Nurses’ Health Study cohort from 1980 to 2002. The approach to model fitting was to assume that incidence at time t(It) is proportional to the number of cell divisions (Ct) accumulated throughout life up to age t, that is, I t = kCt. The cumulative number of breast cell divisions is calculated as follows:
Thus, λi = Ci+1/Ci represents the rate of increase in the number of breast cell divisions from age i to age i+1. Log (λi) is assumed to be a linear function of risk factors that are relevant at age i. The set of relevant risk factors and their magnitude may vary according to the stage of reproductive life. The details for the representation of Ci are given in Colditz and Rosner 35. The overall model is given by
where t =age; to = age at menarche; tm = age at menopause; t*= minimum (age, age at menopause); mt=1 (if postmenopausal at age t, 0 otherwise); st =parity at age t; ti =age at ith birth, i= 1,. ., st; ; bit = 1 if parity ≥ i at age t, 0 otherwise; mA =1 (if natural menopause, 0 otherwise); bbd=1 (if benign breast disease=yes, 0 otherwise); fhx = 1 (if family history of breast cancer in mother or sister = yes, 0 otherwise); pmhA = number of years on oral estrogen; pmhB = number of years on oral estrogen and progesterone; pmhC = number of years on other types of postmenopausal hormones; pmhcur,t =1 (if current user of postmenopausal hormones at age t, 0 otherwise); pmh past,t =1 (if past user of postmenopausal hormones at age t, 0 otherwise); BMIj = BMI at age j (kg/m2); alcj=alcohol use (grams) at age j; h=height (inches).
In these analyses, we treated age at menopause in 3 different ways. In model A, we censored women once they reported a surgical menopause other than bilateral oophorectomy. In model B, we included women with both surgical and natural menopause but assumed that the age at surgery = age at menopause. In model C, we included women with surgical menopause other than bilateral oophorectomy but assumed their age at menopause = age at imputed natural menopause. Furthermore, in Model C, for women with surgical menopause other than bilateral oophorectomy, person-time was divided into 2 segments; pre-menopausal person-time from age at menarche to age at surgery; and postmenopausal person-time after age at imputed natural menopause. For women with natural menopause or bilateral oophorectomy, person-time was divided into pre and postmenopausal person-time. For model C we take the average of 10 imputations per woman. For model C, we estimated age at menopause for women with hysterectomy and combined data from premenopausal women and women with natural menopause, bilateral oophorectomy and hysterectomy with one or no ovaries removed, and ran our breast cancer incidence model on the combined data set. This process was repeated 10 times, yielding 10 separate estimates of relative risk and se for each breast cancer risk factor. We then used standard methods of multiple imputation to obtain overall estimates and standard errors for each risk factor based on the 10 completed data sets.
Finally, to evaluate the hormonal status of women prior to menopause we compare the luteal phase estradiol and estrone levels of participants in the Nurses Health Study II cohort who were premenopausal and free from cancer at the time of blood draw and subsequently reported hysterectomy without bilateral oophorectomy or natural menopause during follow-up 25. Analyses controlled for age, laboratory batch and luteal day.
This study was approved by the Institutional Review Board at Partners Health Care, Boston, MA.
Results
In Table 1 we list the distribution of risk factors for natural menopause, hysterectomy plus bilateral oophorectomy, and hysterectomy without bilateral oophorectomy. We note that women reporting hysterectomy plus bilateral oophorectomy have a higher prevalence of nulliparity and women reporting hysterectomy a lower prevalence. Age at menopause, interpreted as date of surgery for surgical menopause, varies substantially according to type of menopause decreasing from 51.1 for natural menopause to 48.0 for hysterectomy plus bilateral oophorectomy, and 44.6 for average age at hysterectomy plus unilateral oophorectomy. Women with natural menopause are more likely to be current smokers and to have smoked a greater number of pack-years. Prevalence of benign breast disease varied somewhat by type of menopause, and was highest among women with bilateral oophorectomy. Duration of OC use was longest among women reporting hysterectomy without bilateral oophorectomy.
We next evaluated time to natural menopause among women who were premenopausal in 1980. 29,482 reached natural menopause during follow-up from 1980 to 2002 (we censored women when they reported other types of menopause) (table 2). The hazard ratio for natural menopause increases with age, as expected. As previously reported in this cohort 36, current smokers have earlier natural menopause and accordingly increased hazard for natural menopause (Hazard Ratio 1.33; 95% CI 1.30 - 1.37). Later age at menarche was associated with a later age at natural menopause and nulliparous women were at increased risk of natural menopause (Hazard Ratio 1.20; 95%CI 1.14 - 1.25). Parity was also related to decreased risk of menopause, but later age at first birth was not related to risk of earlier menopause. Longer duration of OC use was not related to risk, higher body mass index reduced the risk of natural menopause while benign breast disease was related to earlier menopause and family history of breast cancer was not related to risk of natural menopause. Diagnosis of breast cancer in a 2-year cycle was associated with a substantially lower hazard of becoming menopausal.
TABLE 2.
Association between breast cancer risk factors and time to natural menopause, based on Nurses’ Health Study Data from 1980 through 2002*
| Variable | Regression coefficient | Standard error | p-value | Hazard ratio | 95% CI |
|---|---|---|---|---|---|
| Age | |||||
| 30–34 | −5.311 | 0.301 | <.001 | 0.01 | (0.00–0.01) |
| 35–39 | −3.699 | 0.069 | <.001 | 0.03 | (0.02–0.03) |
| 40–44 | −1.847 | 0.024 | <.001 | 0.16 | (0.13–0.18) |
| 45–49 | (ref) | 1.0 | |||
| 50–54 | 1.137 | 0.011 | <.001 | 3.12 | (3.05–3.18) |
| 55+ | 1.582 | 0.028 | <.001 | 4.87 | (4.61–5.14) |
| Smoking | |||||
| Never | (ref) | 1.0 | |||
| Current | 0.287 | 0.014 | <.001 | 1.33 | (1.30–1.37) |
| Ex | 0.046 | 0.011 | <.001 | 1.05 | (1.02–1.07) |
| Pregnancy history† | |||||
| Age at menarche −12 | −0.021 | 0.004 | <.001 | 0.92‡ | (0.89–0.95) |
| Nulliparous | 0.180 | 0.024 | <.001 | 1.20 | (1.14–1.25) |
| Parity −3 | −0.010 | 0.004 | .012 | 0.99 | (0.98–1.00) |
| Age at 1st birth −24 | 0.003 | 0.002 | .11 | 1.03§ | (0.99–1.06) |
| Other risk factors | |||||
| Duration of OC use, months | −0.0001 | 0.0001 | .31 | 0.99¶ | (0.98–1.01) |
| Body mass index, kg/m2 | −0.007 | 0.0001 | <.001 | 0.93∥ | (0.91–0.95) |
| Benign breast disease | 0.035 | 0.011 | .001 | 1.04 | (1.00–1.07) |
| Family history of breast cancer | 0.016 | 0.018 | .36 | 1.02 | (0.98–1.05) |
| Incident breast cancer | |||||
| Yes | −0.457 | 0.089 | <.001 | 0.63 | (0.53–0.75) |
CI = confidence interval; OC = oral contraceptive.
Based on 308,065 person–years during which 29,482 women with covariates reported natural menopause. Women were censored if they were premenopausal at the end of follow-up or had other types of menopause.
Age at menarche-12 is age at menarche centered using the mean. Parity and age at first birth are also mean centered.
Four-year difference in age at menarche.
10-year difference in age at first birth.
Per 5 years of use.
Per 10 kg/m2.
We then imputed age at menopause for the 2662 women with surgical menopause without bilateral oophorectomy and no missing covariates (Table 2). The average age at hysterectomy was 44.8 ± 4.9 years, and the average imputed age at menopause was 51.7 ± 3.7 years, close to the age at natural menopause for women in Table 1. We next present the survival probability for 5-year age groups from 30 to 70 (Table 3). Compared to women reporting natural menopause we observed that the curve is shifted to the left if natural menopause and surgical menopause are combined (using age at surgery as the age at menopause) (see Figure 2). On the other hand, after imputing age at natural menopause for women with hysterectomy without bilateral oophorectomy, the probabilities are comparable to those for natural menopause alone. For example, the probability of remaining premenopausal for a 45 year old woman is 96.6% for natural menopause alone; 91.5% for natural plus surgical menopause; and 94.2% after imputing natural menopause (the later probability also includes women with bilateral oophorectomy).
Figure 2.
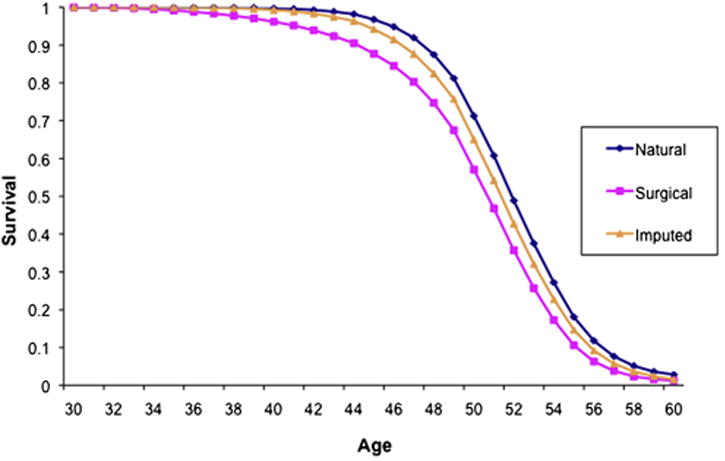
Probability of remaining premenopausal according to age, by type of menopause, among participants in the Nurses’ Health Study.
We next fit the log incidence model for breast cancer and report the different parameter estimates after defining age at menopause in different ways (Table 4). Model A includes natural menopause and bilateral oophorectomy only, and thus represents an unbiased estimate of the effect of hormone therapy after menopause. It includes 3,669 cases diagnosed during 1.257M person-years. In Model B we include 4386 cases during 1.503M person years and set age at menopause to the age at hysterectomy. In Model C we include 4386 cases during 1.503M person years and age at menopause is set as the imputed age at menopause with follow-up time set to missing from surgery to imputed age at menopause. First, for duration of premenopause, we observe that the increase in risk per year is relatively constant across the 3 models.
TABLE 4.
Effect of different approaches to defining age at menopause on fitted breast cancer incidence model, Nurses’ Health Study, 1980–2002
| Model A* |
Model B† |
Model C‡ |
|||||||
|---|---|---|---|---|---|---|---|---|---|
| Variable | Beta | SE | p-value | Beta | SE | p-value | Beta | SE | p-value |
| Intercept | −9.205 | 0.191 | −9.021 | 0.164 | −9.051 | 0.259 | |||
| Duration of premenopause, yrs | 0.081 | 0.005 | <.001 | 0.076 | 0.005 | <.001 | 0.077 | 0.007 | <.001 |
| Menopause, duration | |||||||||
| Natural | 0.028 | 0.004 | <.001 | 0.029 | 0.003 | <.001 | 0.029 | 0.005 | <.001 |
| Bilateral oophorectomy | 0.019 | 0.005 | <.001 | 0.023 | 0.004 | <.001 | 0.023 | 0.007 | <.001 |
| Unilateral oophorectomy | – | – | – | 0.036 | 0.005 | <.001 | 0.037 | 0.006 | <.001 |
| Hysterectomy | – | – | – | 0.038 | 0.004 | <.001 | 0.038 | 0.005 | <.001 |
| Other types of menopause | – | – | – | 0.045 | 0.008 | <.001 | 0.045 | 0.010 | <.001 |
| Pregnancy history | |||||||||
| Age at 1st birth - age at menarche | 0.0062 | 0.0034 | .068 | 0.0066 | 0.0032 | .038 | 0.0066 | 0.0035 | .063 |
| Birth index | −0.0037 | 0.0005 | <.001 | −0.0038 | 0.0005 | <.001 | −0.0038 | 0.0005 | <.001 |
| BBD | |||||||||
| BBD (yes vs no) | 0.214 | 0.373 | .57 | 0.351 | 0.310 | .26 | 0.282 | 0.430 | .51 |
| BBD x age at menarche | 0.049 | 0.018 | .005 | 0.043 | 0.016 | .006 | 0.045 | 0.019 | .018 |
| BBD x duration of premenopause | −0.009 | 0.007 | .22 | −0.010 | 0.006 | .064 | −0.009 | 0.007 | .19 |
| BBD x duration of menopause | −0.013 | 0.004 | <.001 | −0.013 | 0.003 | <.001 | −0.012 | 0.004 | .005 |
| Postmenopause hormone (PMH) | |||||||||
| Duration of oral estrogen use alone, yrs during postmenopause | 0.033 | 0.006 | <.001 | 0.022 | 0.005 | <.001 | 0.022 | 0.005 | <.001 |
| Duration of oral estrogen and progesterone, yrs during postmenopause | 0.065 | 0.008 | <.001 | 0.065 | 0.008 | <.001 | 0.066 | 0.010 | <.001 |
| Duration of use of other types of postmenopausal hormones | |||||||||
| During postmenopause | 0.030 | 0.008 | <.001 | 0.017 | 0.007 | .011 | 0.018 | 0.007 | .019 |
| Current PMH use | 0.045 | 0.053 | .39 | 0.053 | 0.047 | .26 | 0.050 | 0.081 | .58 |
| Past PMH use | −0.164 | 0.053 | .002 | −0.162 | 0.048 | <.001 | −0.167 | 0.065 | .001 |
| BMI | |||||||||
| (Average BMI during premenopause-21.8) × duration of premenopause§ | −0.0011 | 0.0002 | <.001 | −0.0010 | 0.0002 | <.001 | −0.0010 | 0.0002 | <.001 |
| (Average BMI during postmenopause-24.4) × duration of postmenopause | 0.0034 | 0.0004 | <.001 | 0.0025 | 0.0004 | <.001 | 0.0025 | 0.0004 | <.001 |
| Height | |||||||||
| (Height - 64.5) x duration of premenopause§ | 0.00076 | 0.00022 | <.001 | 0.00057 | 0.00020 | .004 | 0.00058 | 0.00022 | .009 |
| (Height - 64.4) x duration of postmenopause | −0.00070 | 0.00095 | .46 | 0.00045 | 0.00076 | .56 | 0.00039 | 0.00084 | .64 |
| Alcohol | |||||||||
| Cumulative grams premenopause | 0.00032 | 0.00006 | <.001 | 0.00026 | 0.00006 | <.001 | 0.00026 | 0.00006 | <.001 |
| Cumulative grams postmenopause | |||||||||
| While on PMH | −0.00068 | 0.00029 | .020 | −0.00038 | 0.00024 | 0.11 | −0.00038 | 0.00026 | .14 |
| While not on PMH | −0.00013 | 0.00023 | .56 | 0.00011 | 0.00018 | 0.54 | 0.00009 | 0.0002 | .63 |
| Family history of breast cancer (yes vs no) | 0.41 | 0.04 | <.001 | 0.42 | 0.04 | <0.001 | 0.42 | 0.04 | <.001 |
| Number of women | 75,025 | 86,834 | 86,834 | ||||||
| Number of cases | 3,669 | 4,386 | 4,386 | ||||||
| Number of person-years | 1,257,005 | 1,503,182 | 1,503,156 | ||||||
BBD = benign breast disease; BMI = body mass index.
Model results updated for C: brcnmodel.alcbmi.clustered2a.saslog Dec 1, 2009.
Model A includes person-time before menopause or after natural menopause or bilateral oophorectomy; women are censored after surgical menopause or menopause of unknown type.
Model B includes person-time both before and after menopause; for surgical menopause, age at menopause is set to age at surgery.
Model C includes person-time both before and after menopause; for women with surgical menopause, age at menopause is set to imputed age at natural menopause, where imputed age at natural menopause is forced to be greater than age at surgery. Average of 10 imputations.
Include time postmenopausal when on postmenopausal hormones.
Let us consider a woman with age at surgery = 45 and imputed age at menopause = 50 and use of estrogen for 10 years from age 45 to 55. This woman would be excluded from analysis after age 45 in Model A. Including women with surgical menopause and treating age at menopause as age at surgery (model B) increases the number of cases to 4,386 during 1.503M person-years. The relative risk for 10 years of use of unopposed estrogen is exp(0.066+10×0.024) = 1.36 and the increase in risk per year is 2.4% per year of use. On the other hand, in Model C with the same population, this woman is not included in analysis from surgery to imputed age at menopause (50), but accrues only 5 years of postmenopausal person-time from imputed age at menopause to current age. Thus, the relative risk = exp[0.050 +5×(0.022)] = 1.17. After the imputed age at menopause, risk increases at 2.2% per year. When only person-time after imputed age at menopause is included in Model C the association for estrogen plus progestin therapy is comparable to the unbiased estimate in Model A, but 717 additional cases are included in the population for analysis.
In the expanded population (Models B and C) we adjust for type of menopause adding terms for unilateral oophorectomy, hysterectomy without oophorectomy, and other type of menopause, and observed that the rate of increase in risk per year after menopause is somewhat lower for body mass index (0.0025 vs. 0.0034). A reduction was observed for height after menopause. We also note that after adding women who have had a hysterectomy, the strength of association for each year of use of alcohol after menopause was reduced.
We also address hormone levels in premenopausal women prior to menopause to determine if those who undergo hysterectomy are different from those who proceed to natural menopause. We evaluated luteal phase estradiol and estrone levels collected while the women were premenopausal. The ICC over a 2 to 3 year period for luteal phase estrone was 0.44 and for estradiol it was 0.45 37. We observed no significant difference in either hormone level approximately 5 to 6 years before surgery or natural menopause. See Table 5.
TABLE 5.
Geometric mean* hormone levels measured in luteal phase and subsequent type of menopause, Nurses’ Health Study II
| Simple hysterectomy
|
Natural menopause
|
||||
|---|---|---|---|---|---|
| Number | Mean (95% CI) | Number | Mean (95% CI) | p value | |
| Estrone | 36 | 81.9 (70.7–94.9) | 346 | 81.2 (77.7–85.0) | .92 |
| Estradiol | 34 | 111.5 (92.1–135.1) | 322 | 116.8 (110.1–123.8) | .66 |
CI = confidence interval; ICC = intraclass correlation coefficient.
ICC for luteal phase blood measures 0.44 for E1 and 0.45 for E2.
Adjusted for age, laboratory batch, and luteal day
Discussion
We report a model to impute expected age at natural menopause conditional on age at hysterectomy without bilateral oophorectomy. Given the prevalence of hysterectomy without bilateral oophorectomy in the US population, and widespread exclusion of these women from epidemiologic evaluations of postmenopausal breast cancer risk factors, this imputation offers the potential to include age at menopause in analysis of contemporary studies. Women can accurately report whether or not they have had both ovaries removed at surgery38, enabling multiple potential applications. This imputed age at menopause allowed us to evaluate use of postmenopausal hormones and showed that unopposed estrogen may be misspecified in some settings, but combination estrogen plus progestin has comparable magnitude across models reflecting use by women with natural menopause and limited impact of how women with hysterectomy are handled in analysis. The expanded model includes substantially more cases, generates lower standard errors for some postmenopausal risk estimates, and will enable applications such as use of risk prediction models to counsel women regarding breast cancer prevention strategies tailored to their level of risk. The expanded population for analysis will also be valuable in such settings as histological subsets of breast cancer or disease classified according to receptor status, where power is reduced compared to the study of total incidence.
Strength of the imputation is the array of reproductive and other variables we could evaluate as predictors of age at menopause. While we do not have measures of depression that were included by Cramer, the findings are nevertheless consistent with his work 24. The Melbourne cohort had 17% of women missing age at menopause 14. They imputed age at menopause and recommend this approach to evaluate relations for postmenopausal hormone therapy. While other approaches to classification of menopausal status may be applied in clinical settings or with more comprehensive exposure assessment 39, evidence from the majority of epidemiologic studies evaluating hormone therapy shows that stratification, exclusion, or other methods for modeling missing age at menopause have been the standard approach 2,10,12,40.
One concern with respect to imputing future age at menopause is that the hormonal milieu of women undergoing surgery is different from that of women proceeding to natural menopause. Nurses’ Health Study II data reported in this paper support no major differences for luteal estradiol and estrone levels approximately 5 years before natural menopause (or surgery). Although not definitive, these are consistent with cross-sectional data reported for Australian women ages 40 to 69 years. 152 women with hysterectomy were compared with 1423 women with an intact uterus who had never used hormone therapy. Women under 55 years of age with hysterectomy had slightly higher estradiol levels than those with an intact uterus 41.
We also note that we observed an association between history of benign breast disease and type of menopause, and that women with benign breast disease had an earlier age at natural menopause. To the best of our knowledge this association has not been reported previously, though many studies have evaluated a range of reproductive and socio-cultural predictors.
A limitation includes the lack of ethnic diversity and the potential for risk factors to vary with race and ethnicity. Henderson et al 42 have shown that Latina have an earlier age at natural menopause and like Gold et al 21 that Japanese Americans a later age at natural menopause, while smoking, age at menarche, parity and body mass index are not related to risk. However, we note that the majority of breast cancer risk factors carry common effects for cancer risk regardless of ethnicity in the Multiethnic Cohort, the same cohort that showed variation in age at menopause according to race/ethnicity 43.
In conclusion, the ability to impute age at natural menopause for women reporting hysterectomy without bilateral oophorectomy allows for inclusion of substantially more women into analyses relating hormone therapy to risk of breast cancer without inducing bias in the risk estimates. Furthermore, as models become available for risk prediction for women regardless of type of menopause and extent of surgery, they will be more clinically useful if all women can be included. Likewise, the expanded population available for evaluation of risk factors after menopause will be valuable as studies evaluate subtypes of breast cancer.
Appendix Calculation of Imputed Age at Natural Menopause for a Particular Woman
We consider a woman with surgical menopause at age 40. First, the baseline hazard h0(t) was estimated by 29,482/180594 = 0.16325. This represents the probability of reaching natural menopause over 2 years in our dataset for a 45-49 year-old woman who never smoked, had age at menarche = 12 years, age at 1st birth = 24 years, parity =3 and 0 values for all other covariates. Second, the woman had the following covariate values:
| 1. age | 40 | 42 | 44 | 46 | 48 | 50 | 52 | 54 |
| 2. smoking | cur | past | past | past | past | past | past | past |
| 3. age at menarche | 10 | 10 | 10 | 10 | 10 | 10 | 10 | 10 |
| 4. nulliparous | no | no | no | no | no | no | no | no |
| 5. parity | 3 | 3 | 3 | 3 | 3 | 3 | 3 | 3 |
| 6. age at 1st birth | 24 | 24 | 24 | 24 | 24 | 24 | 24 | 24 |
| 7. dur OC use (mth) | 23 | 23 | 23 | 23 | 23 | 23 | 23 | 23 |
| 8. BMI | 29.8 | 29.8 | 31.3 | 29.8 | 31.3 | 31.3 | 29.8 | 29.8 |
| 9. BBD | yes | yes | yes | yes | yes | yes | yes | yes |
| 10. Fam Hx Br ca | no | no | no | no | no | no | no | no |
| Exp(Σ βj Xij) | 0.183 | 0.144 | 0.142 | 0.914 | 0.904 | 2.817 | 2.848 | 2.848 |
| hi(t) | 0.030 | 0.024 | 0.023 | 0.149 | 0.148 | 0.460 | 0.465 | 0.465 |
| x(t) | 0.605 | 0.499 | 0.736 | 0.488 | 0.168 | 0.799 | 0.686 | 0.343 |
| Natural menop. | no | no | no | no | no | no | no | yes |
For this woman with surgical menopause at age 40, there was a probability of 0.030 of becoming menopausal by age 42. However, since the random uniform deviate for this woman at age 40 (x(t) = 0.605) was greater than hi(t) (0.030), the woman was considered to remain premenopausal until age 42. The process was repeated at age 42,44,…,52 with the same result. However, at age 54, since x(t) < hi(t), the imputed age at natural menopause for this woman was set at 54.
Literature cited
- 1.Pike M, Ross R, Spicer D. Problems involved in including women with simple hysterectomy in epidemiologic studies measuring the effects of hormone replacement therapy on breast cancer risk. Am J Epidemiol. 1998;147:718–721. doi: 10.1093/oxfordjournals.aje.a009515. [DOI] [PubMed] [Google Scholar]
- 2.Collaborative group on hormonal factors in breast cancer. Breast cancer and hormone replacement therapy. Combined reanalysis of data from 51 epidemiological studies involving 52,705 women with breast cancer and 108,411 women without breast cancer. Lancet. 1997;350:1047–1059. [PubMed] [Google Scholar]
- 3.Rockhill B, Colditz GA, Rosner B. Bias in breast cancer analyses due to error in age at menopause. Am J Epidemiol. 2000;151(4):404–408. doi: 10.1093/oxfordjournals.aje.a010220. [DOI] [PubMed] [Google Scholar]
- 4.Lilienfeld AM. The relationship of cancer of the female breast to artificial menopause and marital status. Cancer. 1956;9:927–934. doi: 10.1002/1097-0142(195609/10)9:5<927::aid-cncr2820090510>3.0.co;2-3. [DOI] [PubMed] [Google Scholar]
- 5.Rosner B, Colditz G, Webb P, Hankinson S. Mathematical models of Ovarian Cancer incidence in the Nurses’ Health Study. Epidemiology. 2004;16:508–515. doi: 10.1097/01.ede.0000164557.81694.63. [DOI] [PubMed] [Google Scholar]
- 6.Kritz-Silverstein D, Barrett-Connor E. Early menopause, number of reproductive years, and bone mineral density in postmenopausal women. Am J Public Health. 1993 Jul;83(7):983–988. doi: 10.2105/ajph.83.7.983. [DOI] [PMC free article] [PubMed] [Google Scholar]
- 7.Cooper GS, Sandler DP. Age at natural menopause and mortality. Ann Epidemiol. 1998 May;8(4):229–235. doi: 10.1016/s1047-2797(97)00207-x. [DOI] [PubMed] [Google Scholar]
- 8.Keshavarz H, Hillis S, Kieke B, Marchbanks P. Hysterectomy Surveillance - United States, 1994-1999. MMWR. 2002;51:1–8. [PubMed] [Google Scholar]
- 9.Carlson KJ, Nichols DH, Schiff I. Indications for hysterectomy. N Engl J Med. 1993 Mar 25;328(12):856–860. doi: 10.1056/NEJM199303253281207. [DOI] [PubMed] [Google Scholar]
- 10.Daling JR, Malone KE, Doody DR, et al. Relation of regimens of combined hormone replacement therapy to lobular, ductal, and other histologic types of breast carcinoma. Cancer. 2002 Dec 15;95(12):2455–2464. doi: 10.1002/cncr.10984. [DOI] [PubMed] [Google Scholar]
- 11.Beral V, Bull D, Green J, Reeves G. Ovarian cancer and hormone replacement therapy in the Million Women Study. Lancet. 2007 May 19;369(9574):1703–1710. doi: 10.1016/S0140-6736(07)60534-0. [DOI] [PubMed] [Google Scholar]
- 12.Fournier A, Mesrine S, Boutron-Ruault MC, Clavel-Chapelon F. Estrogen-progestagen menopausal hormone therapy and breast cancer: does delay from menopause onset to treatment initiation influence risks? J Clin Oncol. 2009 Nov 1;27(31):5138–5143. doi: 10.1200/JCO.2008.21.6432. [DOI] [PMC free article] [PubMed] [Google Scholar]
- 13.Colditz GA, Hankinson SE, Hunter DJ, et al. The use of estrogens and progestins and the risk of breast cancer in postmenopausal women. N Engl J Med. 1995;332:1589–1593. doi: 10.1056/NEJM199506153322401. [DOI] [PubMed] [Google Scholar]
- 14.Simpson JA, English DR, Macinnis RJ, Gertig DM, Hopper JL, Giles GG. A comparison of different methods for including ‘age at menopause’ in analyses of the association between hormone replacement therapy use and breast cancer. J Fam Plann Reprod Health Care. 2007 Jan;33(1):11–16. doi: 10.1783/147118907779399828. [DOI] [PubMed] [Google Scholar]
- 15.Bromberger JT, Matthews KA, Kuller LH, Wing RR, Meilahn EN, Plantinga P. Prospective study of the determinants of age at menopause. Am J Epidemiol. 1997 Jan 15;145(2):124–133. doi: 10.1093/oxfordjournals.aje.a009083. [DOI] [PubMed] [Google Scholar]
- 16.McKinlay SM, Brambilla DJ, Posner JG. The normal menopause transition. Maturitas. 1992 Jan;14(2):103–115. doi: 10.1016/0378-5122(92)90003-m. [DOI] [PubMed] [Google Scholar]
- 17.Hardy R, Kuh D. Reproductive characteristics and the age at inception of the perimenopause in a British National Cohort. Am J Epidemiol. 1999 Apr 1;149(7):612–620. doi: 10.1093/oxfordjournals.aje.a009861. [DOI] [PubMed] [Google Scholar]
- 18.Hardy R, Kuh D, Wadsworth M. Smoking, body mass index, socioeconomic status and the menopausal transition in a British national cohort. Int J Epidemiol. 2000 Oct;29(5):845–851. doi: 10.1093/ije/29.5.845. [DOI] [PubMed] [Google Scholar]
- 19.Lawlor DA, Ebrahim S, Smith GD. The association of socio-economic position across the life course and age at menopause: the British Women’s Heart and Health Study. Bjog. 2003 Dec;110(12):1078–1087. [PubMed] [Google Scholar]
- 20.Meschia M, Pansini F, Modena AB, et al. Determinants of age at menopause in Italy: results from a large cross-sectional study. ICARUS Study Group. Italian Climacteric Research Group Study. Maturitas. 2000 Feb 15;34(2):119–125. doi: 10.1016/s0378-5122(99)00095-x. [DOI] [PubMed] [Google Scholar]
- 21.Gold EB, Bromberger J, Crawford S, et al. Factors associated with age at natural menopause in a multiethnic sample of midlife women. Am J Epidemiol. 2001 May 1;153(9):865–874. doi: 10.1093/aje/153.9.865. [DOI] [PubMed] [Google Scholar]
- 22.Kaczmarek M. The timing of natural menopause in Poland and associated factors. Maturitas. 2007 Jun 20;57(2):139–153. doi: 10.1016/j.maturitas.2006.12.001. [DOI] [PubMed] [Google Scholar]
- 23.Palmer JR, Rosenberg L, Wise LA, Horton NJ, Adams-Campbell LL. Onset of natural menopause in African American women. Am J Public Health. 2003 Feb;93(2):299–306. doi: 10.2105/ajph.93.2.299. [DOI] [PMC free article] [PubMed] [Google Scholar]
- 24.Cramer DW, Xu H. Predicting age at menopause. Maturitas. 1996 Apr;23(3):319–326. doi: 10.1016/0378-5122(96)00992-9. [DOI] [PubMed] [Google Scholar]
- 25.Eliassen AH, Missmer SA, Tworoger SS, et al. Endogenous steroid hormone concentrations and risk of breast cancer among premenopausal women. J Natl Cancer Inst. 2006 Oct 4;98(19):1406–1415. doi: 10.1093/jnci/djj376. [DOI] [PubMed] [Google Scholar]
- 26.The Endogenous Hormones and Breast Cancer Collaborative Group. Endogenous sex hormones and breast cancer in postmenopausal women: reanalysis of nine prospective studies. J Natl Cancer Inst. 2002;94:606–616. doi: 10.1093/jnci/94.8.606. [DOI] [PubMed] [Google Scholar]
- 27.Colditz GA. The Nurses’ Health Study: A cohort of US women followed since 1976. JAMWA. 1995;50:40–44. 63. [PubMed] [Google Scholar]
- 28.Colditz GA, Hankinson SE. The Nurses’ Health Study: lifestyle and health among women. Nat Rev Cancer. 2005 May;5(5):388–396. doi: 10.1038/nrc1608. [DOI] [PubMed] [Google Scholar]
- 29.Stampfer MJ, Willett WC, Speizer FE, et al. Test of the National Death Index. Am J Epidemiol. 1984;119:837–839. doi: 10.1093/oxfordjournals.aje.a113804. [DOI] [PubMed] [Google Scholar]
- 30.Rich-Edwards J, Corsano K, Stampfer M. Test of the National Death Index and Equifax Nationwide Death Search. Am J Epidemiol. 1994;140:1016–1019. doi: 10.1093/oxfordjournals.aje.a117191. [DOI] [PubMed] [Google Scholar]
- 31.Colditz G, Rosner B, Chen WY, Holmes M, Hankinson SE. Risk factors for breast cancer:according to estrogen and progesterone receptor status. J Natl Cancer Inst. 2004;96:218–228. doi: 10.1093/jnci/djh025. [DOI] [PubMed] [Google Scholar]
- 32.Wei LJ, Lin D, Weissfeld L. Regression analysis of multivariate incomplete failure time data by modeling marginal distributions. J Am Stat Assoc. 1989;84:1065–1073. [Google Scholar]
- 33.SEER. SEER Cancer Statistics Review: 1973-1992. Bethesda: National Cancer Institute; 1995. [Google Scholar]
- 34.Rosner B, Colditz G. Log-incidence mathematical model of breast cancer incidence. J Natl Cancer Inst. 1996;88:359–364. doi: 10.1093/jnci/88.6.359. [DOI] [PubMed] [Google Scholar]
- 35.Colditz G, Rosner B. Cumulative risk of breast cancer to age 70 years according to risk factor status: data from the Nurses’ Health Study. Am J Epidemiol. 2000;152(10):950–964. doi: 10.1093/aje/152.10.950. [DOI] [PubMed] [Google Scholar]
- 36.Willett W, Stampfer MJ, Bain C, et al. Cigarette smoking, relative weight, and menopause. Am J Epidemiol. 1983;117:651–658. doi: 10.1093/oxfordjournals.aje.a113598. [DOI] [PubMed] [Google Scholar]
- 37.Missmer SA, Spiegelman D, Bertone-Johnson ER, Barbieri RL, Pollak MN, Hankinson SE. Reproducibility of plasma steroid hormones, prolactin, and insulin-like growth factor levels among premenopausal women over a 2- to 3-year period. Cancer Epidemiol Biomarkers Prev. 2006 May;15(5):972–978. doi: 10.1158/1055-9965.EPI-05-0848. [DOI] [PubMed] [Google Scholar]
- 38.Colditz GA, Stampfer MJ, Willett WC, et al. Reproducibility and validity of self-reported menopausal status in a prospective cohort study. Am J Epidemiol. 1987;126:319–325. doi: 10.1093/aje/126.2.319. [DOI] [PubMed] [Google Scholar]
- 39.Bell RJ, Lijovic M, Fradkin P, Davis SR. A pragmatic approach to the classification of menopausal status for community-based research. Menopause. 2008 Sep-Oct;15(5):978–983. doi: 10.1097/gme.0b013e318162c487. [DOI] [PubMed] [Google Scholar]
- 40.Beral V. Breast cancer and hormone-replacement therapy in the Million Women Study. Lancet. 2003 Aug 9;362(9382):419–427. doi: 10.1016/s0140-6736(03)14065-2. [DOI] [PubMed] [Google Scholar]
- 41.Simpson JA, MacInnis RJ, English DR, Gertig DM, Morris HA, Giles GG. A comparison of estradiol levels between women with a hysterectomy and ovarian conservation and women with an intact uterus. Climacteric. 2005 Sep;8(3):300–303. doi: 10.1080/13697130500186560. [DOI] [PubMed] [Google Scholar]
- 42.Henderson KD, Bernstein L, Henderson B, Kolonel L, Pike MC. Predictors of the timing of natural menopause in the Multiethnic Cohort Study. Am J Epidemiol. 2008 Jun 1;167(11):1287–1294. doi: 10.1093/aje/kwn046. [DOI] [PubMed] [Google Scholar]
- 43.Pike MC, Kolonel LN, Henderson BE, et al. Breast cancer in a multiethnic cohort in Hawaii and Los Angeles: risk factor-adjusted incidence in Japanese equals and in Hawaiians exceeds that in whites. Cancer Epidemiol Biomarkers Prev. 2002 Sep;11(9):795–800. [PubMed] [Google Scholar]