Abstract
Dynamic imaging methods based on the Partially Separable Functions (PSF) model have been used to perform ungated cardiac MRI, and the critical parameter determining the quality of the reconstructed images is the order, L, of the PSF model. This work extends previous methods by increasing L in the cardiac region to improve the ability of the PSF model to represent complex spatiotemporal signals. The resulting higher order PSF model is fit to sparse (k, t)-space data using spatial-spectral support, spatial-eigenbasis support, and spectral sparsity constraints. This new method is demonstrated in the context of 2D first-pass perfusion MRI in a healthy rat heart.
I. Introduction
The Partially Separable Functions (PSF) model is a powerful tool for representing spatiotemporal signals [1], and it has been successfully applied to real-time cardiac MRI to visualize the anatomy of rat hearts [2], [3]. These dynamic imaging methods have practical advantages over gated cardiac imaging including robustness to arrhythmia, imaging without breath holding, and elimination of the measurement of physiological signals. In contrast to gated imaging, MRI data are acquired continuously and are reconstructed into a time series of images representing the actual cardiorespiratory motion insteadof average images of the heartbeat.
An important application of cardiac MRI is first-pass perfusion imaging where a bolus of contrast agentis injected, and its first-pass through the heart is imaged [4], [5], [6]. This type of perfusion imaging can be used in the diagnosis of coronary artery disease [6], and it has potential for use in the study of acute rejection of transplanted hearts [7], [8], [9]. The main idea for studying acute heart rejection is that the perfusion characteristics may reveal deterioration within the heart caused by the immune response. These deteriorations are expected to be spatially inhomogeneous [7], [8], so high spatial resolution is required to make the measurements (less than 1 mm2 in plane). Also, for the imaging to be performed while the subject is breathing without gating, high temporal resolution is required (20 ms or better).
A number of dynamic imaging methods have been applied to the first-pass perfusion cardiac imaging problem including TSENSE [10], k-t SENSE [11], and k-t PCA [12]; however, these applications used gating, and it is not clear that any of these methods are usable in the context of the rat heart without gating. The rat’s heart rate is 5 times higher than that of a human, so temporal undersampling on the order of 100 times must be tolerated while these methods are known to function in the undersampling range from 2 to 8. In comparison, methods taking advantage of the PSF model [1] have been shown to produce reliable reconstructions with temporal undersampling as high as a factor of 200 [2], [3].
This paper describes the application of a new PSF model based dynamic imaging method to first-pass perfusion cardiac MRI. The new method increases the PSF model order in the heart region to allow for the representation of more complex spatiotemporal signals than is possible with lower model orders. These higher order terms are determined using an (x, f)-space support constraint, a generalized support constraint, and sparsity in the (x, f)-space. The result is a dynamic imaging method that can tolerate temporal undersampling at factors over 100 and that can track the first-pass of a bolus of contrast agent. An experimental example of first-pass perfusion imaging of a healthy rat heart is given in this paper.
II. Theory
The Lth-order PSF model [1] of a dynamic image can be expressed in the spatiotemporal domain as
| (1) |
where ρpsf(x, t) is the model of the dynamic image; {αℓ(x)} are the spatial basis functions; and {φ(t)} are the temporal basis functions. In MRI it is possible to design the data acquisition scheme to directly estimate {φℓ(t)} [1], so {αℓ(x)} are the unknowns in the dynamic imaging reconstruction problem. The next step for applying the PSF model is to define the relationship between its unknowns and the acquired data. The acquired data in MRI are related to the dynamic image by the Fourier Transform [13]
| (2) |
so the forward data model, E, defining the relationship between s(k, t) and {αℓ(x)} can be formed by combining Eq. 1 and Eq. 2. The result can be written in matrix form as
| (3) |
where Φ is a matrix of the PSF temporal basis functions whose product with α gives a vector containing the (x, t)-space reconstruction. S represents the coil sensitivities, and is a Fourier transform to the k-space. is the sampling operator that retains only those data actually acquired in the (k, t)-space.
In practice, the sampling operator, , is designed so that training data are acquired with high temporal resolution in addition to the sparse samples of s(k, t) (see Fig. 1 for one example). The training data are used to determine the temporal basis functions, Φ, using a Singular Value Decomposition (SVD) [1], so the dynamic image reconstruction process reduces to fitting the temporal basis functions to the sparse samples of s(k, t) to find the spatial basis functions [1].
Fig. 1.
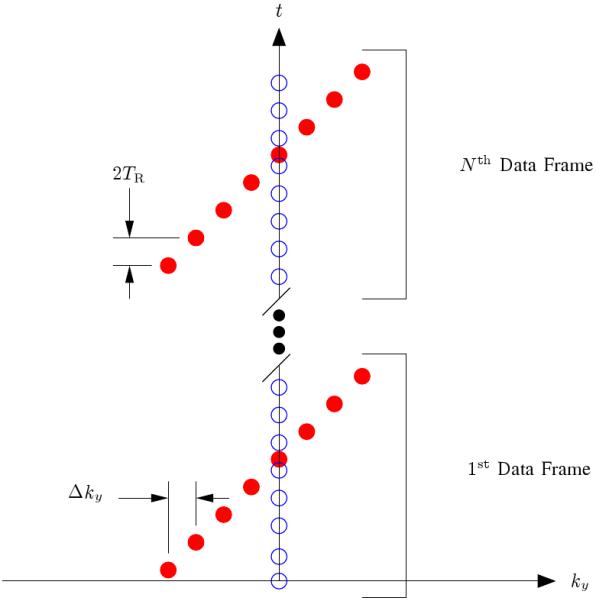
The k-t sampling pattern used for data acquisition where the readout direction is into the page. The open circles represent the training data, and the filled circles represent the (k, t)-space sparse samples. The reader should note that the training data has been restricted to a single phase encoding for the sake of efficiency since this training data has proven adequate for most cardiac MRI tasks using the PSF model; however, extended k-space coverage of the training data is encouraged when the overhead can be tolerated since it will improve the accuracy of the temporal basis functions [1]. This figure is adapted from [2].
Previous work incorporated (x, f)-space support constraints into the PSF model fitting process [3], and this work adds a generalized support constraint in the spatial-principal component domain by introducing a matrix M that restricts the contribution of higher order PSF terms to a certain spatial region. For example, in this work the cardiac region has a model order of L = 32, while the remainder of the spatial domain has a model order of 16. To aid the PSF model fitting process, a sparsity constraint on the (x, f)-space of the higher order PSF terms in the cardiac region is used where the higher order terms are those with ℓ = 17, 18, ∆ , 32 in this example. The PSF model fitting is then performed by solving
s.t.
| (4) |
where
| (5) |
and
| (6) |
The definitions of W1 and W2 deserve additional explanation. W1 converts the higher order PSF model terms to the (x, f)-space, and the ho subscript refers to the higher order terms located in the cardiac region. The choice of the higher order terms defines both M and αho. W2 incorporates spatial-spectral information about the location of the cardiac and respiratory motions. In W2, P is an (x, f)-space penalty defined to give no penalty to the cardiac region, penalize high frequencies in the respiratory region, and penalize all frequencies in the empty region [3]. In general, P is tailored to the subject based on their average heart and respiratory rates and an approximate location of the heart. An example of the definition of the 3 spatial regions for the constraints is given in Figure 2. These regions are defined by first forming a time averaged imaged, thresholding the average image to find the empty regions, and then defining a polygon containing the heart.
Fig. 2.
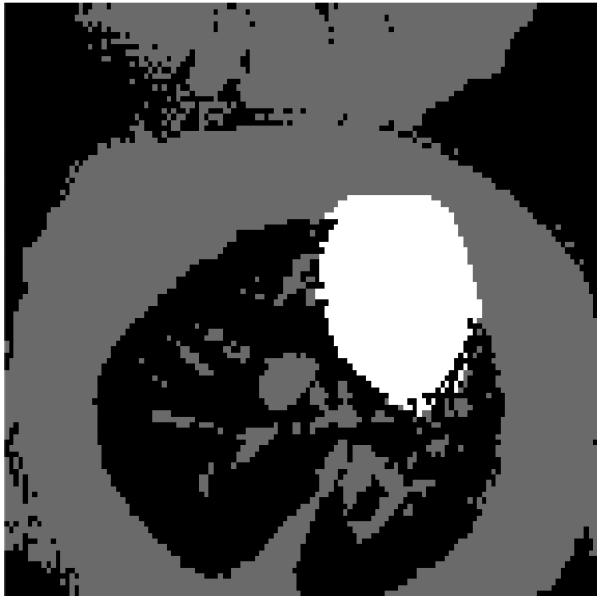
Experimental definition of the 3 regions in the image used to define both the spatial-spectral support constraint, P, and the generalized support constraint, M. The cardiac region is white. The respiratory region is gray, and the empty region is black. The spatial regions are found by first thresholding a time averaged image and then manually selecting the cardiac region.
The optimization problem in Eq. 4 seeks a solution with a sparse (x, f)-space from the higher order PSF model in the cardiac region that is also data consistent. The data consistency constraint is regularized using two ℓ2 norms. The first term is based on W2 and M, so it incorporates both the spatial-spectral and generalized support constraints. The second term is based on W1 and serves to stabilize the FOCUSS iterations to avoid blowing up of the solution in the presence of noise as well as modeling errors [14].
III. Methods
A. Animal Model
The animal used in the study was a healthy, Brown Norway rat as in reference [8]. All animals received humane care in compliance with the Guide for the Care and Use of Laboratory Animals, published by the National Institutes of Health, and the animal protocol was approved by the Carnegie Mellon University Institutional Animal Care and Use Committee.
B. Data Acquisition
All experimental data in this paper were collected using a Bruker (Billerica, MA) Avance DRX 4.7 T, 40 cm equipped with a 12 cm, 40 G/cm shielded gradient set. A 5.5 cm custom built surface coil was used for the collections. An ungated FLASH pulse sequence with TR = 7.5 ms, TE = 2.4 ms, and the (k, t)-space sampling pattern shown in Fig. 1 was used to acquire the MRI data over a 5 minute time period. The example shown here used 128 × 102 encodings over a 50 × 40 mm field of view with a 1.5 mm slice thickness. A bolus of a gadolinium contrast agent was injected 30 seconds after the start of the data acquisition into the tail vein of the rat. The concentration used in the example in this paper was 0.025 mmol / ( kg of body mass ).
C. Image Reconstruction and Analysis
The PSF model was fit to the measured data by solving Eq. 4 using the FOCUSS algorithm [14] where λ2 = 1, λ1 = 100, and the maximum k-space values were on the order of 105. L = 32 was used within the cardiac region, while 16 was used outside. The 3 spatial regions needed to define P and M are shown in Fig. 2 where the cardiac region is white, the respiratory region is gray, and the empty region is black. The cutoff frequency for the respiratory region was 3.75 Hz in P, while the rat has a respiratory rate of 1 Hz and a cardiac rate of approximately 5 Hz.
IV. Results and Discussion
A. Simulation Results
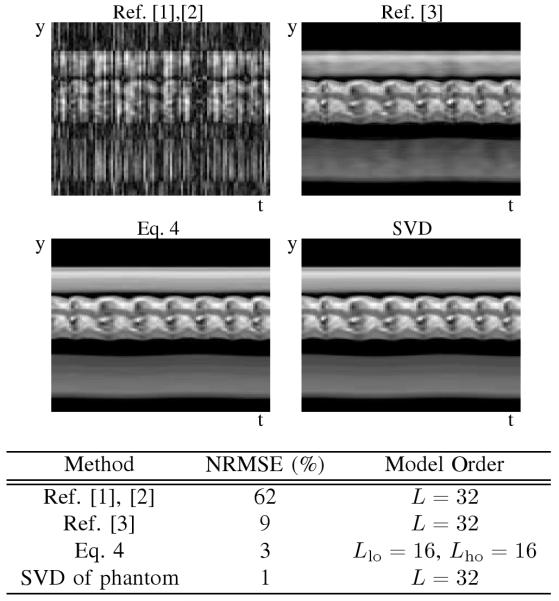
The proposed method’s performance has been compared to previous PSF model-based methods in simulation, and representative results are given in Table 3. The proposed method better reconstructs the dynamic images than previous methods when driving the model order to a high value (L = 32). The performance of PSF model-based methods is lower bounded by the error of the SVD approximation of the phantom, and the proposed method comes to within a couple of percent of the maximum performance.
B. Experimental Results
The PSF model fitting process specified by Eq. 4 produces clean dynamic images as seen by the samples in Fig. 4. Ungated cardiac imaging using the PSF model is an important result since the method is applicable to a wider variety of scenarios than gated cardiac imaging. Signal-intensity curves from first-pass perfusion cardiac MRI are shown in Fig. 5.
Fig. 4.
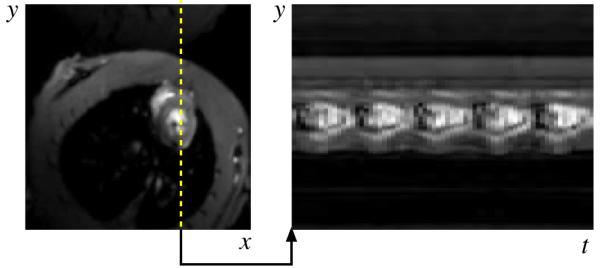
Representative experimental results for the (y, x)-space and (y, t)-space from the proposed PSF model based imaging method. The image is free of motion artifacts and 5 heartbeats are visible over the 1 second interval.
Fig. 5.
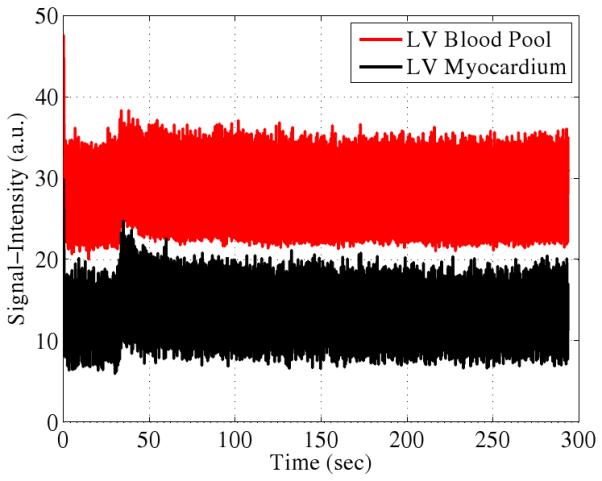
Representative experimental first-pass perfusion signal-intensity curves. The wash-in and wash-out are visible as is the residual contrast agent at long time scales.
C. Effects of Constraints
The PSF model fitting to the sparse (k, t)-space samples is a critical part of the method, and this process is driven by the choices of P, M. Well defined P and M reduce the number of degrees of freedom in the solution which improves the robustness of the PSF model fitting; however, incorrect definitions of P and M can cause problems. For example, if P incorrectly defines an empty region within some region of tissue and λ2 is chosen aggressively enough, then that region will be falsely dark. Also, if the temporal bandwidth is chosen to be too small, the reconstruction will suffer from temporal blurring. To work around these two issues, the spatial regions are defined so that they underestimate the amount of empty space and overestimate the size of the cardiac region. An estimate of the noise in the average image is used to threshold the image by finding all pixels with an absolute value less than the mean noise plus 4 standard deviations. The result is then manually corrected to eliminate false empty pixels from the tissues and blood. Due to flow artifacts, this manual correction is almost always necessary in the blood pool. The cardiac region is manually determined by drawing a polygon on the average image, and the cardiac region is purposely overestimated. The temporal bandwidths for P are defined based on a combination of physiological information and analysis of the spectrum of the training data. The fundamental frequencies of the heartbeat and respiration are visible as high energy peaks in the temporal Fourier transform of the training signal, so the respiratory bandwidth is chosen to capture the majority of the energy below the cardiac frequencies.
D. Regularization Parameter Selection
The choices of λ2 and λ1 also have an influence on the PSF model fitting. λ2 has essentially 3 regimes of operation. λ2 too large over smooths the solution. λ2 too small has no impact on the solution (typically leaving motion artifacts), and an appropriate λ2 eliminates motion artifacts caused by poor fitting of the PSF model. λ1 also has 3 characteristic zones. λ1 too large drives the higher order terms to zero, while λ1 too small allows the higher order terms to blow up to very large values. λ1 in an appropriate range results in higher order terms that quickly converge to non-zero values within about 10 iterations of the numerical solver. The appropriate zone for each regularization parameter was determined iteratively.
E. Parallel Imaging
While the new method has been demonstrated using a single coil, it is compatible with phased array coils. The definition of the forward data model, E, contains a matrix to represent the phase array coil sensitivities, and the extension is essentially the same as the most general form of SENSE [15]. Therefore, parallel imaging can be seen to have the same advantages for this method as in other dynamic imaging methods [16]. Using a phased array coil will allow for the number of (k, t)-space samples to be reduced, so the data acquisition duration can be reduced or the spatial resolution can be increased compared to the single coil case. Of course, a phased array coil may have practical limitations due to penetration depth, loss of SNR, and non-uniform amplitude weighting across the region of interest, so these potential drawbacks must be evaluated for each application of the imaging method.
V. Conclusion
The PSF model-based dynamic imaging method described in this paper is most useful when the desired model order is too high for previously proposed methods to successfully reconstruct the dynamic images. The method works by estimating the lower order terms via data consistency and spatial-spectral support information, while the higher order terms are determined by adding spatial-eigenbasis support and spectral sparsity constraints in conjunction with the data consistency and spatial-spectral support information. The method may find use in scenarios where real-time, ungated cardiac MRI is desirable.
Fig. 3.
Simulation results demonstrate the ability of the proposed method to increase the PSF model order, L, so that a reconstruction closer to the SVD approximation can be achieved. The simulation used the same parameters and sampling pattern as the experiment, but the total acquisition time was limited to 75 seconds.
Acknowledgments
The work presented in this paper was supported in part by the following NIH research grants: P41EB-00197 and R01HL-081349.
The authors thank Justin Haldar for many useful discussions related to this work.
References
- [1].Liang Z-P. Spatiotemporal Imaging with Partially Separable Functions. Proc ISBI. 2007:988–991. [Google Scholar]
- [2].Brinegar C, Wu Y-JL, Foley LM, Hitchens TK, Ye Q, Ho C, Liang Z-P. Real-Time Cardiac MRI Without Triggering, Gating, or Breath Holding. EMBC. 2008:3381–3384. doi: 10.1109/IEMBS.2008.4649931. [DOI] [PMC free article] [PubMed] [Google Scholar]
- [3].Brinegar C, Zhang H, Wu Y-JL, Foley LM, Hitchens TK, Ye Q, Pocci D, Lam F, Ho C, Liang Z-P. Real-Time Cardiac MRI using Prior Spatial-Spectral Information. EMBC. 2009:4383–4386. doi: 10.1109/IEMBS.2009.5333482. [DOI] [PMC free article] [PubMed] [Google Scholar]
- [4].Christian TF, Rettmann DW, Aletras AH, Liao SL, Taylor JL, Balaban RS, Arai AE. Absolute Myocardial Perfusion in Canines Measured by Using Dual-Bolus First-Pass MR Imaging. Radiology. 2004;232:677–684. doi: 10.1148/radiol.2323030573. [DOI] [PubMed] [Google Scholar]
- [5].Finn JP, Nael K, Deshpande V, Ratib O, Laub G. Cardiac MR Imaging: State of the Technology. Radiology. 2006 November;241(2):338–354. doi: 10.1148/radiol.2412041866. [DOI] [PubMed] [Google Scholar]
- [6].Biederman RWW, Doyle M, Yamrozik J. Cardiovascular MRI Tutorial: Lectures and Learning. 1st ed. Lippincott Williams and Wilkins; 530 Walnut St, Philadelphia, PA 19106, USA: 2008. [Google Scholar]
- [7].Muehling OM, Panse P, Jorosch-Herold M, Wilson BV, Wilson RF, Wilke NM, Miller LW. Cardiac Magnetic Resonance Perfusion Imaging Identifies Transplant Arteriopathy by a Reduced Endomyocardial Resting Perfusion. The Journal of Heart and Lung Transplantation. 2005:1122–1123. doi: 10.1016/j.healun.2004.08.022. [DOI] [PubMed] [Google Scholar]
- [8].Wu Y-JL, Ye Q, Foley LM, Hitchens TK, Sato K, Williams JB, Ho C. In Situ Labeling of Immune Cells with Iron Oxide Particles: An Approach to Detect Organ Rejection by Cellular MRI. PNAS. 2006 Feb;103(6):1852–1857. doi: 10.1073/pnas.0507198103. [DOI] [PMC free article] [PubMed] [Google Scholar]
- [9].Wu Y-JL, Ye Q, Sato K, Foley LM, Ho TKHC. Noninvasive Evaluation of Cardiac Allograft Rejection by Cellular and Functional Cardiac Magnetic Resonance. J Am Coll Cardiol Img. 2009;(2):731–741. doi: 10.1016/j.jcmg.2009.01.013. [DOI] [PMC free article] [PubMed] [Google Scholar]
- [10].Kellman P, Derbyshire JA, Agyeman KO, McVeigh ER, Arai AE. Extended Coverage First-Pass Perfusion Imaging using Slice-Interleaved TSENSE. Magn Reson Med. 2004;51(1):200–204. doi: 10.1002/mrm.10663. [DOI] [PMC free article] [PubMed] [Google Scholar]
- [11].Plein S, Ryf S, Schwitter J, Radjenovic A, Boesiger P, Kozerke S. Dynamic Contrast-Enhanced Myocardial Perfusion MRI Accelerated with k-t SENSE. Magn Reson Med. 2007;58:777–785. doi: 10.1002/mrm.21381. [DOI] [PubMed] [Google Scholar]
- [12].Pedersen H, Kozerke S, Ringgaard S, Nehrke K, Kimm WY. k-t PCA: Temporally Constrained k-t BLAST Reconstruction Using Principle Component Analysis. Magn Reson Med. 2009;62:706–716. doi: 10.1002/mrm.22052. [DOI] [PubMed] [Google Scholar]
- [13].Xiang Q-S, Henkelman RM. K-Space Description for MR Imaging of Dynamic Objects. Magn Reson Med. 1993;29:422–428. doi: 10.1002/mrm.1910290324. [DOI] [PubMed] [Google Scholar]
- [14].Gorodnitsky IF, Rao BD. Sparse Signal Reconstruction from Limited Data using FOCUSS: A Re-weighted Minimum Norm Algorithm. IEEE Trans on Signal Proc. 1997;45(3):600–616. [Google Scholar]
- [15].Pruessmann KP, Weiger M, Bornert P, Boesiger P. Advances in Sensitivity Encoding with Arbitrary k-Space Trajectories. Magn Reson Med. 2001;46:638–651. doi: 10.1002/mrm.1241. [DOI] [PubMed] [Google Scholar]
- [16].Tsao J, Boesiger P, Pruessmann KP. k-t BLAST and k-t SENSE: Dynamic MRI with High Frame Rate Exploiting Spatiotemporal Correlations. Magn Reson Med. 2003;50:1031–1042. doi: 10.1002/mrm.10611. [DOI] [PubMed] [Google Scholar]


