

Abstract
Although much is known about the effects of uniaxial mechanical loading on fibrocartilage development, the stress fields to which fibrocartilaginous regions are subjected to during development are mutiaxial. That fibrocartilage develops at tendon-to-bone attachments and in compressive regions of tendons is well established. However, the three-dimensional (3D) nature of the stresses needed for the development of fibrocartilage is not known. Here, we developed and applied an in vitro system to determine whether fibrocartilage can develop under a state of periodic hydrostatic tension in which only a single principal component of stress is compressive. This question is vital to efforts to mechanically guide morphogenesis and matrix expression in engineered tissue replacements. Mesenchymal stromal cells in a 3D culture were exposed to compressive and tensile stresses as a result of an external tensile hydrostatic stress field. The stress field was characterized through mechanical modeling. Tensile cyclic stresses promoted spindle-shaped cells, upregulation of scleraxis and type one collagen, and cell alignment with the direction of tension. Cells experiencing a single compressive stress component exhibited rounded cell morphology and random cell orientation. No difference in mRNA expression of the genes Sox9 and aggrecan was observed when comparing tensile and compressive regions unless the medium was supplemented with the chondrogenic factor transforming growth factor beta3. In that case, Sox9 was upregulated under static loading conditions and aggrecan was upregulated under cyclic loading conditions. In conclusion, the fibrous component of fibrocartilage could be generated using only mechanical cues, but generation of the cartilaginous component of fibrocartilage required biologic factors in addition to mechanical cues. These studies support the hypothesis that the 3D stress environment influences cell activity and gene expression in fibrocartilage development.
Introduction
Musculoskeletal injuries are a common cause of pain and disability, and result in significant healthcare costs.1 Many of these injuries require regeneration of fibrocartilage (tissue composed of fibrous and cartilaginous components) for effective healing.2–4 For example, meniscus healing is typically insufficient due to a lack of fibrocartilage regeneration.3 Similarly, tendon-to-bone healing and repair, as frequently required after rotator cuff injury, often fails due to a lack of fibrocartilage formation at the tendon-to-bone interface.4 Little is known about natural fibrocartilage healing, and hence little can be done to improve it. We and others have hypothesized that rebuilding the fibrocartilaginous insertion site of the tendon or ligament into bone is critical for restoration of function and for prevention of re-injury.4–6
Several studies provide evidence that the stress environment influences cell morphology and the fibrocartilage production.7,8 Compressive loads in vivo have been shown to change tendon composition and structure to a more fibrocartilaginous and disorganized morphology.9 Proteoglycans (extracellular matrix proteins normally found in cartilage and fibrocartilage) are produced in compressed areas of tendon.9 Similarly, subjecting tensile regions of tendon to compression induces proteoglycan production.10,11 These effects can be seen most clearly where tendons wrap around bony pulleys (e.g., extensor tendons in the hand). The loading mode (cyclic vs. static), magnitude, and direction (tensile vs. compressive) may have a significant effect on the development and remodeling of these tissues.9–12
Here we present an in vitro system with a well-defined stress field and apply it to address the physiologic questions: what is the nature of the multiaxial stress field at tendon locations where fibrocartilage formation is observed, and how does this stress field affect mesenchymal stromal cell (MSC) differentiation and matrix production? The mechanical modeling results of the current study suggest the hypotheses that, even in the presence of tensile hydrostatic stress, only a single compressive principal stress component is needed to promote rounded cell shape without a preferred orientation (indicative of fibrocartilage), whereas tensile stress in the absence of compression promotes spindle-shaped cells aligned in the direction of tensile stress (indicative of tendon). We further hypothesized that tensile cyclic loading would lead to upregulation of scleraxis and type I collagen expression (indicative of tendon fibroblast differentiation) and that compressive cyclic loading would lead to an upregulation of Sox9 and aggrecan (indicative of chondrocyte differentiation). As most cartilage tissue engineering approaches use transforming growth factor beta (TGF-β) supplementation to promote chondrogenesis, we examined the response of mesenchymal stem cells to their stress environment under standard and TGF-β supplemented media conditions.
Materials and Methods
The in vitro model consisted of MSC-seeded collagen matrices (CSCMs) loaded statically or cyclically at 1 Hz for 7 days (n = 7–9 CSCMs per group for cell morphology and gene expression) (Figs. 1 and 2). A control group was also evaluated before the start of loading. MSCs were used in this study due to their pluripotent nature (i.e., their potential to follow chondrogenic or tenogenic pathways). This in vitro system modeled the compressive and tensile regions that are normally found in tendons that wrap around bony pulleys (Fig. 2). Each matrix was divided into tensile and compressive regions for analysis. Whole mount immuno-fluorescence was used to determine cell shape and cell orientation. Quantitative polymerase chain reaction (qPCR) was used to measure mRNA expression of scleraxis, type I collagen, Sox9, and aggrecan.
FIG. 1.

Schematic of preparation, conditioning, and mechanical testing of cell-populated collagen matrices. Solubilized collagen and cells are mixed in Dulbecco's modified Eagle's medium (a) and poured into Teflon casting wells (b). After a 48 h incubation (c), the mandrel is removed from the well (d) and the remodeled matrix ring is removed from the mandrel (e). The matrix ring is then mounted between spacers for long-term culture (f). Finally, the matrix is examined for cell morphology and gene expression (g). Color images available online at www.liebertonline.com/tea.
FIG. 2.

Ring-shaped CSCMs were cyclically loaded in vitro (top left). The in vitro loading setup resulted in regions of the matrix that loaded in tension and regions of the matrix that were loaded in compression. This is similar to the loading environment of tendons of the hand that wrap around bony pulleys (bottom left). Cells in the tensile region (top right) were spindle shaped and aligned with the direction of loading, whereas cells in the compressive region were rounded without a preferred orientation (bottom right, 20× objective). CSCM, mesenchymal stromal cell seeded collagen matrix.
Specimen synthesis
MSCs were isolated from rat bone marrow by differential attachment and used at passages 2 to 4. Pilot studies demonstrated that these cells have chondrogenic, osteogenic, and adipogenic capabilities (data not shown). The left and right femurs were dissected and the proximal and distal ends were removed to expose the marrow cavity. The marrow cavity was then flushed with 20 mL of complete α-minimum essential media (α-MEM) (α-MEM with 10% fetal bovine serum [FBS], 100 units/mL penicillin, and 100 μg/mL streptomycin) using a syringe with a 23-gauge needle to collect the cells. The cells were spun down, re-suspended in 10 mL of complete α-MEM, plated in a 60 mm Petri dish, and incubated at 37°C with 5% CO2. After 24 h, the medium was removed (thus removing nonadherent haematopoietic cells) and replaced with 5 mL of fresh media.
Cells were grown in standard culture conditions in an incubator at 37°C with 5% CO2. To create cell-seeded CSCMs, solubilized rat-tail type I collagen (Upstate) in 0.02M acetic acid at 4°C was neutralized with 0.1N NaOH and mixed with 2× Dulbecco's modified Eagle's medium containing 10% FBS to yield a final 1× Dulbecco's modified Eagle's medium concentration. MSCs from rat bone marrow cultured as monolayers in tissue culture flasks were trypsinized and suspended in culture media containing 10% FBS at a concentration of 1.1 × 10⁶ cells/mL. Suspended MSCs were then mixed with the collagen solution to yield a final cell concentration of 500,000 cells/mL (Fig. 1). Two milliliters of this mixture was poured into cylindrical Teflon casting wells (inner diameter 23.7 mm) containing a circular inner mandrel (diameter 19 mm). The casting wells were incubated at 37°C and 5% CO2 for 30 min. During this time, the collagen polymerized and the cells became suspended within the matrix, forming a ring-shaped CSCM between the mandrel and inner wall of the casting well. The culture medium was then added to the wells and the CSCMs were incubated for 48 h. During this time, the cells remodeled the collagen matrix, reducing the volume to a final ring thickness of ∼200 μm.
Mechanical loading of cell seeded collagen matrices
After 48 h, CSCMs were removed from the mandrel and mounted on spacers positioned 15 mm apart on a mechanical loading apparatus for either static or dynamic cyclic loading (Fig. 1).13 CSCMs were cultured with complete α-MEM alone or complete α-MEM supplemented with 10 ng/mL TGF-β314,15 (R&D Systems). The entire apparatus was placed inside an incubator and the CSCMs were incubated for an additional 24 h before beginning loading. For cyclic loading, CSCMs were loaded at 1.5 mm amplitude and 1 Hz (equivalent to the frequency of walking gait) for 7 days13,16; at these frequencies, the effects of wave motion were negligible.17 CSCMs mounted between spacers and held at constant length for the same interval served as statically loaded controls (equivalent to developing fibrocartilage in utero). After 7 days, CSCM rings were removed from the spacers and cut in the middle of their tensile arms, yielding two samples per CSCM with the compressive region centered between tensile regions.
Quantification of the stress environment
The mechanical environment was modeled using analytical and computational mechanics approaches. Analytical approaches estimated the stress fields in the centers of the compressive and tensile regions; computational approaches characterized the transition between compressive and tensile regions. In both cases, the model was a quasi-statically stretched, transversely isotropic, nonlinearly elastic CSCM wrapped around a cylindrical loading bar, or, equivalently, a pulley-like representation of a wrap-around tendon (Fig. 3). The plane of isotropy was normal to the circumferential centerline of the CSCM. The loading bar was assigned uniform radius in the region of contact, and the CSCM was assigned uniform thickness. Friction was neglected over the contact area.18 The applied force F was distributed uniformly over the model's depth d (into the page in Fig. 3). Out-of-plane shearing deformations were therefore negligible. Since the CSCM is relatively thin and the shear stress at the CSCM-loading bar interface is small, plane stress was used. A plane strain approximation was appropriate for the long, stiff loading bar.
FIG. 3.

(a) Mechanical modeling was used to examine stress field in a CSCM wrapped around a cylindrical loading bar or, equivalently, a pulley-like representation of a wrap-around tendon. (b), (c) Symmetric boundary conditions were applied on the left and lower surfaces. The free end of the tendon was displaced downward uniformly and allowed to contract freely in the horizontal direction. This motion required a net force F. (d) The domain Ω, a quarter of the entire domain, was modeled using ∼10,000 quadratic interpolation plane stress elements.
Analytical solution
The mean tangential Cauchy stress  across the horizontal slice ∂ΩB of the CSCM (Fig. 3c) balanced the applied force (Fig. 3a):
 |
(1) |
where T(x) is the Cauchy stress field at points x within the CSCM, j points upward, parallel to F, ds is an increment along ∂ΩB in the deformed configuration, and w is the width of the boundary ∂ΩB after the application of F. Neglecting the deformation of the loading bar,18 the average radial Cauchy stress  over the region of contact between CSCM and loading bar, ∂Ωc, is:
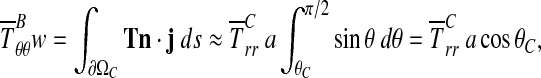 |
(2) |
where, for the case of interest in which the loading bar is stiff compared to the specimen, ∂Ωc is the circular arc of radius a extending from θc to π/2, and the outward normal n is the radial unit vector (Fig. 3). Thus,
 |
(3) |
Note that Equation 3 follows directly from the deformed configuration equations of motion,19 and is valid for any material provided that the specimen is continuous and compliant relative to bar, and that inertial effects can be neglected (as is the case with our experiments).17 Specializing further to the experimental conditions of interest in which the peak applied strain is on the order of 10% and the expected sliding displacements are small (i.e., a few percent) compared to the radius of the loading bar, we note that θc ≈ 0 and w ≈ b–a, where b is the initial outer radius of the CSCM in the region of contact. Equations 1 and 3 become:
 |
(4) |
where  and
and  are mean components of the first Piola-Kirchoff stress tensor along boundaries ∂Ωc and ∂ΩB, respectively.
Although Equation 4 lends itself to the assessment of friction effects, these can be neglected as is evident from the following argument. Applying the standard Coulomb model, the critical case to study is that in which both the normal traction and anticlockwise shear traction on the inner boundary of the specimen are constant over a region ∂Ωs (0C ≤ θ ≤ θs), and zero elsewhere. The tensile stress at B is then balanced by the vertical components of the shear and normal stress on the inner boundary:
 |
(5) |
where t is the azimuthal unit vector, positive in the anticlockwise sense, and  are constant components of T in the region of contact. The horizontal components of the shear and normal tractions must balance one another:
 |
(6) |
Solving,
 |
(7) |
where f(θC, θs) > 0. Slip occurs if  , or
, or  . While the static coefficient of friction between our specimens and Teflon is not known, it is likely <0.04, the coefficient of static friction between Teflon and steel. Using this number for the case of a very small θC, sticking can occur only if the region of contact is smaller than θs = 2.3°. Since no effects of strain localization could be observed in our specimens, this possibility could be discounted, and friction could be neglected.
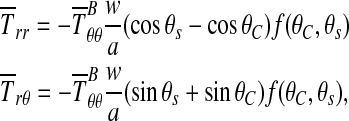
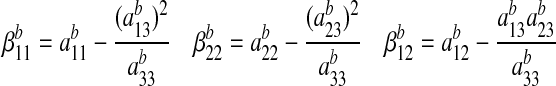
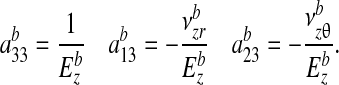
In the absence of friction, summation of the moments about the center point D indicates that the radial stress distribution should vary little with respect to θ in the case of small deformations. The character of the radial stress distribution within the region of contact was found to be independent of the constitutive behavior of the specimen: stresses dropped from a compressive value at the loading bar to zero at the outer boundary. However, the specific rate at which radial stresses dropped was dependent upon the constitutive model. Independent of the constitutive law, an axisymmetric model could be used to estimate the stress field through the specimen near the apex of the specimen (∂ΩA, Fig. 3). For a linear elastic, isotropic or transversely isotropic specimen, the specific stress field is (Appendix A):
 |
(8) |
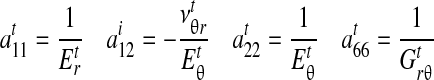
where r is the radial coordinate measured from the center of the loading bar, and 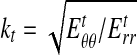 , in which
  is Young's modulus for stretching of the CSCM along the primary direction of fibers, and
  is Young's modulus for stretching perpendicular to this direction. These moduli must be understood as the tangent moduli of the specimen at the specific strain level.20 The solution procedure also provides the stress field within the loading bar (Appendix A), except at the pole of cylindrical orthotropy at the loading bar's center (Appendix B).
Numerical simulation
The transition between the above estimates for the tensile and compressive regions was characterized using finite element analysis (Comsol). A finite deformation algorithm was applied in which the equations of motion were solved in the deformed configuration, whereas a linear elastic constitutive law was applied in the reference configuration. A standard master/slave algorithm was used to monitor contact, with a relatively stiff penalty for surface interpenetration.21 One quarter of the entire domain (Ω) was modeled using ∼10,000 quadratic interpolation plane stress elements (Fig. 3d). Symmetric boundary conditions were applied,22 with shear tractions set to zero on the cut surfaces of the CSCM and loading bar and on the displaced surface ∂ΩB. The region of contact between the cylinder and CSCM was monitored by iterative calculations.
Since mechanical properties of CSCMs can vary significantly,23–25 a series of parameter studies were performed over ranges of a/b, Er/Eθ, and F/d. To facilitate comparison amongst different values of Er/Eθ, Poisson's ratio νrθ was set to zero to avoid difficulties associated with thermodynamic constraints in anisotropic materials26: as described in the results section, this assumption had a surprisingly small but nevertheless interesting effect. In all studies, the loading bar was isotropic with Young's modulus ratio Er/Ebone = 75 and Poisson's ratio ν = 0.327,28: as expected from Equations 7–8, the solution was insensitive to these parameters. The initial distance between loading bars was 6a.
Assessment of cell morphology
To determine cell shape and orientation, specimens were incubated with the lipophilic tracer 1,1′-dioctadecyl-3,3,3′,3′-tetramethylindocarbocyanine perchlorate (Invitrogen) to stain the cell membrane and imaged on a confocal laser scanning microscope (excitation: 543 nm, emission: 565; Zeiss LSM 510). Cell shape was then quantified (cell shape factor = 4πA/P2, where A and P are the cell area and perimeter, respectively) in five microscopic fields per tensile and compressive region for each CSCM. A and P were obtained for each cell by analysis of confocal images using Scion Image. The threshold tool was used to produce contrast between the cell boundaries and the collagen matrix.
Cell orientation was determined in three microscopic fields per tensile and compressive region for each matrix using methods described previously.29 Briefly, digital images (1024 × 1024 pixel resolution) were analyzed for structural information using a gradient detection algorithm.29 Using circular statistics methods, we calculated a mean vector from the normalized fitted fiber distribution for each image.29–31 The length and direction of this vector described the randomness (spread) and average angle, respectively, of the angular distribution. A vector length of one indicated no variation in cell orientations (perfectly aligned cells), whereas a vector length of zero indicated a uniform distribution of cell orientations.
Assessment of gene expression
Specimens were cut to obtain tensile and compressive regions. The border between the two regions was defined to occur at the point where the scaffold lost contact with the loading bar. As the initially annular specimens adopt a prismatic, elliptical morphology during mechanical loading, with the major axis defined by the loading bars, the regions of interest were easily identifiable. The tensile and compressive regions of each matrix were processed separately for gene expression analysis (n = 8–9 per group from three cell isolations). A separate group of CSCMs was incubated for 24 h in the molds and processed for gene expression (nonloaded time zero controls) (n = 8–9 per group from three cell isolations). RNA extraction was performed immediately following each experiment. Total RNA was isolated using the TRIspin method.32 Briefly, CSCMs were homogenized in Trizol (Invitrogen) and RNA extraction with on-column DNase digestion was performed using the RNeasy mini kit and DNase I (Qiagen) following manufacturer's instructions. RNA yield was quantified using a Nanodrop spectrophotometer (Thermo Scientific). Five hundred nanograms of RNA was reverse transcribed to cDNA using the Superscript III RT kit (Invitrogen) following manufacturer's instructions. qPCR reactions were performed using Sybr Green chemistry on a 7300 sequence detection system (Applied Biosystems). Forward and reverse primers for real-time PCR were purchased predesigned (Qiagen). The genes examined were scleraxis (tendon fibroblast transcription factor), type I collagen (tendon fibroblast marker), Sox9 (chondrocyte transcription factor), and aggrecan (chondrocyte marker). GAPDH was used as a housekeeping gene. Results were expressed as fold change relative to GAPDH and were calculated using the Delta Ct method.
Immunohistochemical assessment of type II collagen
Collagen matrices (n = 3 per group) were fixed in 4% paraformaldehyde, embedded in OCT compound (Tissue Tek OCT compound; VWR), frozen, and sectioned on a cryostat (5 μm). Immunohistochemistry was then performed to localize type II collagen. Sections were incubated with blocking solution (phosphate-buffered saline [PBS] + 0.5% bovine serum albumin) for 1 h followed by a primary antibody for type II collagen (rabbit anti-rat; Abcam) overnight. After washing in PBS, the sections were incubated with a fluorescently tagged secondary antibody (bovine anti-rat FITC; Santa Cruz biotechnology) for 1 h. After washing in PBS, the sections were mounted with DAPI mounting medium (Vectashield; Vector Laboratories) and imaged using a fluorescent microscope (Olympus IX51; Olympus) with filters for each fluorescent tag (FITC filter, exciter: 480 nm, emitter: 535 nm; DAPI filter, exciter: 360 nm, emitter: 460; Hitschfel Instruments, Inc.). For the negative control, sections were labeled with secondary antibodies without primary antibodies.
Statistics
Each CSCM contained compressive and tensile regions; therefore, paired t-tests were used to compare compressive stress to tensile stress. For all assays except gene expression, a two-factor analysis of variance (ANOVA) was performed for the factors loading application (static vs. cyclic) and time (day 0 vs. 7). For gene expression, a three-factor ANOVA was performed for the factors loading application (static vs. cyclic), growth factor treatment (standard media vs. TGF-β3), and time (day 0 vs. 7). If the ANOVA was significant (i.e., p < 0.05) a Fisher's least squares differences test was performed to determine which specific statistical comparisons were significant. An α level <0.05 was considered statistically significant.
Results
Regions of compression and tension within CSCMs were both subjected to hydrostatic tension
The entire region of contact between CSCM and loading bar (equivalent to a tendon and bone) was subject to a compressive radial stress, a tensile tangential stress, and very low shear stresses for all conditions examined in numerical simulations (b/a = {1.05, 1.1, 1.2}; Eθ/Er = {1, 10, 100}; F/d sufficient for the loading bars to displace 0.02a, 0.04a, and 0.16a). The transition between tensile and compressive regions was very small, with the compressive radial stress fairly constant along the contact surface (Fig. 4). The transition region was never greater than 10°, and was lowest for low values of b/a, Eθ/Er, and F/d. The radial stress was zero where the CSCM lost contact with the loading bar. Outside the contact region the tensile tangential stress component increased in magnitude radially outward and was well approximated by Equation 8 for low values of b/a and F/d. All other stress components were zero.
FIG. 4.

The radial stress distribution along the contact surface as a function of angular (counterclockwise) position. The radial stress is negative (i.e., compressive) throughout the contact region. The compressive radial stress remains fairly constant along the contact surface. The compressive stress increases at the point where the collagen matrix begins to lose contact with the post. Finally, the radial stress goes to zero as the collagen matrix loses contact with the post. (a) Compressive stresses increased with specimen thickness (note: every 10th data point is plotted in (a)). The transition zone before the peak compressive stress was reached increased with specimen thickness. Results pictured are for an isotropic CSCM and loading bar displacement of 0.02a. (b) Anisotropy increased the angular width of the transition zone, but had little effect on the magnitude of the peak compressive stress. Results pictured are for b/a = 1.05, and Grθ/Eθ = 0.005.
The stress field was relatively insensitive to the value of Poisson's ratio assigned to the tendon. The effect of increasing Poisson's ratio from 0 was to increase the contact angle θc (Fig. 3b) as a result of greater Poisson contraction on the inner as opposed to outer face of the tendon. Poisson's ratio had no qualitative effect on the character of the stress field.
The analytical solution for the stress field within the region of contact showed that the maximum principal stress (σθ) within the contact region was tensile, whereas the minimum principal stress (σr) was compressive for all plausible specimen dimensions and moduli ratios (Fig. 5). The third principal stress was zero. The range of anisotropy shown on the abscissa of Figure 5 corresponds to CSCMs in vitro at the lower extreme and to tendons in vivo at the upper extreme. Neither stress component depended on the mechanical properties of the loading bar or Poisson's ratios of the CSCM. The hydrostatic pressure 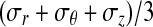 was tensile over the entire range of tendon geometries (b/a), supporting the hypothesis that only a single compressive stress component is needed for development of fibrocartilage.
FIG. 5.

The analytical stress field within the compressive zone plotted as a function of the degree of anisotropy. The range of anisotropy shown on the abscissa corresponds to the CSCMs in vitro on the lower extreme and to tendons in vivo on the upper extreme. Data are plotted for (b/a) = 1.2. Stress in the radial direction, shown by σrr, is always negative (i.e., compressive), whereas stress in the θ direction is always positive (i.e., tensile). The hydrostatic pressure predicted in the contact region of a wrap-around tendon is tensile, supporting the hypothesis that only a single compressive stress component is needed for a development of the fibrocartilage. Note that the hydrostatic stress is (σr + σθ + σz)/3, where σz ≈ 0. Labels B and C delineate stresses at the locations indicated on the schematic of the loading system.
Experimental results
Cells in the compressive region were rounder than cells in the tensile region (Figs. 2 and 6, Table 1). Cell shape factor was significantly lower (cells were more spindle shaped) in the tensile region of the cyclically loaded CSCMs compared with cells in all other groups (Fig. 6 and Table 1). Cells in the tensile region of the cyclically loaded CSCMs were also significantly more aligned compared with cells in all other groups (Figs. 2 and 7, Table 1). Cell alignment paralleled the direction of cyclic loading. There were no significant differences when comparing cell morphology of statically loaded CSCMs under compression to cell morphology of CSCMs under tension.
FIG. 6.

Kernel curve histograms for cell shape factor are shown for one representative cyclically loaded collagen matrix. Cells in the compressive region of the matrix were rounder than cells in the tensile region.
Table 1.
Cells in the Cyclic Tension Group Were Significantly Flatter and More Aligned Compared with All Other Groups (L = Length of Mean Vector, θ = Orientation of Mean Vector, Lcos2θ and Lsin2θ = Components of Mean Vector Used for Circular Statistics)
| Stress application | Stress mode | Cell shape factor | Mean vector length | Mean angle (degrees) | L*cos(2θ) | L*sin(2θ) | |
|---|---|---|---|---|---|---|---|
| Cyclic | Compressive | Average | 0.49 | 0.056 | 36.5 | 0.036 | 0.031 |
| SD | 0.14 | 0.066 | 0.024 | ||||
| Cyclic | Tensile | Average | 0.39a | 0.117 | 10.5 | 0.112a | 0.023 |
| SD | 0.11 | 0.095 | 0.011 | ||||
| Static | Compressive | Average | 0.44 | 0.065 | 27.2 | 0.048 | 0.031 |
| SD | 0.15 | 0.059 | 0.017 | ||||
| Static | Tensile | Average | 0.43 | 0.088 | 28.9 | 0.075 | 0.032 |
| SD | 0.16 | 0.100 | 0.022 |
For vector length (L) and orientation (θ), mean values reflect the mean vector computed from circular statistics (see text for details) rather than arithmetic means; for vector components arithmetic mean and standard deviations are shown.
p < 0.05 for cyclic tension group compared with all other groups (cyclic compression, static tension, and static compression).
SD, standard deviation.
FIG. 7.

Kernel curve histograms for cell orientation are shown for one representative cyclically loaded collagen matrix. Cells in the tensile region of the cyclically loaded matrix were more aligned compared to the cells in the compressive region. Cell alignment was centered around zero degrees, defined as the direction of cyclic loading.
GAPDH expression was stable across all groups and loading conditions, making it an appropriate choice for a housekeeping gene (Ct counts: cyclically loaded–tensile region = 16.2 ± 0.7, cyclically loaded–compressive region = 16.1 ± 0.7, statically loaded–tensile region = 16.5 ± 0.3, statically loaded–compressive region = 16.3 ± 0.5). In the absence of TGF-β3 supplementation, scleraxis and type I collagen mRNA expression levels were significantly higher in tensile regions of cyclically loaded CSCMs compared to compressive regions of cyclically loaded CSCMs (Fig. 8; 1.28-fold change for scleraxis and 1.22-fold change for type I collagen). Cyclic loading led to an upregulation of scleraxis relative to static loading for both tensile (3.45-fold change) and compressive (3.18-fold change) regions and to an upregulation of type I collagen (1.31-fold change) for the tensile region. Type I collagen was upregulated relative to time zero control CSCMs in all groups (2.17-fold change on average). Scleraxis was upregulated under cyclic loading (2.39-fold change in tensile and 1.87-fold change in compressive regions) and downregulated under static loading (0.59-fold change in compressive regions) relative to time zero control CSCMs. In the absence of TGF-β3 supplementation, aggrecan mRNA expression was significantly higher in the tensile region of the cyclically loaded CSCMs compared to the compressive region of the cyclically loaded CSCMs (Fig. 8; 1.27-fold change). Cyclic loading led to a 4.25-fold upregulation of aggrecan, on average, relative to static loading. Aggrecan expression in the cyclically loaded CSCMs was upregulated relative to time zero control CSCMs (3.4-fold change on average). mRNA expression of Sox9 was not significantly changed when comparing loading mode (cyclic vs. static) or direction (tensile vs. compressive). Sox9 expression was significantly decreased in the cyclically compressed group at 7 days compared to the time zero control group (0.75-fold change). TGF-β3 led to upregulation of aggrecan and downregulation of scleraxis relative to control media at 0 (6.15-fold change for aggrecan and 0.023-fold change for scleraxis, on average) or 7 (2.93-fold change for aggrecan and 0.017-fold change for scleraxis, on average) days (Fig. 8). TGF-β3 did not lead to any significant changes in collagen I expression relative to control media. Sox9 expression was significantly higher in statically loaded CSCMs treated with TGF-β3 compared to cyclically loaded CSCMs treated with TGF-β3 (3.13-fold change on average).
FIG. 8.

Scleraxis and collagen I mRNA expression levels were significantly higher in the tensile region (T) of the cyclically loaded CSCMs compared to the compressive region (C). Cyclic loading led to an upregulation of both Scleraxis and Collagen I relative to static loading. Both tendon-specific genes were upregulated relative to time zero control CSCMs (CTL). Scleraxis was significantly downregulated due to TGF-β3. Aggrecan and Sox9 expression was significantly upregulated due to TGF-β3 relative to time zero and control media CSCMs (#p < 0.05 for comparisons under the bars, *p < 0.05 compared to CTL, &p < 0.05 Static vs. Cyclic). TGF-β3, transforming growth factor beta3.
The chondrogenic growth factor TGF-β3 promoted higher collagen II production compared to control media (Fig. 9). Static compressive loading promoted higher collagen II production compared to static tensile loading. There was little apparent collagen II staining in samples that were cyclically loaded in control media. However, there was a high level of collagen II staining in samples that were cyclically loaded in TGF-β3 media. There was no apparent staining for collagen II on the negative control sections (data not shown).
FIG. 9.

Immunohistochemistry results for type II collagen (cell nuclei shown in blue; type II collagen shown in green; 40× objective; scale bar = 100 μm). Color images available online at www.liebertonline.com/tea.
Discussion
Our modeling and experimental results support the idea that the three-dimensional (3D) stress environment influences cell activity. In this system with uniformly tensile hydrostatic stress, both the stress application (cyclic vs. static) and the stress mode (tensile vs. compressive, as defined by our mechanical modeling), had an effect on cell morphology and gene expression. Cells loaded in tension were flatter and more aligned than cells loaded in compression. Cells that were cyclically loaded expressed higher scleraxis, collagen, and aggrecan mRNA levels than cells that were statically loaded. Cartilage-specific expression was observed only when the chondrogeneic growth factor TGF-β3 was added, suggesting that biologic factors are necessary to promote chondrocyte differentiation. These conclusions are relevant to design of bioreactors for tissue engineering.
The response to loading of tendons, ligaments, and their bony insertions has been evaluated in vivo7,9,33 and in vitro.11,34 In vivo, increased loading (e.g., through exercise) leads to improvements in strength and stiffness, whereas a decrease in loading (e.g., through immobilization) leads to a dramatic decreases.27,33 Compressive loads in vivo have been shown to change tendon composition and structure to a more fibrocartilaginous and disorganized morphology.7–11 This can be seen most clearly where tendons wrap around bony pulleys, where aggrecan, a proteoglycan found in articular cartilage and thought to provide tissues with compressive resilience, is found.9,35 Cyclic loading is necessary for ligament explants to maintain mechanical properties in vitro.34 Static loading, however, either decreases or causes no change in mechanical properties in several tissues.33 The mechanisms for these responses are unclear. However, structural and compositional changes associated with mechanically induced remodeling of collagen and matrix components are likely involved. The loading application (cyclic vs. static), magnitude, and mode (tensile vs. compressive), have a significant effect on the properties of tendon, ligament, and their insertions. Our in vitro results are consistent with this prior literature.
Effects of uniaxial tension and compression on differentiation and function of MSCs has been examined previously: uniaxial or biaxial tension leads to differentiation and cell function representative of tendon,36 whereas uniaxial compression leads to differentiation and cell function representative of cartilage.37 In the tendon-to-bone insertion, however, the stress field is much more complicated,5 and multiaxial effects become important.
Estimates of the effect of multiaxial stress state on cellular morphology are available from the work of Matyas et al.18 This study correlated a plane stress, linear elastic estimate of a quasistatic stress field at the medial collateral ligament-to-bone insertion site in mature rabbits, with cell shape. Rounded cell morphology was seen in regions containing a single compressive principal stress component, and in those where the hydrostatic stress was compressive. The roundest cells appeared where compressive principal compressive stress was highest, and the flattest cells where this was lowest. While comparison to these results is difficult because of their two-dimensional estimates of a 3D stress field, our results are consistent with theirs. Cells in compressive regions of our CSCMs were rounder than cells in tensile regions; cells in the tensile region aligned with the direction of tension, whereas cells in the compressive region had a random orientation. Matyas et al. theorized that cells at the ligament insertion adapt to the prevailing local mechanical environment. Our study augments this theory by showing that these effects persist in the presence of tensile hydrostatic stress. Cells in our in vitro model responded to their mechanical environment by changing their morphology and gene expression within 7 days of load application. Understanding the role of the 3D stress environment on fibrocartilage development will help us engineer fibrocartilaginous tissue replacements for use in meniscus and tendon/ligament-to-bone repair.
The mechanical modeling in this article illustrates that the stress field along regions of a wrap-around tendon that contain proteoglycans has a compressive radial stress component. The hydrostatic pressure predicted at the apex of a wrap-around tendon, on the other hand, is tensile. Since viscoelastic relaxation was neglected, solutions were rigorous only for the statically loaded controls. Viscoelasticity would affect the magnitude but not the sign (tension vs. compression) of the stress field in our in vitro system during cyclic loading. Within these limitations, results suggest that only a single compressive stress component is needed for fibrocartilage development. However, experimental results indicate a role for hydrostatic compression in the enhancement of matrix synthesis relevant to fibrocartilage.38
Our experimental results supported the initial hypothesis with regard to the fibrous components of fibrocartilage but did not support our hypothesis with regard to the cartilaginous components of fibrocartilage. Consistent with reports in the literature,16,36 production of fibrous collagenous matrix and changes in cell shape and orientation into a tendon fibroblast morphology was enhanced by both the dynamic and the tensile aspects of loading. In contrast, we did not see many changes in Sox9 expression or aggrecan expression due to loading. Previous groups have demonstrated that regions of tendon under compression contain aggrecan and tensile regions of fetal tendon explants loaded in compression in vitro produce aggrecan.7–11 Aside from the effect of hydrostatic tension, a number of possible explanations exist for the lack of chondrocyte differentiation or proteoglycan expression in our study. First, the culture duration may have been too short to allow for differentiation of the MSCs into fibrochondrocytes capable of producing aggrecan. However, others showed that aggrecan mRNA expression is upregulated after only 3 days of compressive loading of cultured fetal tendon explants.39 Second, biologic factors in combination with compressive loading may be necessary to get significant upregulation of cartilage specific genes. Aggrecan and Sox9 gene expression was significantly upregulated in the current study with TGF-β3 supplementation and scleraxis expression was dramatically downregulated. Further, immunohistochemical analysis indicated that collagen II production was increased due to the growth factor. These data demonstrate the importance of biologic factors for chondrogenesis. This is consistent with other reports that have shown that the expression of matrix genes can be dramatically upregulated when mechanical loading is combined with growth factor stimulation.40,41 Third, our levels of compressive and/or hydrostatic stress may not have been high enough to stimulate aggrecan expression. The modulus of our CSCMs was significantly lower than that of normal tendon. Therefore, stresses applied to the cells within the matrix were significantly lower than physiologic stresses in adult tissues. Fourth, the matrix used in our study was type I collagen (the major extracellular matrix component of tendon), which may have predisposed cells toward tenogenesis over chondrogenesis. This may explain why there was no downregulation of type I collagen with the addition of the chondrogenic factor TGF-β3. Finally, co-culture studies have demonstrated the importance of fibroblast-osteoblast and/or chondrocyte–osteoblast interactions for the formation of interfacial tissues.42,43 These interactions would be missing from our bioreactor until MSCs fully differentiated into different cell types.
A number of our results warrant further study. There were no significant differences when comparing cell morphology of statistically loaded CSCMs under compression to cell morphology of CSCMs under tension. The lack of differences between these two groups is likely due to the static loading condition. In our study, cyclic load was necessary to promote a change to a fibrochondrocyte cell morphology. Scleraxis was upregulated under cyclic loading and downregulated under static loading relative to time zero control. As has been shown by others, cyclic loading of tendon constructs is necessary to maintain expression of tendon related genes and prevent upregulation of matrix degradation enzymes.16,34,44 These reports are consistent with the changes we observed. Sox9 expression decreased significantly in the cyclically compressed group at 7 days compared to the time zero control group. This was a surprising result that may be explained by the tight temporal regulation of the gene. This factor is likely upregulated early and downregulated late during the process of chondrocyte differentiation.45 This speculation, however, could not be verified in our study, as we only examined gene expression at 0 and 7 days.
In the current study, only four genes and one protein were examined at a single timepoint. Examination of additional chondrogenenic and tenogenenic factors could elucidate the relationships between the stress environment and stem cell differentiation. Future experiments will examine additional genes related to tenogenesis and chondrogenesis and will also examine osteogenesis related genes. Examination of temporal changes in gene expression could also help define the differentiation process, as transcription factors (e.g., scleraxis and Sox9) are likely expressed sooner than extracellular matrix genes (e.g., collagen I, collagen II, and aggrecan) during differentiation. The current study focuses on modeling the multiaxial stress environment and on a first pass at relating this three dimensional tensorial stress environment to fibrocartilage formation. Additional studies are necessary to examine localized gene and protein expression and to correlate that expression with the local stress environment. Our study did not include a true unloaded control (i.e., static loading was compared to cyclic loading). We note that this control is not meaningful in collagen matrix studies, as cells will contract the matrix if left unconstratined. While true unloading is not possible, we were able to compare static to cyclic loading. Compressive mechanical were mildly stimulatory of fibrocartilage differentiation; the effect, however, was not substantial without TGF-β supplementation. Tensile mechanical cues, on the other hand, clearly promoted tenogenesis. Further, the type of mechanical cue was of critical importance. Compression promoted more fibrocartilage than tension and cyclic loading promoted more fibrocartilage than static loading.
Understanding the role of the stress environment on cell activity is critical for tissue engineering of fibrocartilaginous (e.g., meniscus) and transitional tissues (e.g., tendon-to-bone insertion). We found that cyclic compression plus TGF-β supplementation resulted in cartilage formation and cyclic tension in the absence of TGF-β supplementation resulted in tendon formation. Our in vitro system produces regions in each CSCM loaded in compression and separate regions in the same CSCM loaded in tension. This system will be useful for engineering materials with gradations in extracellular matrix components and mechanical properties, especially if the system is modified to allow prescription of the hydrostatic pressure field. The approach presented here may be combined in future studies with scaffolds that contain gradients in mineral,46 localized gene transfection,47 or co-culture methods42,43,48 to generate a mineral gradient in addition to a fibrocartilage gradient. These functionally graded materials would be clinically useful for tendon- or ligament-to-bone repairs, where a two order of magnitude modulus mismatch exists between the two materials being repaired.
Appendices
APPENDIX A
Analytical Model
Governing equations
The tendon and bone were modeled as specially orthotropic with the orthotropy axes oriented in the circumferential and radial directions. Accordingly, their constitutive equations are:
 |
(A1) |
where σ and τ are linearized stress, ɛ and γ are linearized engineering strain, amn are material compliance constants, and i = t, b refer to the tendon and bone, respectively. For the case of plane stress prevailing in the tendon, amn can be written in terms of standard engineering constants1:
 |
(A2) |
where 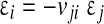 (no summation) for uniaxial straining in the j direction. The out-of-plane strain is
For the case of plane strain assumed in the bone, the compliance coefficients aij in A1 must be replaced with the constants βij as follows:
 |
(A3) |
where
 |
(A4) |
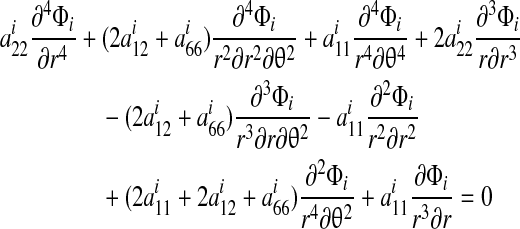
The problem is solved in terms of stress functions  that satisfy identically the equations of motion:
 |
(A5) |
Combining these with the constitutive relations and the planar strain compatibility condition yields the governing equations2:
 |
(A6) |
where for the tendon i = t, and for the bone i = b and the aij must be replaced with βij.
The strains are related to radial (u) and tangential (w) displacements by the following relationships:
 |
(A7) |
Solution procedure
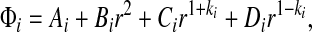
If the interfacial tendon–bone shear stress can be neglected and the tendon is thin, the radial and tangential stresses become independent of the circumferential coordinate except in the vicinity of the point at which contact between tendon and bone is lost, and the problem becomes axisymmetric over the remainder of the region. For such cases, the stress function that satisfies the boundary conditions is2:
 |
(A8) |
where Ai, Bi Ci and Di are constants of integration, and
 |
(A9) |
for the case of plane stress. For the case of plane strain relevant to the bone, 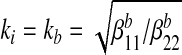 .
.
The constants Ai do not affect the stresses in the tendon and bone. As shown in Appendix B, the constants Bi must be zero to enforce the condition that the tangential displacements uθ of all points must be single-valued. The four remaining constants of integration must be determined from the boundary and continuity conditions for the radial displacement and the radial stress:
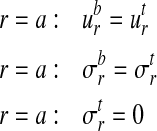 |
(A10) |
Note that the formulation is not valid at r = 0 due to the cylindrical orthotropy assumed for the bone.2 The solution is valid at the tendon–bone interface since it lies a sufficient distance from this pole.
The fourth condition necessary to specify the constants of integration is derived from a force balance in Fig. 3, which relates the average circumferential stress  in the tendon to the applied force, F:
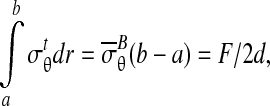 |
(A11) |
where d is the width of the tendon (into-the-page dimension in Fig. 3).
Radial displacement and stress can be evaluated in terms of the constants of integration:
 |
(A12) |
Then, the conditions (A10) and (A11) yield four algebraic equations for Ci and Di:
 |
(A13) |
 |
(A14) |
 |
(A15) |
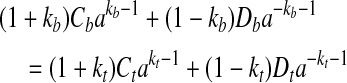 |
(A16) |
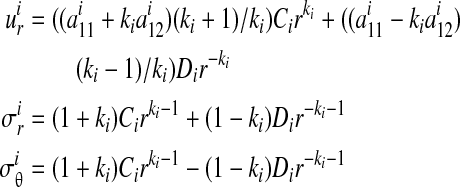
The solution yields the stresses in the tendon that may be written in the form:
 |
(A17) |
The stresses in the bone may be written as:
 |
(A18) |
This solution could also be deduced from shrink-fit analysis,3 using the solutions given by Lekhnitskii2 for stresses in a composite curvilinear anisotropic ring. Note that this solution allows singularities and material interpenetration within the bone for certain values of kb. A discussion of this can be found in Fosdick and Royer-Carfagni.4
Appendix B
Illustration that the condition that displacements must be single-valued in θ eliminates the constant Bi from the stress function (A8)
The radial strain field can be obtained from Equations (A1), (A5), (A7), and (A8):
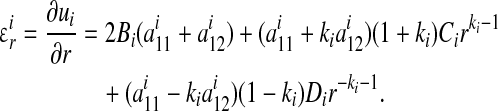 |
(B1) |
This yields
 |
(B2) |
where f (θ) must be a periodic function that is single-valued in θ.
Similarly, the tangential strain field can be written as
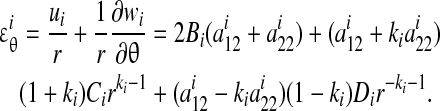 |
(B3) |
Solving for the radial displacement:
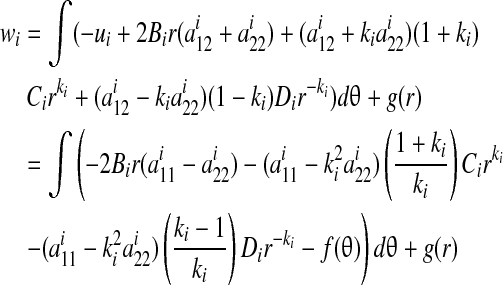 |
(B4) |
where g(r) is single-valued in r. Since  , this yields:
 |
(B5) |
Since wi must be single-valued in θ +2nπ for all values of r, each term in this equation must be zero independently, requiring that Bi = 0 in an axisymmetric problem.
Appendix References
- 1.Jones R.M. Mechanics of Composite Materials. Philadelphia: Taylor & Francis, Inc; 1999. [Google Scholar]
- 2.Lekhnitskii S.G. Anisotropic Plates. New York: Gordon and Breach; 1968. [Google Scholar]
- 3.Saada A.S. Elasticity: Theory and Applications. Melbourne, FL: Krieger Publishing; 1993. [Google Scholar]
- 4.Fosdick R. Royer-Carfagni G. The constraint of local injectivity in linear elasticity theory. Proc R Soc Lond A. 2001;457:2167. [Google Scholar]
Acknowledgments
This work was funded in part by the Center for Materials Innovation at Washington University and by the NIH through grants EB004347, AR055184, and HL079165. The authors thank Chanteak Lim for performing part of the gene expression analysis.
Disclosure Statement
No competing financial interests exist.
References
- 1.Praemer A. Furner S. Rice D. Musculoskeletal Conditions in the US. Park Ridge, IL: American Academy of Orthopaedic Surgeons; 1992. [Google Scholar]
- 2.Rodeo S.A. Arnoczky S.P. Torzilli P.A. Hidaka C. Warren R.F. Tendon-healing in a bone tunnel. A biomechanical and histological study in the dog. J Bone Joint Surg Am. 1993;75:1795. doi: 10.2106/00004623-199312000-00009. [DOI] [PubMed] [Google Scholar]
- 3.McAndrews P.T. Arnoczky S.P. Meniscal repair enhancement techniques. Clin Sports Med. 1996;15:499. [PubMed] [Google Scholar]
- 4.Thomopoulos S. Williams G.R. Soslowsky L.J. Tendon to bone healing: differences in biomechanical, structural, and compositional properties due to a range of activity levels. J Biomech Eng. 2003;125:106. doi: 10.1115/1.1536660. [DOI] [PubMed] [Google Scholar]
- 5.Thomopoulos S. Marquez J.P. Weinberger B. Birman V. Genin G.M. Collagen fiber orientation at the tendon to bone insertion and its influence on stress concentrations. J Biomech. 2006;39:1842. doi: 10.1016/j.jbiomech.2005.05.021. [DOI] [PubMed] [Google Scholar]
- 6.Benjamin M. Kumai T. Milz S. Boszczyk B.M. Boszczyk A.A. Ralphs J.R. The skeletal attachment of tendons—tendon “entheses”. Comp Biochem Physiol A Mol Integr Physiol. 2002;133:931. doi: 10.1016/s1095-6433(02)00138-1. [DOI] [PubMed] [Google Scholar]
- 7.Benjamin M. Ralphs J.R. Fibrocartilage in tendons and ligaments—an adaptation to compressive load. J Anat. 1998;193(Pt 4):481. doi: 10.1046/j.1469-7580.1998.19340481.x. [DOI] [PMC free article] [PubMed] [Google Scholar]
- 8.Spalazzi J.P. Vyner M.C. Jacobs M.T. Moffat K.L. Lu H.H. Mechanoactive scaffold induces tendon remodeling and expression of fibrocartilage markers. Clin Orthop Relat Res. 2008;466:1938. doi: 10.1007/s11999-008-0310-8. [DOI] [PMC free article] [PubMed] [Google Scholar]
- 9.Vogel K.G. Ordog A. Pogany G. Olah J. Proteoglycans in the compressed region of human tibialis posterior tendon and in ligaments. J Orthop Res. 1993;11:68. doi: 10.1002/jor.1100110109. [DOI] [PubMed] [Google Scholar]
- 10.Koob T.J. Clark P.E. Hernandez D.J. Thurmond F.A. Vogel K.G. Compression loading in vitro regulates proteoglycan synthesis by tendon fibrocartilage. Arch Biochem Biophys. 1992;298:303. doi: 10.1016/0003-9861(92)90127-i. [DOI] [PubMed] [Google Scholar]
- 11.Koob T.J. Vogel K.G. Proteoglycan synthesis in organ cultures from regions of bovine tendon subjected to different mechanical forces. Biochem J. 1987;246:589. doi: 10.1042/bj2460589. [DOI] [PMC free article] [PubMed] [Google Scholar]
- 12.Hung C.T. Mauck R.L. Wang C.C. Lima E.G. Ateshian G.A. A paradigm for functional tissue engineering of articular cartilage via applied physiologic deformational loading. Ann Biomed Eng. 2004;32:35. doi: 10.1023/b:abme.0000007789.99565.42. [DOI] [PubMed] [Google Scholar]
- 13.Wille J.J. Elson E.L. Okamoto R.J. Cellular and matrix mechanics of bioartificial tissues during continuous cyclic stretch. Ann Biomed Eng. 2006;34:1678. doi: 10.1007/s10439-006-9153-1. [DOI] [PMC free article] [PubMed] [Google Scholar]
- 14.Lima E.G. Bian L. Ng K.W. Mauck R.L. Byers B.A. Tuan R.S. Ateshian G.A. Hung C.T. The beneficial effect of delayed compressive loading on tissue-engineered cartilage constructs cultured with TGF-beta3. Osteoarthritis Cartilage. 2007;15:1025. doi: 10.1016/j.joca.2007.03.008. [DOI] [PMC free article] [PubMed] [Google Scholar]
- 15.Rich J.T. Rosova I. Nolta J.A. Myckatyn T.M. Sandell L.J. McAlinden A. Upregulation of Runx2 and Osterix during in vitro chondrogenesis of human adipose-derived stromal cells. Biochem Biophys Res Commun. 2008;372:230. doi: 10.1016/j.bbrc.2008.05.022. [DOI] [PMC free article] [PubMed] [Google Scholar]
- 16.Kuo C.K. Tuan R.S. Mechanoactive tenogenic differentiation of human mesenchymal stem cells. Tissue Eng Part A. 2008;14:1615. doi: 10.1089/ten.tea.2006.0415. [DOI] [PubMed] [Google Scholar]
- 17.Nekouzadeh A. Genin G.M. Bayly P.V. Elson E.L. Wave motion in relaxation-testing of nonlinear elastic media. Proc R Soc Lond A. 2005;461:1599. [Google Scholar]
- 18.Matyas J.R. Anton M.G. Shrive N.G. Frank C.B. Stress governs tissue phenotype at the femoral insertion of the rabbit MCL [see comments] J Biomech. 1995;28:147. doi: 10.1016/0021-9290(94)00058-c. [DOI] [PubMed] [Google Scholar]
- 19.Gurtin M.E. Fried E. Anand L. The Mechanics and Thermodynamics of Continua. Cambridge: Cambridge University Press; 2010. [Google Scholar]
- 20.Prager W. On the formulation of constitutive equations for living soft tissues. Appl Math. 1969;27:128. [Google Scholar]
- 21.Comsol I. Burlington: Comsol, Inc; 2007. Comsol Multiphysics Version 3.4 Structural Mechanics Module User's Guide. [Google Scholar]
- 22.Genin G.M. Hutchinson J.W. Failures at attachment holes in brittle matrix laminates. J Composite Mater. 1999;33:1600. [Google Scholar]
- 23.Nekouzadeh A. Pryse K.M. Elson E.L. Genin G.M. A simplified approach to quasi-linear viscoelastic modeling. J Biomech. 2007;40:3070. doi: 10.1016/j.jbiomech.2007.03.019. [DOI] [PMC free article] [PubMed] [Google Scholar]
- 24.Marquez J.P. Genin G.M. Pryse K.M. Elson E.L. Cellular and matrix contributions to tissue construct stiffness increase with cellular concentration. Ann Biomed Eng. 2006;34:1475. doi: 10.1007/s10439-006-9160-2. [DOI] [PMC free article] [PubMed] [Google Scholar]
- 25.Pryse K.M. Nekouzadeh A. Genin G.M. Elson E.L. Zahalak G.I. Incremental mechanics of collagen gels: new experiments and a new viscoelastic model. Ann Biomed Eng. 2003;31:1287. doi: 10.1114/1.1615571. [DOI] [PubMed] [Google Scholar]
- 26.Jones R.M. Mechanics of Composite Materials. Philadelphia: Taylor & Francis, Inc; 1999. [Google Scholar]
- 27.Woo S.L. An K. Frank C.B. Livesay G.A. Ma C.B. Zeminski J.A. Wayne J.S. Myers B.S. Anatomy, biology, and biomechanics of tendon and ligament. In: Buckwalter J.A., editor; Einhorn T.A., editor; Simon S.R., editor. Orthopaedic Basic Science. Rosemont, IL: AAOS; 2000. pp. 581–616. [Google Scholar]
- 28.Bostrom M.P.G. Boskey A. Kauffman J.K. Einhorn T.A. Form and function of bone. In: Buckwalter J.A., editor; Einhorn T.A., editor; Simon S.R., editor. Orthopaedic Basic Science. Rosement, IL: AAOS; 2000. pp. 319–370. [Google Scholar]
- 29.Karlon W.J. Hsu P.P. Li S. Chien S. McCulloch A.D. Omens J.H. Measurement of orientation and distribution of cellular alignment and cytoskeletal organization. Ann Biomed Eng. 1999;27:712. doi: 10.1114/1.226. [DOI] [PubMed] [Google Scholar]
- 30.Thomopoulos S. Fomovsky G.M. Holmes J.W. The development of structural and mechanical anisotropy in fibroblast populated collagen gels. J Biomech Eng. 2005;127:742. doi: 10.1115/1.1992525. [DOI] [PubMed] [Google Scholar]
- 31.Batschelet E. Circular Statistics in Biology. London: Academic Press; 1981. [Google Scholar]
- 32.Reno C. Marchuk L. Sciore P. Frank C.B. Hart D.A. Rapid isolation of total RNA from small samples of hypocellular, dense connective tissues. Biotechniques. 1997;22:1082. doi: 10.2144/97226bm16. [DOI] [PubMed] [Google Scholar]
- 33.Woo S.L. Gomez M.A. Sites T.J. Newton P.O. Orlando C.A. Akeson W.H. The biomechanical and morphological changes in the medial collateral ligament of the rabbit after immobilization and remobilization. J Bone Joint Surg Am. 1987;69:1200. [PubMed] [Google Scholar]
- 34.Hannafin J.A. Arnoczky S.P. Hoonjan A. Torzilli P.A. Effect of stress deprivation and cyclic tensile loading on the material and morphologic properties of canine flexor digitorum profundus tendon: an in vitro study. J Orthop Res. 1995;13:907. doi: 10.1002/jor.1100130615. [DOI] [PubMed] [Google Scholar]
- 35.Mow V.C. Ratcliffe A. Structure and function of articular cartilage and meniscus. In: Mow V.C., editor; Hayes W.C., editor. Basic Orthopaedic Biomechanics. Philadelphia: Lippincott-Raven; 1997. pp. 113–177. [Google Scholar]
- 36.Butler D.L. Juncosa-Melvin N. Boivin G.P. Galloway M.T. Shearn J.T. Gooch C. Awad H. Functional tissue engineering for tendon repair: a multidisciplinary strategy using mesenchymal stem cells, bioscaffolds, and mechanical stimulation. J Orthop Res. 2008;26:1. doi: 10.1002/jor.20456. [DOI] [PubMed] [Google Scholar]
- 37.Mauck R.L. Byers B.A. Yuan X. Tuan R.S. Regulation of cartilaginous ECM gene transcription by chondrocytes and MSCs in 3D culture in response to dynamic loading. Biomech Model Mechanobiol. 2007;6:113. doi: 10.1007/s10237-006-0042-1. [DOI] [PubMed] [Google Scholar]
- 38.Reza A.T. Nicoll S.B. Hydrostatic pressure differentially regulates outer and inner annulus fibrosus cell matrix production in 3D scaffolds. Ann Biomed Eng. 2008;36:204. doi: 10.1007/s10439-007-9407-6. [DOI] [PubMed] [Google Scholar]
- 39.Evanko S.P. Vogel K.G. Proteoglycan synthesis in fetal tendon is differentially regulated by cyclic compression in vitro. Arch Biochem Biophys. 1993;307:153. doi: 10.1006/abbi.1993.1574. [DOI] [PubMed] [Google Scholar]
- 40.Mauck R.L. Nicoll S.B. Seyhan S.L. Ateshian G.A. Hung C.T. Synergistic action of growth factors and dynamic loading for articular cartilage tissue engineering. Tissue Eng. 2003;9:597. doi: 10.1089/107632703768247304. [DOI] [PubMed] [Google Scholar]
- 41.Robbins J.R. Evanko S.P. Vogel K.G. Mechanical loading and TGF-beta regulate proteoglycan synthesis in tendon. Arch Biochem Biophys. 1997;342:203. doi: 10.1006/abbi.1997.0102. [DOI] [PubMed] [Google Scholar]
- 42.Spalazzi J.P. Doty S.B. Moffat K.L. Levine W.N. Lu H.H. Development of controlled matrix heterogeneity on a triphasic scaffold for orthopedic interface tissue engineering. Tissue Eng. 2006;12:3497. doi: 10.1089/ten.2006.12.3497. [DOI] [PubMed] [Google Scholar]
- 43.Jiang J. Nicoll S.B. Lu H.H. Co-culture of osteoblasts and chondrocytes modulates cellular differentiation in vitro. Biochem Biophys Res Commun. 2005;338:762. doi: 10.1016/j.bbrc.2005.10.025. [DOI] [PubMed] [Google Scholar]
- 44.Arnoczky S.P. Tian T. Lavagnino M. Gardner K. Schuler P. Morse P. Activation of stress-activated protein kinases (SAPK) in tendon cells following cyclic strain: the effects of strain frequency, strain magnitude, and cytosolic calcium. J Orthop Res. 2002;20:947. doi: 10.1016/S0736-0266(02)00038-4. [DOI] [PubMed] [Google Scholar]
- 45.Akiyama H. Control of chondrogenesis by the transcription factor Sox9. Mod Rheumatol. 2008;18:213. doi: 10.1007/s10165-008-0048-x. [DOI] [PubMed] [Google Scholar]
- 46.Li X. Xie J. Lipner J. Yuan X. Thomopoulos S. Xia Y. Nanofiber scaffolds with gradations in mineral content for mimicking the tendon-to-bone insertion site. Nano Lett. 2009;9:2763. doi: 10.1021/nl901582f. [DOI] [PMC free article] [PubMed] [Google Scholar]
- 47.Phillips J.E. Burns K.L. Le Doux J.M. Guldberg R.E. Garcia A.J. Engineering graded tissue interfaces. Proc Natl Acad Sci USA. 2008;105:12170. doi: 10.1073/pnas.0801988105. [DOI] [PMC free article] [PubMed] [Google Scholar]
- 48.Wang I.N. Shan J. Choi R. Oh S. Kepler C.K. Chen F.H. Lu H.H. Role of osteoblast-fibroblast interactions in the formation of the ligament-to-bone interface. J Orthop Res. 2007;25:1609. doi: 10.1002/jor.20475. [DOI] [PubMed] [Google Scholar]