

Abstract
Context: Twenty-five years ago, private insurance plans were introduced into the Medicare program with the stated dual aims of (1) giving beneficiaries a choice of health insurance plans beyond the fee-for-service Medicare program and (2) transferring to the Medicare program the efficiencies and cost savings achieved by managed care in the private sector.
Methods: In this article we review the economic history of Medicare Part C, known today as Medicare Advantage, focusing on the impact of major changes in the program's structure and of plan payment methods on trends in the availability of private plans, plan enrollment, and Medicare spending. Additionally, we compare the experience of Medicare Advantage and of employer-sponsored health insurance with managed care over the same time period.
Findings: Beneficiaries' access to private plans has been inconsistent over the program's history, with higher plan payments resulting in greater choice and enrollment and vice versa. But Medicare Advantage generally has cost more than the traditional Medicare program, an overpayment that has increased in recent years.
Conclusions: Major changes in Medicare Advantage's payment rules are needed in order to simultaneously encourage the participation of private plans, the provision of high-quality care, and to save Medicare money.
Keywords: Medicare, managed care, health care costs
The Medicare Advantage (MA) program, formally Part C of Medicare, originated with the Tax Equity and Fiscal Responsibility Act (TEFRA), which authorized Medicare to contract with risk-based private health plans, or those plans that accept full responsibility (i.e., risk) for the costs of their enrollees' care in exchange for a prospective, monthly, per-enrollee payment. This program has been called a variety of names over the past three decades (e.g., Medicare Advantage, Medicare+Choice). In this article, we refer to the program by both its current names, Part C and Medicare Advantage (MA). TEFRA was passed in 1982, and the rules to implement risk-based contracting were completed in 1985. Those beneficiaries who choose to enroll in an MA plan continue to pay, directly to Medicare, their required Part B premium for physicians' services and, if they elect it, their Part D premium for drug coverage. In return, they receive health insurance for all services through (and may pay supplemental premiums to) their MA plan. For these beneficiaries, enrollment in an MA plan replaces not only traditional Medicare but also a Medicare supplemental insurance policy (i.e., Medigap). The MA plans themselves receive, directly from the Medicare program, a predetermined, monthly, risk-adjusted payment to cover each beneficiary's care. (Later we will describe in detail the beneficiaries' enrollment decisions and plan payment.)
Over the past twenty-five years the MA program has pursued two stated goals. The first is to expand Medicare beneficiaries' choices to include private plans with coordinated care and more comprehensive benefits than those provided through traditional Medicare (TM) (MedPAC 2001, chap. 7). The second is to take advantage of efficiencies in managed care and save Medicare money (Prospective Payment Assessment Commission 1997, chap. 3).
Reducing Medicare program or on-budget spending is different from reducing economists' notion of social cost, which reflects the opportunity cost of the resources actually used for medical care. Although we focus here primarily on the perspective of the budget, we believe that there is a third goal, which is related to the economists' social cost concept: to minimize the inefficiencies induced by the inevitable errors in TM's administered price system, by allowing the health plans and providers to negotiate prices or, in some cases, to integrate the finance and delivery functions. An example is a group or staff model Health Maintenance Organization (HMO).
On first glance, the two stated goals appear to be at odds with each other. An obvious way to increase access to MA plans would be for Medicare to increase the plan payments, thereby making it more attractive for plans to enter the Medicare market. But doing so would contradict efforts to save Medicare money. In principle, however, it is possible to attain both stated goals (as opposed to having no MA program). Traditional Medicare (TM), which consists of Part A (mainly hospital insurance), Part B (mainly physician services), and, as of 2006, Part D (prescription drug coverage) is on an unsustainable cost path, due in part to pricing errors that make certain services or sites of care either profitable (provide economic rents) or unprofitable (Ginsburg and Grossman 2005; Newhouse 2002) and in part to utilization induced by supplemental insurance coverage from former employers or purchased individually (MedPAC 2010b). Including the 16 percent of those Medicare beneficiaries also eligible for Medicaid, who cannot realistically afford the amount of cost sharing in TM, such supplemental coverage is held by the majority of beneficiaries (Atherly 2001; Christensen, Long, and Rodgers 1987; Dowd et al. 1992). Furthermore, TM's fee-based physician payments, which are based on volume and hospital payments based on admissions, accommodate variations in provider practice patterns, in turn absolving providers from pressure to restrain overuse. Geographic variations in utilization and quality create business opportunities in places like south Florida (one of the highest per-capita TM spending regions in the United States), where private managed care plans ought to be able to expand choice to beneficiaries and to provide care that is just as good as or better than TM for less money (Dartmouth Medical School 1999; Fisher et al. 2003a, 2003b). If the MA program induced the plans to enter the right markets and the right beneficiaries to choose those plans, creating choice for the beneficiaries could save Medicare money and achieve both stated goals of the Part C program.
To satisfy both of these goals, however, Part C's payment rules would need to thread a policy needle: The plans would have to be paid enough by Medicare and by the plan enrollees to make a profit sufficient to justify their participation and to offer care that satisfied regulatory requirements. At the same time, they would have to keep the beneficiaries' premiums and cost sharing low enough or to offer enough additional services to attract beneficiaries from TM. In addition, Medicare would have to pay less than it would if the beneficiaries who enrolled remained in TM, or Medicare would not save money.
How have things gone? So far, not so well. Over more than twenty-five years, as Medicare policymakers have attempted to meet both the policy's challenges and their own political objectives, Medicare has not been able to find payment rules that simultaneously expand beneficiaries' choices and save Medicare program funds. As the 2010 debate on health reform showed, in the years since the 2003 Medicare Modernization Act (MMA) was enacted, MA plans have been generously paid, resulting in expanded choice and enrollment (achieving the first goal), but costing Medicare more money than TM, an estimated $14 billion more in 2009 (and thus failing on the second goal). As the June 2007 Report to Congress of the Medicare Payment Advisory Commission (MedPAC) explained, “Current MA payment policy is inconsistent with MedPAC's principles of payment equity between MA and the traditional FFS program” (MedPAC 2007, xii). This “overpayment” to MA plans will be substantially reduced by the 2010 Patient Protection and Affordable Care Act (P.L. 111–148, or ACA), with new MA payment rules that freeze MA plan payments for 2011 and further reduce MA spending in 2012 and 2013. As a result, the Congressional Budget Office (CBO) projects that MA's enrollments will fall each year until 2017 (CBO 2010).
Medicare's policy failure is not new, and in this article we start at the beginning to put the current policy in context. In 1972 Congress first authorized capitation payments for services covered under Parts A and B. But no action was taken until 1976, when Medicare began to field demonstration projects that contracted with HMOs to provide care for Medicare beneficiaries in exchange for prospective payments. In the 1970s and early 1980s these demonstration HMOs provided some of the first evidence of managed care's potential savings by reducing the number of Medicare beneficiaries' inpatient hospitalizations by 8 percent over two years. But these demonstration projects also showed danger signs of favorable selection into managed care plans. That is, in the two years preceding enrollment in a Medicare demonstration HMO, the average demographically adjusted Medicare reimbursement per enrollee was 21 percent lower for those beneficiaries who enrolled in the Medicare demonstration HMOs than for those beneficiaries who did not (Eggers 1980; Eggers and Prihoda 1982; Langwell and Hadley 1989). Because the demographic adjustments were for age, gender, Medicaid eligibility, and institutionalization, this implied that younger, non-Medicaid eligible, and noninstitutionalized beneficiaries were signing up for managed care—in short, a healthier, less frail population than that remaining in TM.
In 1985, after these demonstration projects had been carried out for some years, private plans that accepted risk-based capitation payments moved from demonstration status to become a regular part of the Medicare program. Over the past quarter century, various changes in program rules, plan payments, and other incentives have affected both the health plans' participation in the Medicare program and the proportion of beneficiaries enrolled in Part C plans. Here we review how Part C performed in relation to its two stated goals. We divide our discussion into four periods: 1985 to 1997, 1997 to 2003, 2003 to 2010, and 2010 and beyond, placing Medicare's policy and experience in the context of managed care plans and commercial health insurance. These periods are demarcated by the major legislative actions of the 1997 Balanced Budget Act (P.L. 105–33), the 2003 Medicare Modernization Act (P.L. 108–173), and the 2010 Patient Protection and Affordable Care Act (P.L. 111–148). In our conclusion we consider the prospects for Medicare's goals in light of the latest round of payment changes in Part C.
Despite its severe shortcomings to date, we believe that Part C remains a viable vehicle for improving Medicare through the use of utilization management techniques common in private health insurance. Indeed, one vision of the future is that many of the pilot Accountable Care Organizations to be established under the Affordable Care Act will evolve into private plans that accept full risk.
The Medicare program is critical to the health and welfare of the elderly and disabled. But maintaining the current level of benefits and beneficiaries' payments for traditional Medicare is widely viewed as fiscally unsustainable (CBO 2010). A cost-control policy that relies on lowering payments to doctors and hospitals may reduce both access for Medicare beneficiaries and quality for everyone (Glazer and McGuire 2002). Moreover, there is widespread agreement on the need to reorganize the delivery system. A large fee-based TM program will continue to stifle attempts to reform the delivery system. Therefore, a robust MA program that lowers the cost to beneficiaries and taxpayers and promotes reform of the delivery system may be the answer.
The large and rich literature on the Part C program contains quantitative summaries, policy evaluations, and political analyses.1 Our contributions to this literature are two. After presenting some of the key data, we evaluate Part C over the entirety of its existence in light of what the program is supposed to accomplish. We analyze why the dual goals of expanding Medicare beneficiaries' choices and saving the Medicare program money have been so difficult to meet. Then we discuss the potential for the Affordable Care Act (ACA) to change the likelihood of meeting these goals. As a counterpoint to Medicare, we also track and compare developments in employer-sponsored health insurance, since employers share Medicare's goals of offering attractive health insurance options to their workers while keeping down costs.
Trailing the Private Sector, 1985–1997
The reason that Medicare expanded to include risk-based private plans was to share the gains realized from managed care in other settings. Research at the time found that prepaid group practices paid by capitation and serving those under sixty-five could provide more comprehensive coverage at less total expense than conventional health insurance could, largely by economizing on inpatient stays. Manning and colleagues (1985) compared the cost to those participants (all under sixty-five) of the RAND Health Insurance Experiment (HIE) who were randomly assigned to the Group Health Cooperative of Puget Sound (GHC) in Seattle, which also was the site of the earlier Medicare demonstration projects, with those people who were assigned to comparable coverage in fee-for-service care. The overall imputed costs were 28 percent lower at GHC, driven by a 40 percent difference in hospital costs, a finding that was consistent with the nonexperimental comparisons reviewed in influential papers by Luft (1978, 1982). There was no systematic evidence that the HMOs' reductions in use affected health outcomes in the HIE, although the satisfaction of those patients randomly assigned to the HMO was lower than that of those in fee-for-service care, suggesting that traditional indemnity insurance's wide choice of providers was valued (Newhouse and the Insurance Experiment Group 1993, 306). This difference in satisfaction was not surprising, though, since many of those assigned to the HMO had had the opportunity to join it at work but had refused. Indeed, the satisfaction of a control group of patients who already had selected the HMO as their source of care did not differ from those in the fee-for-service system. Thus, for a substantial number of persons—all those in Seattle whose employers offered a choice of plan and who chose GHC—the loss of utility from the network restrictions was offset by the savings in out-of-pocket costs and premiums in the managed care plans.
In the Medicare program, Part C plans were (and are) required to offer a minimum set of benefits equivalent to that provided by Medicare Parts A and B. The plans were (and are) paid by capitation, and Medicare uses formal risk adjustment, setting a per-member-per-month payment for each beneficiary, which is called the average adjusted per-capita cost (AAPCC) and is calculated by a formula based on costs in TM and some beneficiary demographic characteristics such as age and gender. The rates are county specific and based on a five-year moving average (to reduce random variation) lagged by three years (owing to the delayed availability of data). The resulting amount was reduced to 95 percent of the Medicare average, thereby returning a savings to the Medicare program (Newhouse 2002). The presumption was that private Part C plans could, and would, economize on care and that by reducing by 5 percent the amount that Medicare paid the plans, the government would share in the savings.
In principle, paying 95 percent of the local risk-adjusted TM average cost could achieve the goals of both expanding choice and reducing program cost. Any supply of HMOs at the regulated price would increase the options for at least some beneficiaries, relative to those before 1985. And if the risk-adjusted formula captured the average costs for those beneficiaries who actually enrolled in MA, as opposed to the beneficiaries remaining in TM, the 95 percent rule would save Medicare money.
But during this period, Medicare's risk-adjustment methodology proved to be inadequate, explaining only 1 percent of the variation in the individual beneficiary's health care cost and thereby opening the door to the adverse selection of two types, both of which could, and did, thwart Medicare's savings aspirations. The plans could not refuse to allow beneficiaries to enroll, but they could choose which counties to serve. Accordingly, the plans entered high-payment, high-cost—and therefore high-reimbursement—counties and expanded the choices there while at the same time avoiding low-cost counties.
More problematic for Medicare spending were beneficiaries' decisions to choose traditional Medicare. We do not know what proportion of future health care costs an individual can predict, but it is certainly much greater than the 1 percent that the risk-adjustment formula used. Newhouse and colleagues (1989) estimated that on the basis of past spending, an individual (and plans) could predict at least 20 to 25 percent of the variance in a given year. Furthermore, plans do not have to be able to predict individual costs in order to be able to select their participants. By marketing to the healthy—the classic strategy for indemnity insurers is to offer low premiums and high cost sharing (Rothschild and Stiglitz 1976)—the plans can rely on knowledge of and actions by the beneficiaries to make their selection. Selection also was facilitated by lenient rules governing a beneficiary's ability to switch into and out of MA plans. Before 2006, Medicare allowed beneficiaries to change plans monthly as a means of protection.
Furthermore, MA plans set the beneficiaries' premiums subject to the constraint that the premium's actuarial value plus any cost sharing had to be less than that required under TM. The plans were not allowed to charge negative premiums (i.e., they could not give beneficiaries an monetary payment for joining). Moreover, Medicare stipulated that a MA plan could not earn a higher return from its Medicare business than it earned in the commercial market, and it required that any “excess return” be returned to beneficiaries in the form of extra benefits. Thus, competition among plans and with TM was primarily on supplemental benefits, such as vision or dental benefits, and on reduced premiums and cost sharing (Newhouse 2002). In practice, at various times numerous plans did charge a zero premium, so the no-negative-premium constraint was a factor in plan pricing.
Plan Participation and Beneficiaries' Choices
When deciding whether to enter a county's Medicare managed care market, insurance companies like Blue Cross or Aetna consider the level of Medicare payment, the costs of building and maintaining a physicians' network and operating a health plan in the county, beneficiaries' demand for plans, and the competition for products and provider markets. When entering a market, insurance companies establish “contracts” with Medicare and within those contracts offer at least one, but often several, benefit packages, which are referred to as plans (see Figure 1).
FIGURE 1.
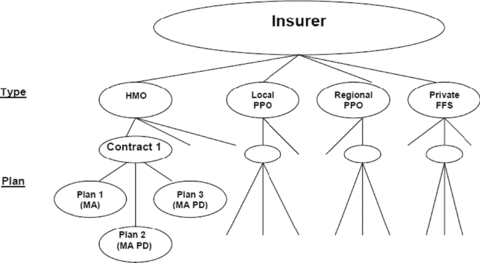
Insurance Companies' “Contracts” with Medicare
Insurers like Blue Cross or Aetna hold Medicare Advantage “contracts” with CMS. For each type of product such as an HMO or a PPO, the insurer generally has one contract for an entire state or the part of the state that is the insurer's service area. Each contract holder may, and typically does, offer several benefit packages under each contract. The benefit packages specify the services covered, the cost sharing, and the premium. In the figure, MA refers to a plan that does not cover drugs, and MA PD indicates plans that, as of 2006, do cover drugs. Private-Fee-for-Service plans are described in the text.
After the introduction of risk contracting in 1985, the number of Medicare contracts held by health insurers grew, then fell at the end of that decade partly because of market consolidation (e.g., two insurers in a single state merged) (Physician Payment Review Commission 1995), and then grew again during the mid-1990s (see Figure 2). Cawley, Chernew, and McLaughlin (2005) found that the entry of HMO plans in a county MA market was positively associated with AAPCC payment levels and negatively associated with Medicare Part A (hospital) spending, thus suggesting that plans avoided counties with relatively sicker Medicare beneficiaries and that their risk adjustment was inadequate. During the mid-1990s, managed care grew rapidly in the private market, and HMOs' participation in Part C was positively associated at the county level with commercial HMO penetration rates (Welch 1996).
FIGURE 2.
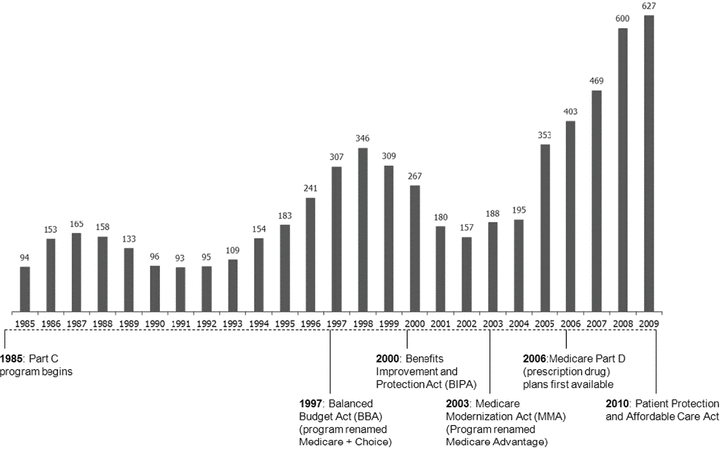
Total Number of Medicare Advantage Contracts
Note: Contracts include local Coordinated Care Plans (risk-based HMOs plus PPOs), Private Fee-For-Service plans, and regional PPOs.
Source: CMS, Medicare Managed Care Contract (MMCC) Plans Monthly Summary Report. All data are from December of the year indicated, except those for November, in 2007.
During this period, until the Balanced Budget Act was passed in 1997, HMOs were the only Part C product allowed, and Medicare was moderately successful at giving beneficiaries access to them (see Figure 3). Whereas in 1993 about half of Medicare beneficiaries lived in a county offering at least one HMO, by 1998 that number had increased to 74 percent (Zarabozo 2000). There was substantial variation in the geographic availability of HMOs, however, with insurers favoring urban areas. By 1996, all beneficiaries in central urban locations had access to at least one risk-based MA HMO; but in urban-rural fringe areas, only 22 percent had such access; and in even more rural areas, only 9 percent had an HMO available to them (Physician Payment Review Commission 1997). The small number of doctors and hospitals in rural counties meant that insurers had little bargaining power to negotiate favorable rates, and administrative and marketing costs also were higher in rural counties (Casey 1998; Moscovice, Casey, and Klein 1998).
FIGURE 3.
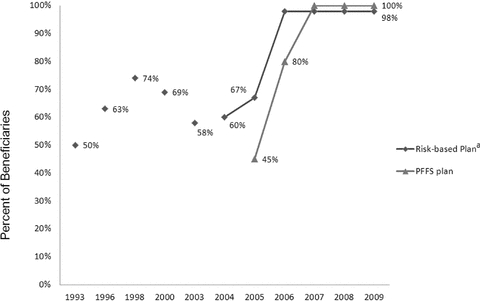
Medicare Beneficiaries' Access to an MA Plan
Note: aIncludes HMO, local PPO, and regional PPO plans.
Sources: MedPAC 1998, 2010a; Zarabozo 2000.
For beneficiaries, enrollment in Part C was (and remains) voluntary, and as mentioned earlier, until 2006 beneficiaries could switch each month from a Part C plan to traditional Medicare (or vice versa). By joining a Part C plan, a beneficiary typically avoided the substantial cost sharing in TM—or, alternatively, a premium paid for supplementary coverage—and enjoyed some additional services but had to accept utilization management and less choice of provider. The plan benefits beyond those provided through TM typically were coverage of much of Medicare-required cost sharing but often some coverage of prescription drugs and dental and eye care. The number of MA plans offering at least some prescription drug coverage increased from 40 percent in the late 1980s and early 1990s to 67 percent in 1997 (Gold et al. 2004), thus partially filling a major gap in traditional Medicare's coverage, since drugs account for about 20 percent of Medicare's spending on covered services (Zhang, Baicker, and Newhouse 2010). The value of extra benefits offered by the average MA plan nearly doubled from 1994 to 1996 (increasing from $43 per member per month to $83 per member per month) (Prospective Payment Assessment Commission 1997). The actuarial value of these extra benefits was higher in areas with higher AAPCC payments, most likely because competition forced the plans to translate the higher payments into more benefits for enrollees (Newhouse 2002).
Enrollment in MA plans remained low through the early 1990s, with only 2 to 5 percent of beneficiaries nationwide enrolled in an HMO. But as a result of their more generous benefits, enrollment then grew steadily through the decade to reach 14 percent (5.2 million beneficiaries) in 1997 (see Figures 4 and 5). There was, however, substantial variation in enrollment across states. Even in 1997, nine states reported greater than 20 percent HMO penetration among their Medicare populations (although several counties in other states did as well), and in twenty-seven states, 5 percent or less of eligible Medicare beneficiaries were enrolled in a Part C plan (CMS 1997).
FIGURE 4.
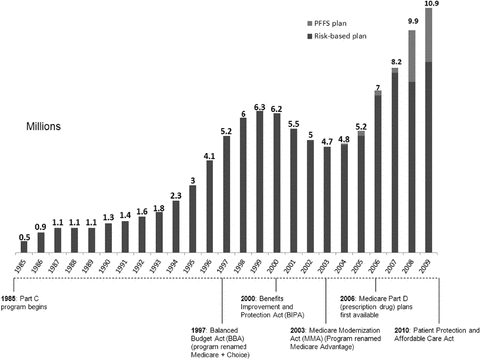
Enrollments in Medicare Advantage Plans
Source: CMS, Medicare Managed Care Contract (MMCC) Plans Monthly Summary Report. All data are from December of the year indicated, except those from November, in 2007.
FIGURE 5.
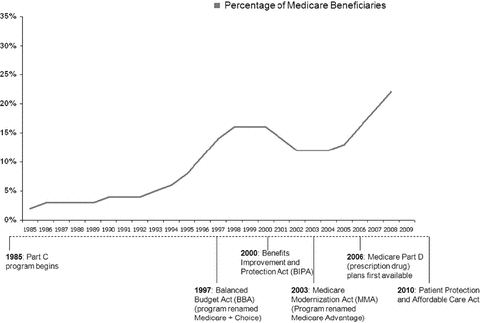
Percentage of Medicare Beneficiaries in Medicare Advantage Plans
Source: CMS, Medicare Managed Care Contract (MMCC) Plans Monthly Summary Report. All data are from December of the year indicated, except those from November, in 2007.
Medicare Program Savings
During this period, Part C was costing rather than saving Medicare money. Despite taking 5 percent “off the top,” by paying plans 95 percent of a beneficiary's expected costs, the limited, demographic-based, risk-adjustment system failed to compensate for sicker patients' inherent preference for TM and also allowed plans to profit from selecting healthier enrollees. The adverse selection in Part C was exacerbated by the ability of Medicare beneficiaries to enroll and disenroll in a Part C plan each month because it permitted them to change plans following any abrupt change in their health status (Newhouse 2002).
Several studies found that new Part C enrollees cost less than did a comparison group of beneficiaries who stayed in TM, even after accounting for risk adjustment (MedPAC 2000; Physician Payment Review Commission 1996). MedPAC (2000) used 1997 data to compare the use of services by new HMO enrollees in the twelve months before their enrollment when they were in traditional Medicare with the use of services by matched beneficiaries who stayed in TM during the same period. MedPAC found that the new enrollees used 23 percent fewer services than did the “stayers” when both were in TM. This study also found that the age- and sex-adjusted mortality rate of those enrolled in private plans was 21 percent lower in the year after joining, implying that sicker Medicare beneficiaries stayed in TM. Although the mortality rate subsequently regressed toward the mean, it remained 10 percent lower for four years after joining than for those who had been in TM. Indeed, the lower mortality rates in MA resulted in a substantial savings for the plans, since they did not disproportionately incur the high end-of-life costs (Buntin et al. 2004).
In sum, on average, healthy, low-cost beneficiaries were joining MA and reducing TM costs by less than the amount that Medicare was paying the plans. As a result, in the mid-1990s Medicare paid MA plans an estimated 5 to 7 percent more than it would have paid for those same beneficiaries in TM (MedPAC 1998). This overpayment translated into approximately 0.3 to 0.8 percent of total Medicare program spending (see Figure 6). Because Medicare spending was growing around 10 percent annually in the mid-1990s and the entry of the baby boomers loomed, these excess payments added to growing concerns about the solvency of Medicare (Oberlander 2003).
FIGURE 6.
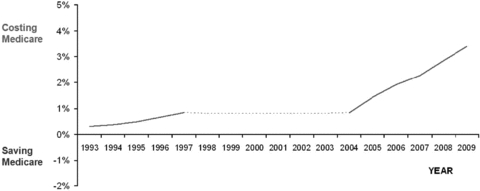
The Net Effect of Medicare Advantage Plans on Medicare Spending
Note: Our calculations are based on MedPAC Reports to Congress 1998–2010 and CMS Monthly Contract and Summary Reports 1993–2009. The values are the product of the percentage in MA and the estimated percentage of over- or underpayment. Dotted lines indicate no data available.
Employer-Based Health Insurance
Medicare's practices for qualifying risk-based plans, paying plans, and charging premiums to beneficiaries have always differed in important ways from employer-based arrangements (see Table 1). Medicare's initiative lagged by nearly a decade the federal endorsement of HMOs in private health insurance. In 1973 Congress passed the Health Maintenance Organization (HMO) Act (P.L. 93–222) (with the regulations completed in 1976), mandating that employers with more than twenty-five employees offer them the option of choosing a federally qualified HMO if one were offered in the area. Although the HMO Act originally required private HMO plans to offer specified basic health services in order to be “federally qualified” (and thus eligible for federal grants), by the 1980s these requirements had been relaxed through amendments. This was different from Medicare's practice, which has always stipulated that the benefits covered by TM also must be covered by MA plans.
TABLE 1.
Medicare and Large Employer HMO Payment Methodologies (1985–1997)
| Medicare | Private Employers | |
|---|---|---|
| Federal endorsement | TEFRA 1982 | HMO Act of 1973 |
| Benefit package | Required, at minimum, to provide the same benefits as covered under Medicare Parts A and B. | HMO Act of 1973 required “federally qualified plans” to provide “basic health services.” |
| Plans use savings earned from covering the basic benefit to cover additional benefits, such as prescription drug coverage, or to lower cost-sharing requirements. | Basic services requirements relaxed through amendments beginning in 1976. | |
| Plan selection: market level | Plans choose the areas in which to participate (at the county level). | Provision of HMO Act of 1973 required employers to offer the choice of at least one qualified HMO plan in their area. Plan negotiates with employer to be included in those plans available to employees. |
| Medicare accepts any qualified plan. | ||
| Plan selection: enrollee level | Beneficiaries may join any qualified plan in area and may opt in to or opt out of TM each month. | Enrollees may choose or switch plans each year. |
| Plan payment | Capitation based on Medicare formula: | Capitation. |
| • Adjusted for geography and beneficiary's characteristics. | Plans set premiums or negotiate payments with employer. | |
| • 95% of AAPCC.a | ||
| Enrollees' premium | Plans choose premium, subject to regulation. | Employer sets employees' premium payment for HMO and alternative plans. |
| • Enrollees pay Part B premium. | ||
| • Plans may charge additional premium as long as actuarial value of combination of the plan premium and cost sharing is no more than the actuarial level of cost sharing in TM. |
Note:aAAPCC = average adjusted per-capita cost.
Like MA plans, plans serving employers were paid by capitation rather than fee-for-service, but the capitation payment was determined differently. In the commercial market, HMOs either set a price or negotiated a per-person and per-family price with employers, without formal risk adjustment, and the average price typically accounted implicitly for age, gender, and family size. In addition, instead of being required to offer beneficiaries “any” qualified plan, as is the case in Medicare, employers selected which plan(s) to offer based on price and quality. In comparison, Medicare's procedure effectively ceded to the plans the decision about whether to contract with Medicare.
Premiums to consumers also were set differently. Employers determined the premium that employees would pay for the HMO alternative—while taking account of their other benefits—and could, if they wished, set premiums at a level that would encourage enrollment in the HMO alternative. Employers also restricted how often and when employees could switch their health plans (which was almost always once a year during an employer-determined open enrollment period) in order to minimize the adverse selection of the health plans they offered.
In addition, the experience with and growth in risk-based contracting in the private sector has differed markedly from that in the Medicare program. Indemnity health insurance with open provider networks that were paid on a fee-for-service basis, the original model for TM, virtually disappeared from the employer-based health insurance market during the 1990s, replaced by several varieties of managed care plans (Cutler and Zeckhauser 2000; Glied 2000), whereas fee-for-service remained dominant in Medicare. By 2000, when fewer than one of six Medicare beneficiaries was in an MA plan, about nine out of every ten privately insured workers used some kind of managed care plan (see Figure 7). Although for many years employers had restricted employees' choice of plan, during the 1990s private employers introduced new types of managed care plans, Preferred Provider Organizations (PPOs) and Point of Service plans (POSs). These plans typically had less utilization management and weaker incentives to use in-network providers than HMOs did (Glied 2000).
FIGURE 7.
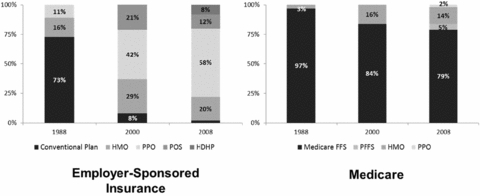
Enrollment by Plan Type: Medicare vs. Employer-Sponsored Insurance
Sources: The 2008 Medicare data are from MedPAC 2010c; the 1988 and 2000 Medicare data are from CMS MMCC Plans Monthly Summary Reports; the Employer-Sponsored Insurance data are from KFF/HRET Employer Health Benefits Annual Survey Chart Pack 2009.
During the 1990s in California, risk bearing by physicians' groups took root. California already had a number of large, multispecialty group practices that had formed to compete with the Kaiser Permanente medical groups. In the late 1980s, some of these groups were experimenting with capitation contracts, and their success induced others to follow suit (Casalino and Robinson 1997). Medical groups not only bargained with hospitals over rates but also worked to reduce the use of hospital care, thereby substantially reducing hospital costs. Following this strategy of choosing hospitals and managing care, the risk-bearing medical groups cut the days per thousand to less than half the rates of preselective contracting for both employer groups and Medicare beneficiaries (Casalino and Robinson 1997). Indeed, these medical groups were the forerunners of what today's debate envisions as “Accountable Care Organizations.” But these medical groups usually contracted with health plans, which took a percentage of a full capitation for effectively serving as the group's marketing agent to employers and to Medicare beneficiaries. Although some medical groups outside California experimented with taking risk, most of them in the end returned to the familiar fee-for-service reimbursement system.
The growth of health care costs for those under sixty-five slowed markedly in the mid-1990s, an achievement widely attributed to the decline of indemnity insurance and the spread of managed care (Cutler and Sheiner 1998). The growth rates of premiums paid to managed care organizations (MCOs) were falling for major buyers of health insurance in bellwether California: private employers (Robinson 1995), individual purchasers (Buntin et al. 2003), the California Public Employees Retirement System (CalPERS 2004), and the Office of Personnel Management (OPM 2004), which purchased on behalf of federal employees. Nationally, per-capita spending by private health insurance grew an average of 4.0 percent per year from 1993 to 1997, while per-capita Medicare spending grew an average of 7.3 percent per year (MedPAC 2009a). Some of this difference could be attributed to a changed benefit package in private health insurance, but much of it was due to a one-time lowering of provider payments (Cutler, McClellan, and Newhouse 2000), made possible by the plans' selective contracting with providers. Across the United States, physicians' income was constant in real terms throughout the decade, as the higher growth in Medicare rates offset the lower growth in commercial insurance (see Figure 8) (Kane and Loeblich 2003).
FIGURE 8.
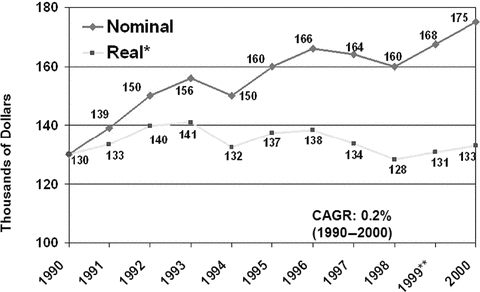
Nominal and Real Median Net Income for Physicians, 1990–2000
Notes: *Real income deflated by the all-item CPI. **CAGR = compound annual growth rate, a measure of annualized growth over a given time period.
Source:Kane and Loeblich 2003.
By 1997 the sustained and rapid increases in Medicare spending forced Congress's hand. Medicare Parts A and B were the second and third largest programs in the domestic budget, exceeded only by Social Security, and they were growing considerably more rapidly than the revenue from taxes. As a result, by 1997 Medicare's trustees projected that in five years, Part A's trust fund would have a zero balance, which the press interpreted as Medicare was soon to “go broke.” The resulting political pressure led Congress to restrain Medicare spending by passing the Balanced Budget Act of 1997 (BBA), which had a significant impact on both the Medicare Advantage program and traditional Medicare.
Failed Attempt at Savings: 1997–2003
The BBA's goals with respect to Medicare Advantage can be summarized in the following question: Could Medicare Advantage be reformed so that Medicare could participate in the managed care dividend enjoyed by private employers? In the latter half of the 1990s, Republicans (the new congressional majority), centrist Democrats, and some policymakers began to look to Medicare as a source for reducing the deficit (Oberlander 2003). Debate centered on the idea of “premium support,” in which Medicare beneficiaries would be given a lump sum—in effect, a “voucher”—that could be used to pay for a private plan or for the premium for TM, a model used by some private employers as well as the Federal Employees Health Benefit Program (FEHBP) (Oberlander 2000). Aaron and Reischauer (1995), among others, argued that such a policy would promote competition and efficiency in Medicare, give beneficiaries a choice, and capture some of the managed care dividend for Medicare.
Moving Medicare to a defined-contribution model from a defined-benefit model would have profoundly altered its nature. In effect, it would have protected Medicare, meaning (mostly nonelderly) taxpayers, while possibly exposing beneficiaries to higher costs. Opponents worried not only about the possibility of higher cost to the elderly but also about HMOs' restrictions on access to specialists and reductions in inpatient care, which could have adverse effects on the elderly's health. Critics pointed out that the elderly were a more vulnerable population than the privately employed and that inadequacies in the AAPCC's risk-adjustment system would favor selection and the likely overpayment of private plans (Oberlander 1997).
After an intense debate, Congress passed the BBA, in which Medicare's at-risk contracting with health plans was formally designated as Part C of Medicare and named Medicare+Choice (M+C). The intent was to encourage competition and the growth of managed care in the Medicare program, with the hope that this would save Medicare funds. Most Democrats, however, vehemently opposed the defined-contribution initiative and succeeded in having the topic assigned to a bipartisan commission for study. In the meantime, Medicare remained a defined benefit program.
Following the private market's lead, the BBA authorized new types of private plans within Part C: preferred-provider organizations (PPOs), provider-sponsored organizations (PSOs), and private fee-for-service plans (PFFS). PSOs are similar to HMOs except that they are run by a provider or a group of providers. PFFS plans were not managed care plans at all, but indemnity plans like traditional Medicare that were prohibited from having restrictive provider networks and from actively managing care at all. PFFS plans did however, serve to “privatize Medicare,” thus meeting a political objective of some conservatives. These plans initially arose from the desire of some physicians to be able to charge above the Medicare fee schedule (the idea was that the insurer would recoup these costs through the premium) and from pro-life supporters who (in our view, mistakenly) feared rationing in TM. Enrollment in PFFS plans, however, remained minuscule through 2003, when they were given “deeming authority.” This authority allowed the PFFS plans to pay traditional Medicare prices to providers participating in TM, thereby negating the hopes of those physicians who had advocated the PFFS option in order to avoid the restrictions of the Medicare fee schedule. Although PFFS plans are authorized under Part C of the program, they do not provide a markedly different delivery alternative to fee-for-service TM (but in many areas they had better benefits, for reasons described later). We will discuss them separately from the other risk-based MA plans (HMOs, PPOs, etc.).
The BBA also required the Centers for Medicare & Medicaid Services (CMS) (then called Health Care Financing Administration, HCFA) to improve its risk-adjustment methods by using measures of health status, which the agency began to implement in 2000 by including diagnosis as a risk adjuster. The idea was that MA plans would be paid more for sicker patients and less for healthier ones. For the first few years after 2000, however, only 10 percent of the plan payment was based on the enhanced risk-adjustment system, because before this time, only the diagnoses of inpatients were reliably coded, and so only hospital-based diagnostic data could be used in the new formula. (TM payments to hospitals were based partly on the diagnosis responsible for the stay, whereas payments to physicians did not depend on diagnosis and so were not reliably reported.) CMS did not want to encourage plans to hospitalize a patient solely to record a diagnosis and to receive a higher reimbursement; hence, the new system was given only a modest 10 percent weight. To remedy this flaw, the BBA required the collection of diagnoses for outpatient claims, which were to be incorporated in a risk-adjustment system that used both inpatient and outpatient diagnoses. Such a system was implemented in 2004 and is discussed in the following section.
In response to geographic inequalities in Part C reimbursement, which reflected lower TM reimbursement in many rural areas, the BBA changed the payment formula for Part C plans. To encourage plans to enter areas with low AAPCC rates, the plans were paid the higher capitation rate of (1) a minimum, national floor payment that began at $367 per month in 1998 and was to be adjusted annually; (2) a 2 percent increase from the county's prior year rate; or (3) a blended national and local payment, applied only when the impact on Medicare costs was neutral (which happened only in 2000). Thus changes in the plans' payment to the county were no longer directly linked to changes in TM costs to the county, although the initially large differences in the level of reimbursement across counties were largely preserved. The floors, however, increased the health plans' overpayment, because even if the selection into health plans were neutral, Medicare would be paying more for Part C enrollees in any floor county than it saved on spending in Parts A and B. This was, however, a time when Congress was trying to cut Medicare spending, so it was looking for some savings to offset the increased spending on the floor payments. It found these savings by effectively limiting to 2 percent the increases in Part C reimbursement in nonfloor counties. Since Part C costs were tied to TM costs and TM costs were projected to rise more than 2 percent, this resulted in a “scoreable” offset to the floor payments in the arcane arithmetic of federal budgeting.
To keep hospitals and doctors in their networks, however, the plans, including traditional Medicare, had to pay market rates. As a result, the 2 percent cap on payment increases in the nonfloor counties cut the plans' margins in these counties, sometimes enough to turn the margins negative. To restore their profits, plans in these counties reduced the number of covered services, such as prescription drug coverage, and raised their cost-sharing requirements (Young 2003). Consequently, the number of plan contracts began to drop from the high of 346 reached in 1998 (Figure 2), and the plans withdrew from some counties that they had been serving.
In response to the plans' actions, growth in enrollment in Part C plans slowed in 1997 and began to decline in 1999 (Figure 4). By 2002, only 4.9 million individuals (12% of beneficiaries) were enrolled in a Part C plan, down from 6.3 million (16% of beneficiaries) in 1999. Between 1999 and 2003, more than 2 million beneficiaries were involuntarily disenrolled from those plans that withdrew from certain counties. Approximately 20 percent of them had no other Part C plan to choose (Gold et al. 2004), which was a huge setback to the goal of expanding choice. By 2003, Medicare's managed care penetration rates were greater than 15 percent in only ten states, and the penetration rates in all remaining states averaged only 4 percent, just half of what they were in 1999 (Gold et al. 2004).
Caught short by the exodus of private plans after the BBA's and beneficiaries' complaints about involuntary withdrawals and benefit reductions, Medicare and Congress responded with a series of stopgap policies between 1999 and 2002 that attempted to stabilize the MA program. The basic strategy was simple: pay more.
Overall, the BBA, riding the tail end of the decade of managed care growth, succeeded in cutting the growth of Medicare spending, which in nominal dollars actually fell from 1997 to 1999, mainly because of large cuts in TM reimbursement to home health agencies and skilled nursing facilities. Such a fall in nominal Medicare spending had never happened before—and has not happened since. The improved fiscal situation allowed Congress to pass both the Balanced Budget Refinement Act in the fall of 1999 (BBRA) and the Budget Improvement and Protection Act of 2000 (BIPA), which raised payments to plans from a minimal increase of 2 percent up to 3 percent each year, raised the existing floor payment in rural counties, and created a separate and higher urban floor payment.
Beneficiaries' Access and Choice of Plans
From 1997 to 2003, the widespread exit of MA plans reduced beneficiaries' choices and weakened confidence in Part C. Moreover, with the exception of floor counties, the BBRA and the BIPA failed to reverse the declining participation of the plans and the enrollment of beneficiaries. By 2003, the number of what Medicare now called coordinated-care plan contracts (HMOs, PPOs, or POSs) had fallen 50 percent, to 151 from 309 in 1999 (Gold et al. 2004), although some of the drop was attributable to the health plans' mergers and acquisitions. There still were few other plan types offered besides HMOs, and there continued to be a wide geographic variation in plans' availability across markets, with 40 percent of beneficiaries still lacking access to a Medicare managed care plan (Figure 3).
Despite the increase in payments to those rural counties receiving the floor rates, beneficiaries in rural areas continued to have poor access to an MA plan. Whereas in 2001, 94 percent of beneficiaries living in a metropolitan statistical area (MSA) with at least one million people had an MA HMO in their county, only 5 percent of those living in counties not adjacent to a MSA had access to a plan. Furthermore, those plans that were available in rural areas offered less generous benefits than did those available in urban areas (MedPAC 2001). This lack of entry was consistent with an observation we made earlier: that plans' participation depends on being able to strike favorable bargains with suppliers, and the market power of the relatively small number of providers tilted the bargaining advantage toward the provider. In addition, the cost of marketing in sparsely populated areas was higher (MedPAC 2001). The lack of favorable conditions in rural markets for HMOs, together with the more generous rural payment floors, opened the gates to the entry of PFFS plans in rural markets when the participating TM providers were required to accept reimbursement from PFFS plans at TM rates.
PFFS plans gave most rural beneficiaries an option other than TM, at least on paper, with the percentage of beneficiaries in rural areas having a choice rising from 21 percent in 2000 to 62 percent in 2003 (Gold et al. 2004). As explained earlier, however, PFFS plans were completely different from the original TEFRA vision of a staff or group model HMO offering health insurance distinct from TM. Not only were the PFFS plans explicitly prohibited from any utilization management techniques, but they also did not have to report or satisfy any measures of quality. Their ability to pay at TM rates made moot the plans' lack of bargaining power in highly concentrated rural markets. Beneficiaries in rural counties thus had a “choice” in name only. From their perspective, the PFFS plans placed no restrictions on the providers they could use or on the treatment choices of those providers (just like TM). But since the PFFS plans in the floor counties were being reimbursed at rates on average higher than TM, this effectively put money on the table that, through competition, meant better benefits for their beneficiaries than for those in TM. It took some time, however, for the market to exploit this opportunity and for Medicare to bear the resulting increase in spending.
Medicare Program Savings and Employer-Sponsored Health Insurance
Between 1997 and 2003 Medicare continued to lose money on those beneficiaries who enrolled in MA plans, partly because of the payment floors and partly because of favorable selection into Part C. Indeed, the continued favorable selection overwhelmed the ability of risk adjustment to pay less for less expensive beneficiaries. An analysis of the Medicare Current Beneficiary Survey found that in the early 2000s, MA enrollees were less likely than TM enrollees to report that they were in fair or poor health, that they had functional limitations, or that they had heart disease or chronic lung disease (Riley and Zarabozo 2006/2007). But the analysis found no difference in reported rates of diabetes or cancer.
The evolution of Medicare and commercial insurance also continued to differ. On the private side, traditional indemnity insurance had all but disappeared in the private market, a stark contrast from Medicare (Figure 7). Moreover, the BBA's treatment of Part C suffered from bad timing because of a halt in the downward trends in the growth of health spending achieved by managed care in the private market in the mid-1990s.
By the end of the 1990s, managed care in the private sector had evolved from the plans first endorsed by the government through the HMO Act of 1973 and TEFRA, the vertically integrated staff and group model HMOs, to network plans with nonexclusive contracts with many independent providers. Providers' and consumers' resistance to restricted networks and utilization management had spawned a managed care “backlash” that pushed managed care plans to loosen their networks. Thus, whereas Medicare beneficiaries not in TM or PFFS essentially had only the choice of an HMO, private-sector employees could (and did) enroll in one of a broader set of managed care plans, particularly favoring the less restrictive PPO and POS plans (Figure 7). Many larger employers offered their employees a choice of plans that varied in the restrictiveness of provider networks and in the degree to which care was managed. This likely made the shift from indemnity to managed care more palatable to the private sector and hastened the decline of open network fee-for-service plans in that market.
The managed care backlash also played out in the legislative arena, mostly through unsuccessful attempts in Congress and state legislatures to enact patients' bills of rights and any-willing-provider laws that were meant to counter the managed care plans' tactics of utilization management and network selective contracting, respectively. The judicial backlash saw efforts to hold plans liable for damages resulting from utilization management, and ultimately the Supreme Court upheld managed care practices (see Aetna Health, Inc. v. Davila, CIGNA HealthCare of Texas, Inc. v. Calad et al., 124 S. Ct. 2488, 2004). Physicians also brought a class action lawsuit against managed care plans for practices connected to capitation and risk contracting. Although some of the plans settled, those that fought the suit ultimately won on summary judgment (Re: Managed Care Litigation 2006a, 2006b).
The health plans' selective contracting prompted providers in many markets to consolidate, thereby shifting market power toward providers and diminishing the plans' negotiating ability. One example is the Brown and Toland Medical Group in San Francisco, which entered into a consent decree with the Federal Trade Commission (FTC). The FTC (2004) alleged that Brown and Toland assembled otherwise competing physicians for the purposes of price fixing in contracting with managed care organizations (MCOs). Dranove, Simon, and White (2002) found that increasing managed care in markets over the 1980s and early 1990s resulted in increasing hospital concentration, of an amount equivalent to that of a market with about ten equal-sized hospitals changing into a market with six hospitals (Morrisey 2008).
It was in this environment of decreasing plan participation and declining enrollment in MA plans that President George W. Bush's administration and the Republican-led Congress looked to revitalize MA. The result was the passage of the Medicare Modernization and Improvement Act (MMA) in 2003, which—although perhaps best known for its creation of a prescription drug coverage benefit (Medicare Part D)—dramatically changed the MA program.
Medicare Spends Its Way out of Trouble: 2003–2010
The 2003 Medicare Modernization and Improvement Act (MMA) established a larger role for private health plans in Medicare largely based on a shift away from a focus on cost containment and regulation and toward the “accommodation” of private interests (e.g., the pharmaceutical and insurance industries) and an ideological preference for market-based solutions that stemmed from the Republican control of both the executive and legislative branches of government (Oberlander 2007). The MMA enacted the most significant changes to the Medicare program since its inception, and the emphasis of these reforms was the use of private plans—including, we note parenthetically, in Part D. The generosity afforded to private plans via the MMA (described later) was in large part an attempt by the Bush administration and Congress to increase the private sector's role in Medicare. (Oberlander [1997] provides further discussion of the role of politics in the structure and passage of the MMA.)
Several provisions of the MMA modified reimbursement levels and risk adjustment in Part C. The MMA reversed the downward trends in the plans' participation and enrollment through the strategy of raising plan payments. Medicare would now pay the highest of (1) an urban or rural floor payment; (2) 100 percent rather than 95 percent of risk-adjusted TM fee-for-service costs in the county; (3) a minimum update over the prior year rate of 2 percent or traditional Medicare's national expenditure growth rate, whichever was greater; or (4) a blended payment rate update. These new rules translated into an initial average increase in plan payments of 10.9 percent, with some counties receiving more than a 40 percent increase (Achman and Gold 2004). The 100 percent provision ensured that all plans were at least immediately brought to equality with TM.
These provisions established a ratchet in plan payments, so that if the payments jumped ahead of TM in a county in a given year, they would remain at least that much ahead. For example, suppose that a county's spending rate was at the floor level in 2003 but that its paying 100 percent of TM fee-for-service costs rather than 95 percent put it above the floor in 2004. If the county's expenses grew less than the national TM rate of increase in the next year, the rise in the county's payments would be the national average (rather than the county average, as in the old system). If traditional Medicare's expenses in the county also grew less than the national rate in the following year, the county would again receive the national rate increase, thus widening the difference between the county's MA and TM payments. As a result, the rates of payment in MA began to climb relative to those in TM.
The MMA also created two more Part C plans: regional PPO plans and Special Needs Plans (SNPs). Regional PPOs are like local PPO plans except that they cover regions comprising a whole state or several states (there are twenty-six regions across the United States). Regional PPOs were created mainly to give rural beneficiaries better access to a broader set of private plans. SNPs were created for Medicare beneficiaries who also were eligible for Medicaid (so-called dual eligibles) and other vulnerable populations (e.g., those living in institutions or with certain chronic conditions) and were intended to provide the focused, specialized care particularly suited to these populations.
Risk-adjustment methods continued to be refined. As we noted earlier, beginning in 2004 diagnostic information from ambulatory care visits was combined with data on inpatient diagnoses and demographic adjusters to implement the Medicare Hierarchical Condition Category risk-adjustment model (CMS-HCC) (Pope et al. 2004). The relative payment rates for the HCC categories were based on the annual costs incurred in HCC categories in TM, thereby creating a much more powerful method of risk adjustment that accounted for approximately 10 percent of the variation in TM's annual spending and improved predictive power across the distribution of Medicare beneficiaries' expenses (Pope et al 2004). The HCC model was phased in over three years, but in a manner that held plans in the aggregate immune to the past favorable selection (Merlis 2007).
In response to recommendations from MedPAC, beginning in 2006 Medicare started a bidding process for plan payments. Plans bid their estimated costs in order to provide the minimal number of required benefits for an average mix of risks against an administratively set, county-level benchmark, which was equal to what the existing take-it-or-leave it reimbursement would have been under the earlier system. If a plan's bid was greater than the benchmark, it was required to collect the difference from its enrollees through a monthly premium. If it was lower, 75 percent of the difference was to be returned to enrollees in the form of supplemental coverage or lower premiums, and in an effort to reduce Medicare's obligations, the remaining 25 percent of the savings was to be returned to the Medicare program. In addition, starting in 2006 the MA plans began implementing a lock-in period following enrollment, which allowed enrollees to switch in or out of plans only once a year, during a specified open-enrollment period. The new risk-adjustment method that combined diagnoses (based on the CMS-HCC model) and demographics was completed by 2007.
With the implementation of Part D for prescription drug coverage in 2006, beneficiaries in TM could enroll in stand-alone Prescription Drug Plans (PDPs) for an additional premium. Risk-based MA plans were now required to offer at least one plan that included at least the basic Medicare drug benefit (referred to as MA-PD plans). To maintain neutrality with TM, the plans' reimbursement was increased for each enrollee by the risk-adjusted actuarial value of Part D.
The extension of prescription drug coverage in TM removed one advantage of MA plans over TM, namely, drug coverage, although after 2006 the plans often provided a more generous drug benefit than was available through Part D PDPs. The MA plans continued to differ from TM through their provision of disease management, care coordination, and preventive care, as well as continuing to obviate the need to purchase a supplementary policy. MA risk-based plans were now allowed to subsidize the Part B premium, which was required of all beneficiaries choosing to enroll in an MA plan (MA plans were also allowed to reduce Part D premiums for beneficiaries enrolling in plans offering Part D coverage), effectively relaxing the no-negative-premium regulation. These reduced premiums, however, were not relevant to the 16 percent of Medicare beneficiaries also eligible for Medicaid and were often not relevant to the additional 35 percent of beneficiaries with access to retirees' health insurance (Cubanski et al. 2008). The CMS also changed its hands-off approach to PFFS by issuing in 2008 a ruling that, starting in 2011, PFFS plans would have to have a legitimate network of physicians.
Beneficiaries' Access and Choice of Plans
Not surprisingly, Medicare's new-found generosity increased the number of Medicare Advantage contracts, to more than six hundred in 2009 (Figure 2). The number of PFFS plans, in particular, grew over this period as their ability to reimburse providers at TM rates, along with the ratchet in Part C payments, created an opportunity for plans to profit and for large employers with dispersed retirees to obtain better health benefits for them and/or to lower their costs by shifting them from TM to PFFS. Some PFFS payments were thus effectively transferred to employers, who shifted their retirees' health insurance program to Medicare Advantage PFFS plans (which were available at lower premiums than the alternatives). By 2009, 91 percent of beneficiaries had access to an MA coordinated care plan (HMO or PPO) (Figure 3), and all beneficiaries had access to a PFFS plan (MedPAC 2010c).
Some of the higher payments were passed to beneficiaries through more generous benefits, which in turn increased enrollments during this period. By November 2009, enrollment in an MA managed care or PFFS plan had reached 10.9 million beneficiaries, or about one in four Medicare beneficiaries, an increase of 1 million (10%) from November 2008 (MedPAC 2010c) (Figure 4). Overall, enrollment in MA more than doubled between 2003 and 2009. Residents of rural areas were more likely to enroll in a PFFS plan: 54 percent of rural MA enrollees were in a PFFS plan, compared with only 17 percent of MA enrollees in urban counties (MedPAC 2010c).
Over the last decade, the higher Medicare payments to plans also meant lower premiums for enrollees (and meant that employers sometimes paid the premiums for their workers or retirees) and lower out-of-pocket obligations (MedPAC 2009c). This made MA managed care and PFFS plans especially attractive to lower-income beneficiaries not eligible for Medicaid, many of whom were racial/ethnic minorities (Shimada et al. 2009). In 2005, 57 percent of beneficiaries in an MA plan had incomes between $10,000 and $30,000, compared with 46 percent of beneficiaries in TM, and 27 percent of MA beneficiaries were minorities, compared with 20 percent of TM enrollees (Norwalk 2007).
The development of SNP plans for the institutionalized, the dually eligible, and those with chronic conditions also contributed to the MA program's growth. The relative ease and low expense of establishing a SNP for those health plans already participating in MA and the improvements in risk adjustment are thought to have been the main drivers of the growth in SNP plans available in the MA market in the mid-2000s (Verdier, Gold, and Davis 2008). In 2007, SNP enrollees accounted for 11 percent of all MA enrollees, although about half this enrollment came from the plans moving beneficiaries from existing MA plans (Verdier, Gold, and Davis 2008). Currently, we have little information to determine whether SNPs are providing efficient, coordinated, and specialized care for their designated populations.
Systematic data on the quality of the MA health plan (except from PFFS plans) became available during the past decade. In general, these comparisons yielded mixed results. For example, an analysis of data from 2000/2001 found that the MA plans were somewhat better at delivering preventive services, although TM was better in other aspects of care related to access and beneficiaries' experiences (Landon et al. 2004). Consumer surveys in 2003/2004 found that for preventive services, patients in MA plans reported more favorable experiences than did patients in TM for care but that the quality assessments of other types of care were lower among patients in MA plans than among TM patients and that these TM-MA differences were greater for sicker patients (Keenan et al. 2001). Other research found that MA HMOs were more successful than TM in preventing avoidable hospital admissions and that they may have a particularly positive effect for people in poorer health (Basu and Mobley 2007). Moreover, MA plans have been found to reduce some racial/ethnic disparities in health care (Balsa, Cao, and McGuire 2007), although MA-TM racial and ethnic differences vary across measures, and the variation in the plans' levels is significant (Trivedi et al. 2006). There has not yet been much systematic analysis to show whether MA's disease management, care coordination, and preventive care programs generate better health outcomes than did those in TM. One large demonstration project showed that disease management did not reduce cost in TM, although the initial imbalances between the treatment and the control groups muddied these results (Barr et al. 2010; McCall et al. 2008).
Analysis by MedPAC, however, raised concerns about the care provided in the expanding MA program. Findings reported in November 2007 confirmed substantial variation across the plans with respect to specific measures of quality and provided evidence that the newer plans' performance generally fell below that of the older plans (Zarabozo 2007). Although beneficiaries did respond to information about (relative) reported plan quality, the effects were not large (Dafny and Dranove 2008).
Medicare Program Savings
Not surprisingly, given the abandonment of cost control as a focus of policymaking under the MMA, from 2003 to 2010 the MA program continued to cost, rather than save, the Medicare program money. Since the passage of the MMA, MA payment rates have been much higher than TM spending as a result of the floors and the ratchet described earlier (MedPAC 2009b). The average MA plan payment has been estimated to be 12 to 14 percent over Medicare fee-for service costs each year since 2003, which in 2009 amounted to between $10 billion and $12 billion in additional Medicare program spending (MedPAC 2009b). PFFS plan payments were even higher over this period (118% of fee-for-service costs in 2009), primarily because they were more concentrated in floor counties where the difference from TM spending was the greatest (MedPAC 2009b). We estimate that this overpayment, coupled with the rising enrollment in MA plans, accounted for 0.4 to 3.4 percent of total Medicare expenses (Figure 6). In short, to date the Medicare Advantage program has cost more than traditional Medicare.
Employer-Sponsored Health Insurance
The experience of the Medicare Advantage program continued to differ from employer-provided insurance in the private sector in several ways. First, managed care's penetration of Medicare beneficiaries, even at the nearly 25 percent level reached in 2009, continued to be much lower than the nearly 100 percent penetration observed among privately insured workers (Figure 7). Except for its greater benefits, PFFS is an alternative to TM in name only and is not at all like an HMO or even a commercial PPO. While HMOs and PFFS dominated the Medicare private plan market, PPOs continued to be the most common plan in the commercial market. In addition, the PPO and HMO products in the private sector have evolved, as several large insurers began shifting from a focus on unit price discounts—something TM obtained through market power—to networks based on the total cost per episode, thus partially addressing concerns about both the volume of services and poor quality, which led to readmissions.
Second, despite the introduction of some competitive bidding into the program, the cost of the MA program has continued to be driven largely by administered prices because plan bids are measured against a benchmark tied to the administratively set payment rates in TM. Thus the departure from standard bidding or negotiating methods used in commercial insurance to arrive at a premium has persisted.
Third, the choices available to beneficiaries differed significantly from those in the private sector. Since the advent of the MMA, not only do more beneficiaries have access to any MA plan, but they also have more choices among plans. In 2009, beneficiaries could choose from, on average, thirty-four plans, up from five in 2005 (MedPAC 2010c). In 2010, however, the number of options fell to an average of twenty-one per beneficiary, owing to the CMS's efforts to eliminate low-enrollment plans (defined as having fewer than ten enrollees) and duplicative plans, and because of new provisions prohibiting the non-network PFFS plans that began in 2011 (MedPAC 2010c). Even at the lower 2010 levels, however, this bountiful choice among plans contrasts markedly with that of the private sector, in which employees are able to choose, at best, among only a handful of plans and the majority of employees at small firms may join only the one plan their employer selects (KFF/HRET 2005).
In principle, greater choice allows consumers to find a plan that best matches their needs and tastes. In practice, however, it increases the possibility for selection and can lead to confusion and poor matches.2 When making decisions that involve uncertainty or high stakes or are complex, as is the case with many health plan choices, consumers often make predictable errors (Frank and Zeckhauser 2009). Although broad choice may encourage competition among plans, competition among plans also exists at employers that offer their employees a more limited choice among plans. Moreover, employers are generally better informed and buy at wholesale prices, which might engender more competition than do independent consumer-beneficiaries.
The overall cost of the Medicare program (net of beneficiaries' premiums), which by 2010 was 13 percent of federal outlays (and 21% of federal revenues), along with the excess cost to the Medicare program of treating beneficiaries in MA, caused policymakers great concerns about the MA program in the late 2000s. The political environment had changed as well, as the 2008 election of Democratic President Barack Obama and a Democratic majority in both houses of Congress diminished the support among government leaders for the privatization of Medicare that had persisted over the last decade. As a result, when health reform rose to the top of the policy agenda following the election of President Obama in 2008, reform of the MA program was part of the debate. Ultimately, reductions in MA payments were included in the Patient Protection and Affordable Care Act (ACA) passed in March 2010.
Achieving MA's promise? 2010 and Beyond
The ACA, signed into law by President Obama in March 2010, included another major restructuring of the MA program and significant cuts in MA plan payments. Specifically, for 2011, the payment benchmarks against which plans bid are frozen at 2010 levels. Starting in 2012 the legislation reduces some plan payments while preserving broad access to plans across areas and rewarding plans that provide high-quality care. These changes in payments are scheduled to be phased in over three to six years. More specifically, the legislation changes the plan payment formula so that the benchmarks against which plans bid vary according to how a county's TM spending compares with that of other counties. Plans operating in the quartile of counties (unweighted for population) with the highest TM spending face a benchmark equal to 95 percent of risk-adjusted TM costs in that area; plans in the next highest quartile face a benchmark equal to 100 percent of that area's TM costs; plans in the third highest quartile of counties face a benchmark equal to 107.5 percent of the county's TM costs; and plans in the lowest quartile of counties face a benchmark equal to 115 percent of the county's TM costs. Because the plans are concentrated in areas with high TM spending, this amounts to a considerable cut in Medicare spending. Plans also will be eligible for bonuses and rebates that depend on quality performance.
These cuts in plan payments were in part a response to continuing calls from MedPAC to neutralize payment differences between MA and TM. Cutting payments to MA plans also was now politically feasible in a liberal-leaning Congress, and lower MA payments were advantageous because they more than offset spending on other dimensions of health reform, thereby allowing President Obama and the Democratic leaders of Congress to promote a projected net decrease in federal health care spending.
The fundamental questions that we set out to address in this article have not yet been answered. Will plan payment cuts allow plans to provide appropriate services to beneficiaries, including sicker individuals, and remain financially stable? What will be the effect on choices and access to plans across areas? What will be the effect on plans' incentives to invest in quality? What will be the net cost of MA to Medicare? How will the experiences of MA compare with efforts by the private sector to slow growing costs while continuing to allow workers a choice of health plans?
Turning first to the adequacy of plan payments and beneficiaries' access, the changes to how benchmarks are set in the bidding process should reduce the projected plan reimbursement (thereby achieving a “scoreable” reduction in spending). But if the experience of the BBA in 1997 is any indication, some plans will be forced to shut down following these reductions in payments, thereby decreasing beneficiaries' access to plans. This in turn may lead Congress to reverse course and to raise payments again, even though the overall pressure on the federal budget is now much greater than it was in 1997. The adequacy of risk adjustment in Medicare and, by extension, whether Medicare will share in any savings achieved by the MA plans' more efficient provision of care (as opposed to overpaying plans for serving healthier beneficiaries), is also an open question. As far as we know, there has been no evaluation of the degree of selection in MA since the full implementation of the CMS-HCC system.
In regard to Medicare spending, the reductions in MA plan payments are a step in the right direction in their attempt to scale back the overpayment for MA beneficiaries' care (relative to what it would have cost to cover the same beneficiaries in TM) that occurred under the BBA and even more under the MMA. But several features of the MA program will likely continue to interfere with the realization of significant cost savings. These include a voluntary enrollment process that does not include any initiatives, other than the SNP plans, to encourage enrollment by those beneficiaries who would be most efficiently served in a MA plan.
MA payments continue to be benchmarked against TM, with its inefficiencies caused by administered pricing, which include encouraging inefficient services, especially when payments are set above the costs of provision (Ginsburg and Grossman 2005). Although in principle, Medicare's ability to modify payment levels can offset the providers' market power and respond to changes in cost structure more generally, resetting relative prices is bureaucratically cumbersome, and the political process gives providers an opportunity to preserve favorable payments. Plans can most effectively bargain for rates in competitive provider markets, whereas when setting rates, TM ignores the degree of competition in local markets. By sending Medicare money to plans and letting plans negotiate with providers, the MA program continues to be able to reduce overpayments to providers, but whether it takes advantage of this, especially when providers are consolidating, remains to be seen.
Like earlier incarnations, the MA program of 2010 continues to buy health plan services on a different basis than does the private sector. Subject to a constraint on a low minimal enrollment, the MA program accepts any willing plan that meets MA participation requirements, as opposed to having plans compete on price and quality to be one of a few select plans operating in each market. It allows the plan to set beneficiaries' premiums (as opposed to the commercial market, in which the employer sets premiums). Medicare also continues to resolve problems related to selection and sorting in a way different from that used in the employer market. Although some states risk-adjust their payments to health plans that participate in Medicaid, their formulas are much simpler than Medicare's (Keenan et al. 2001). Even more strikingly, Medicare's risk-adjustment methodologies in Part C—unlike the methodologies that Medicare developed for hospitals and physicians—have failed the market test; virtually no private payers use formal risk adjustment to pay health plans. (The health insurance exchanges that the Accountable Care Act envisions, however, may well use Medicare's risk adjustment.) We could speculate on the reasons for this. Risk adjustment, of course, is irrelevant to employers that offer only one plan. Larger, self-insured employers that offer several plans can, and do, informally risk-adjust by varying their subsidies to different plans. Because the levels of spending are lower and less variable (in absolute terms) for those under sixty-five, there are weaker incentives to select them. Unlike Medicare, employers contract selectively with plans.
In our view, modifications of Medicare's past policies, such as increasing or decreasing payment rates, improving risk adjustment, or altering open enrollment periods, are unlikely to fundamentally change the outcomes that Medicare can achieve. Saving Medicare money and increasing the choices for beneficiaries will require more profound policy changes. One such change being considered is to turn Medicare into a defined contribution program rather than a defined benefit program, in effect offering beneficiaries a risk-adjusted voucher to be used in TM or MA (Aaron and Reischauer 1995; Domenici, Rivlin, and the Debt Reduction Task Force 2010; Emanuel and Fuchs 2005; National Commission on Fiscal Responsibility and Reform 2010). The voucher would give Medicare a firm figure for its costs for both MA and TM. But the effects of a voucher program on choice and efficiency, and fairness more generally, would depend on the level of the voucher, the formula by which Medicare contributions are set, and the rules determining beneficiaries' contributions. Although this proposal has some support across the political spectrum (with considerably more support from the Right), it seems unlikely to be enacted in the near term.
Medicare might also reconsider its laissez-faire approach to supplemental plans. Although the form of these plans is regulated (and, in some states, regulation extends to premiums), further restrictions on supplemental plans could shift more beneficiaries looking to avoid cost sharing to consider an MA plan. Another radical step for Medicare would be to become substantially more active in structuring the available choices of MA plans, eliminating duplicative, confusing options and promoting choice on dimensions that matter. Medicare could, following private employers, contract with only some plans in a region and use its bargaining power to affect the plans' design and pricing. An analysis of these and other options is beyond the scope of this article. Here we note only that budget pressures are likely to expand the set of the politically feasible options and that new policy analysis of vouchers, beneficiaries' premiums, regulation of supplemental plans, and methods of Medicare procurement all are urgently needed.
The Medicare program is of enormous importance to the elderly in the United States, as it profoundly affects their health, financial status, and overall welfare. It also is of enormous importance to the federal government because of its budgetary impact. In testimony before the Senate Budget Committee, Peter Orszag, then director of the Congressional Budget Office (CBO), stated that “the nation's long-term fiscal balance will be determined primarily by the future rate of health care cost growth” (Orszag 2007). A Medicare Advantage program that is able to thread the policy needle and offer high-quality health plans while saving money has the potential to improve the performance and sustainability of the Medicare program.
Acknowledgments
The authors gratefully acknowledge funding from the National Institutes on Aging through P01 AG032952, The Role of Private Plans in Medicare. Joseph Newhouse wishes to disclose that he is a director of and holds equity in Aetna, which sells Medicare Advantage plans. We thank John Ayanian, Nolan Miller, and Alan Zaslavsky for helpful comments on an earlier draft.
Endnotes
Excellent quantitative summaries of the Part C experience are available from the Medicare Payment Advisory Commission (MedPAC), through its annual reports (http://www.medpac.gov), and from other researchers (e.g., see Gold 2005, 2007, 2009; Zarabozo and Harrison 2009). The Commonwealth Fund and the Kaiser Family Foundation have released several reports describing MA program changes and detailing the trends in plan choices, enrollees' cost sharing, and benefit generosity offered through MA plans over time (see http://www.commonwealthfund.org and http://www.kff.org/medicare/choice.cfm). Several articles analyze and discuss possible policy alternatives that aim to improve the MA program (recent examples are Berenson 2004, 2008; Berenson and Dowd 2009; Biles, Dallek, and Nicholas 2004; Biles, Nicholas, and Guterman 2006; Frakt, Pizer, and Feldman 2009; Pizer, Feldman, and Frakt 2005). Oberlander (2003, 2007) provides historical perspectives putting Part C in the context of federal Medicare legislation.
Previous research identified status quo bias (Samuelson and Zeckhauser 1988; Strombom, Buchmueller, and Feldstein 2002), choice overload (Elbel and Schlesinger 2006, Frank and Lamiraud 2009; Iyengar 2004), mistake aversion (Kunreuther et al. 2002), and, particularly among the elderly, limited cognitive capabilities (Hanoch and Rice 2006), all of which may inhibit effective decision making.
References
- Aaron H, Reischauer R. The Medicare Reform Debate: What Is the Next Step? Health Affairs. 1995;14(4):8–31. doi: 10.1377/hlthaff.14.4.8. [DOI] [PubMed] [Google Scholar]
- Achman L, Gold M. Are the 2004 Payment Increases Helping to Stem Medicare Advantage's Benefit Erosion? The Commonwealth Fund. Commonwealth Fund Publication. 2004 no. 795. [Google Scholar]
- Atherly A. Supplemental Insurance: Medicare's Accidental Stepchild. Medical Care Research and Review. 2001;58(2):131–61. doi: 10.1177/107755870105800201. [DOI] [PubMed] [Google Scholar]
- Balsa AI, Cao Z, McGuire TG. Does Managed Health Care Reduce Health Care Disparities between Minorities and Whites? Journal of Health Economics. 2007;26:1101–21. doi: 10.1016/j.jhealeco.2006.06.001. [DOI] [PubMed] [Google Scholar]
- Barr MS, Foote SM, Krakauer R, Mattingly PH. Lessons for the New CMS Innovation Center from the Medicare Health Support Program. Health Affairs. 2010;29(7):1305–9. doi: 10.1377/hlthaff.2010.0378. [DOI] [PubMed] [Google Scholar]
- Basu J, Mobley LR. Do HMOs Reduce Preventable Hospitalizations for Medicare Beneficiaries? Medical Care Research and Review. 2007;64(5):544–67. doi: 10.1177/1077558707301955. [DOI] [PubMed] [Google Scholar]
- Berenson RA. Medicare Disadvantaged and the Search for the Elusive “Level Playing Field.”. Health Affairs (Millwood) 2004;(Suppl):W572–85. doi: 10.1377/hlthaff.w4.572. Web Exclusives. [DOI] [PubMed] [Google Scholar]
- Berenson RA. From Politics to Policy: A New Payment Approach in Medicare Advantage. Health Affairs. 2008;27(2):w156–64. doi: 10.1377/hlthaff.27.2.w156. [DOI] [PubMed] [Google Scholar]
- Berenson RA, Dowd BE. Medicare Advantage Plans at a Crossroads—Yet Again. Health Affairs. 2009;28(1):w29–40. doi: 10.1377/hlthaff.28.1.w29. [DOI] [PubMed] [Google Scholar]
- Biles B, Dallek G, Nicholas LH. Medicare Advantage: Déjà Vu All Over Again? Health Affairs (Millwood) 2004;(Suppl):W586–97. doi: 10.1377/hlthaff.w4.586. Web Exclusives. [DOI] [PubMed] [Google Scholar]
- Biles B, Nicholas LH, Guterman S. Medicare Beneficiary Out-of-Pocket Costs: Are Medicare Advantage Plans a Better Deal? Commonwealth Fund Issue Brief. 2006;19(927) [PubMed] [Google Scholar]
- Buntin MB, Escarce JJ, Kapur K, Yegian JM, Marquis MS. Trends and Variability in Individual Insurance Products in California. Health Affairs (Millwood) 2003;(Suppl):W3449–59. doi: 10.1377/hlthaff.w3.449. Web Exclusives. [DOI] [PubMed] [Google Scholar]
- Buntin MB, Garber AM, McClellan M, Newhouse JP. The Costs of Decedents in the Medicare Program: Implications for Payments to the Medicare+Choice Plans. Health Services Research. 2004;39(1):111–30. doi: 10.1111/j.1475-6773.2004.00218.x. [DOI] [PMC free article] [PubMed] [Google Scholar]
- CalPERS Health Plan Overview. 2004.
- Casalino LP, Robinson JC. The Evolution of Medical Groups and Capitation in California. Oakland: California HealthCare Foundation; 1997. [Google Scholar]
- Casey M. Serving Rural Medicare Risk Enrollees: HMOs' Decisions, Experiences, and Future Plans. Health Care Financing Review. 1998;20(1):73–81. [PMC free article] [PubMed] [Google Scholar]
- Cawley J, Chernew M, McLaughlin C. HMO Participation in Medicare+Choice. Journal of Economics and Management Strategy. 2005;14(3):543–74. [Google Scholar]
- CBO (Congressional Budget Office) The Long Term Budget Outlook: Fiscal Years 2010 to 2020. Washington, DC: 2010. [Google Scholar]
- Christensen S, Long SH, Rodgers J. Acute Health Care Costs for the Aged Medicare Population: Overview and Policy Options. The Milbank Quarterly. 1987;65(3):397–425. [PubMed] [Google Scholar]
- CMS (Center for Medicare and Medicaid Services) Medicare Managed Care Contract Report, December. 1997. Available at https://www.cms.gov/HealthPlanRepFileData/04_Monthly.asp (accessed April 5, 2011) [Google Scholar]
- Cubanski J, Neuman T, Strollo MK, Damico A, Gonzales R. Supplemental Insurance, Medicare Advantage, and Prescription Drug Coverage: Findings from the Medicare Current Beneficiary Survey, 2006. 2008. Kaiser Family Foundation Chartpack. Available at http://www.kff.org/medicare/upload/7801.pdf (accessed June 11, 2010) [Google Scholar]
- Cutler DM, McClellan M, Newhouse JP. How Does Managed Care Do It? RAND Journal of Economics. 2000;31(3):526–48. [PubMed] [Google Scholar]
- Cutler DM, Sheiner L. Managed Care and the Growth of Medical Expenditures. Frontiers in Health Policy Research. 1998;1:77–115. article 4. [Google Scholar]
- Cutler DM, Zeckhauser R. Anatomy of Health Insurance. In: Culyer AJ, Newhouse JP, editors. Handbook of Health Economics. Amsterdam: North-Holland; 2000. 1A. [Google Scholar]
- Dafny L, Dranove D. Do Report Cards Tell Consumers Anything They Don't Already Know? The Case of Medicare HMOs. RAND Journal of Economics. 2008;39(3):790–821. doi: 10.1111/j.1756-2171.2008.00039.x. [DOI] [PubMed] [Google Scholar]
- Dartmouth Medical School. The Dartmouth Atlas of Health Care, 1999. Chicago: AHA Press; 1999. [Google Scholar]
- Domenici P, Rivlin A, the Debt Reduction Task Force . Restoring America's Future: Reviving the Economy, Cutting Spending and Debt, and Creating a Simple, Pro-Growth Tax System. Washington, DC: Bipartisan Policy Center; 2010. [Google Scholar]
- Dowd B, Christianson J, Feldman R, Wisner C, Klein J. Issues Regarding Health Plan Payments under Medicare and Recommendations for Reform. The Milbank Quarterly. 1992;70(3):423–53. [PubMed] [Google Scholar]
- Dranove D, Simon CJ, White WD. Is Managed Care Leading to Consolidation in Health Care Markets? Health Services Research. 2002;37(3):595–609. doi: 10.1111/1475-6773.00038. [DOI] [PMC free article] [PubMed] [Google Scholar]
- Eggers P. Risk Differential between Medicare Beneficiaries Enrolled and Not Enrolled in an HMO. Health Care Financing Review. 1980;1(3):91–99. [PMC free article] [PubMed] [Google Scholar]
- Eggers P, Prihoda R. Pre-enrollment Reimbursement Patterns of Medicare Beneficiaries Enrolled in “At-Risk” HMOs. Health Care Financing Review. 1982;4(1):55–73. [PMC free article] [PubMed] [Google Scholar]
- Elbel B, Schlesinger M. How Much Choice? Nonlinear Relationships between the Number of Plan Options and the Behavior of Medicare Beneficiaries. 2006. Working Paper, Yale University.
- Emanuel EJ, Fuchs VR. Health Care Vouchers—A Proposal for Universal Coverage. New England Journal of Medicine. 2005;352(12):1255–60. doi: 10.1056/NEJMsb041704. [DOI] [PubMed] [Google Scholar]
- Fisher ES, Wennberg DE, Stukel TA, Gottieb DJ, Lucas FL, Pinder EL. The Implications of Regional Variations in Medical Spending, Part 1: The Content, Quality, and Accessibility of Care. Annals of Internal Medicine. 2003a;138(4):273–87. doi: 10.7326/0003-4819-138-4-200302180-00006. [DOI] [PubMed] [Google Scholar]
- Fisher ES, Wennberg DE, Stukel TA, Gottieb DJ, Lucas FL, Pinder EL. The Implications of Regional Variations in Medical Spending, Part 2: Health Outcomes and Satisfaction with Care. Annals of Internal Medicine. 2003b;138(4):288–98. doi: 10.7326/0003-4819-138-4-200302180-00007. [DOI] [PubMed] [Google Scholar]
- Frakt AB, Pizer SD, Feldman R. Payment Reduction and Medicare Private Fee-for-Service Plans. Health Care Financing Review. 2009;30(3):15–24. [PMC free article] [PubMed] [Google Scholar]
- Frank RG, Lamiraud K. Choice, Price Competition and Complexity in Markets for Health Insurance. Journal of Economic Behavior and Organization. 2009;71(2):550–62. [Google Scholar]
- Frank RG, Zeckhauser RJ. Health Insurance Exchanges—Making the Markets Work. New England Journal of Medicine. 2009;361(12):1135–37. doi: 10.1056/NEJMp0906246. [DOI] [PubMed] [Google Scholar]
- FTC (Federal Trade Commission) San Francisco's Brown & Toland Medical Group Settles FTC Price Fixing Charges. 2004. FTC press release, February 9.
- Ginsburg P, Grossman J. When the Price Isn't Right: How Inadvertent Payment Incentives Drive Medicare. Health Affairs. 2005;W5:376–84. doi: 10.1377/hlthaff.w5.376. Aug 9. [DOI] [PubMed] [Google Scholar]
- Glazer J, McGuire TG. Multiple Payers, Commonality, and Free-Riding in Health Care: Medicare and Private Payers. Journal of Health Economics. 2002;21(6):1049–69. doi: 10.1016/s0167-6296(02)00078-4. [DOI] [PubMed] [Google Scholar]
- Glied SA. Managed Care. In: Culyer AJ, Newhouse JP, editors. Handbook of Health Economics. Amsterdam: North-Holland; 2000. pp. 707–53. [Google Scholar]
- Gold M. Private Plans in Medicare: Another Look. Health Affairs. 2005;24(5):1302–10. doi: 10.1377/hlthaff.24.5.1302. [DOI] [PubMed] [Google Scholar]
- Gold M. Medicare Advantage in 2006–2007: What Congress Intended? Health Affairs. 2007;26(4):w445–55. doi: 10.1377/hlthaff.26.4.w445. [DOI] [PubMed] [Google Scholar]
- Gold M. Medicare's Private Plans: A Report Card on Medicare Advantage. Health Affairs. 2009;28(1):w41–54. doi: 10.1377/hlthaff.28.1.w41. [DOI] [PubMed] [Google Scholar]
- Gold M, Achman L, Mittler J, Stevens B. Monitoring Medicare+Choice: What Have We Learned? Findings and Operational Lessons for Medicare Advantage. Washington, DC: 2004. Mathematica Policy Research, doc. no. PR04–43. [Google Scholar]
- Hanoch Y, Rice T. Can Limiting Choice Increase Social Welfare? The Elderly and Health Insurance. The Milbank Quarterly. 2006;84(1):37–73. doi: 10.1111/j.1468-0009.2006.00438.x. [DOI] [PMC free article] [PubMed] [Google Scholar]
- Health Maintenance Organization Act of 1973. Pub L. no 93–222.
- Iyengar S. How Much Choice Is Too Much?: Determinants of Individual Contributions in 401K Retirement Plans. In: Mitchell OS, Utkus SP, editors. Pension Design and Structure: New Lessons from Behavioral Finance. New York: Oxford University Press; 2004. pp. 83–96. [Google Scholar]
- Kane CK, Loeblich H. Physician Income: The Decade in Review. In: Wassenaar J, Thran S, editors. Physician Socioeconomic Statistics 2003. Chicago: American Medical Association; 2003. pp. 5–11. [Google Scholar]
- Keenan PS, Buntin MJB, McGuire TG, Newhouse JP. The Prevalence of Formal Risk Adjustment in Health Plan Purchasing. Inquiry. 2001;38(3):245–59. doi: 10.5034/inquiryjrnl_38.3.245. [DOI] [PubMed] [Google Scholar]
- KFF/HRET (Kaiser Family Foundation and Health Research and Educational Trust) Employer Health Benefits 2005 Annual Survey. 2005. Available at http://www.kff.org/insurance/7315.cfm (accessed June 14, 2010)
- KFF/HRET (Kaiser Family Foundation and Health Research and Educational Trust) Employer Health Benefits 2009 Annual Survey Chart Pack. 2009 Available at http://ehbs.kff.org/2009.html?CFID=23770268&CFTOKEN=78783897&jsessionid=6030b25b244dcc2da8b6361f3c4f281d7865 (accessed March 31, 2011) [Google Scholar]
- Kunreuther H, Meyer R, Zeckhauser R, Slovic P, Schwartz B, Schade C, Luce MF, Lippman S, Krantz D, Kahn B, Hogarth R. High Stakes Decision Making: Normative, Descriptive and Prescriptive Considerations. Marketing Letters. 2002;13(3):259–68. [Google Scholar]
- Landon BE, Zaslavsky AM, Bernard SL, Cioffi MJ, Cleary PD. Comparison of Performance of Traditional Medicare vs. Medicare Managed Care. JAMA. 2004;291(14):1744–52. doi: 10.1001/jama.291.14.1744. [DOI] [PubMed] [Google Scholar]
- Langwell KM, Hadley JP. Evaluation of the Medicare Competition Demonstrations. Health Care Financing Review. 1989;11(2):65–80. [PMC free article] [PubMed] [Google Scholar]
- Luft HS. How Do Health Maintenance Organizations Achieve Their “Savings”? Rhetoric and Evidence. New England Journal of Medicine. 1978;298(24):1336–53. doi: 10.1056/NEJM197806152982404. [DOI] [PubMed] [Google Scholar]
- Luft HS. Health Maintenance Organizations and the Rationing of Medical Care. Health and Society. 1982;60(2):268–306. [PubMed] [Google Scholar]
- Manning WG, Leibowitz A, Goldberg GA, Rogers WH, Newhouse JP. A Controlled Trial of the Effect of a Prepaid Group Practice on the Utilization of Medical Services. Santa Monica, CA: RAND Corporation, pub. no. R-3029-HHS; 1985. [Google Scholar]
- McCall N, Cromwell J, Urato C, Rabiner D. Evaluation of Phase I of the Medicare Health Support Pilot Program under Traditional Fee-for-Service Medicare: 18-Month Interim Analysis. Report to Congress. Research Triangle Park, NC: Research Triangle Institute; 2008. [Google Scholar]
- MedPAC (Medicare Payment Advisory Commission) Report to the Congress: Medicare Payment Policy, March. Washington, DC: 1998. [Google Scholar]
- MedPAC (Medicare Payment Advisory Commission) Report to the Congress: Improving Risk Adjustment in Medicare. Washington, DC: 2000. [Google Scholar]
- MedPAC (Medicare Payment Advisory Commission) Report to the Congress: Medicare in Rural America. Washington, DC: 2001. [Google Scholar]
- MedPAC (Medicare Payment Advisory Commission) Report to Congress: Promoting Greater Efficiency in Medicare. Washington, DC: 2007. [Google Scholar]
- MedPAC (Medicare Payment Advisory Commission) A Data Book: Health Care Spending and the Medicare Program. Washington, DC: 2009a. [Google Scholar]
- MedPAC (Medicare Payment Advisory Commission) Report to the Congress: Improving Incentives in the Medicare Program. Washington, DC: 2009b. [Google Scholar]
- MedPAC (Medicare Payment Advisory Commission) Report to Congress: Medicare Payment Policy. Washington, DC: 2009c. [Google Scholar]
- MedPAC (Medicare Payment Advisory Commission) A Data Book: Healthcare Spending and the Medicare Program. Washington, DC: 2010a. [Google Scholar]
- MedPAC (Medicare Payment Advisory Commission) Report to the Congress: Aligning Incentives in Medicare. Washington, DC: 2010b. [Google Scholar]
- MedPAC (Medicare Payment Advisory Commission) Report to Congress: Medicare Payment Policy. Washington, DC: 2010c. [DOI] [PubMed] [Google Scholar]
- Merlis M. Medicare Advantage Payment Policy, September 24. Washington, DC: National Health Policy Forum; 2007. [Google Scholar]
- Morrisey MA. Health Insurance. Chicago: Health Administration Press; 2008. [Google Scholar]
- Moscovice I, Casey M, Klein S. Expanding Rural Managed Care: Enrollment Patterns and Prospects. Health Affairs. 1998;17(1):172–79. doi: 10.1377/hlthaff.17.1.172. [DOI] [PubMed] [Google Scholar]
- National Commission on Fiscal Responsibility and Reform. The Moment of Truth: Report of the National Commission on Fiscal Responsibility and Reform. Washington, DC: White House; 2010. [Google Scholar]
- Newhouse JP. Pricing the Priceless: A Health Care Conundrum. Cambridge, MA: MIT Press; 2002. [Google Scholar]
- Newhouse JP, the Insurance Experiment Group . Free for All? Lessons from the RAND Health Insurance Experiment. Cambridge, MA: Harvard University Press; 1993. [Google Scholar]
- Newhouse JP, Manning WG, Keeler EB, Sloss EM. Adjusting Capitation Rates Using Objective Health Measures and Prior Utilization. Health Care Financing Review. 1989;10(3):41–54. [PMC free article] [PubMed] [Google Scholar]
- Norwalk L. CMS Acting Administrator. 2007. Testimony before House Ways and Means Committee, March 21.
- Oberlander JB. Managed Care and Medicare Reform. Journal of Health Politics, Policy and Law. 1997;22(2):595–631. doi: 10.1215/03616878-22-2-595. [DOI] [PubMed] [Google Scholar]
- Oberlander J. Is Premium Support the Right Medicine for Medicare? Health Affairs. 2000;19:84–99. doi: 10.1377/hlthaff.19.5.84. September/October. [DOI] [PubMed] [Google Scholar]
- Oberlander JB. The Political Life of Medicare. Chicago: University of Chicago Press; 2003. [Google Scholar]
- Oberlander JB. Through the Looking Glass: The Politics of the Medicare Prescription Drug, Improvement, and Modernization Act. Journal of Health Politics, Policy and Law. 2007;32(2):187–219. doi: 10.1215/03616878-2006-036. [DOI] [PubMed] [Google Scholar]
- OPM (Office of Personnel Management) Insurance Operations: Quality Benefits for the Federal Family. 2004. Available at http://www.opm.gov/insure/ (accessed April 1, 2011)
- Orszag PR. Health Care and the Budget: Issues and Challenges for Reform. 2007. Testimony before House Committee on the Budget, June 21.
- Patient Protection and Affordable Care Act, Pub L. no. 111–148, 124 Stat 119. 2010.
- Physician Payment Review Commission. Annual Report to Congress. Washington, DC: 1995. [Google Scholar]
- Physician Payment Review Commission. Annual Report to Congress. Washington, DC: 1996. [Google Scholar]
- Physician Payment Review Commission. Annual Report to Congress. Washington, DC: 1997. [Google Scholar]
- Pizer SD, Feldman R, Frakt AB. Defective Design: Regional Competition in Medicare. Health Affairs (Millwood) 2005:399–411. doi: 10.1377/hlthaff.w5.399. Suppl Web Exclusives(w5) [DOI] [PubMed] [Google Scholar]
- Pope GC, Kautter J, Ellis RP, Ash AS, Ayanian JZ, Lezzoni LI, Ingber MJ, Levy JM, Robst J. Risk-Adjustment of Medicare Capitation Payments Using the CMS-HCC Model. Health Care Financing Review. 2004;25(4):119–41. [PMC free article] [PubMed] [Google Scholar]
- Prospective Payment Assessment Commission. Medicare and the American Health Care System: Report to the Congress, June 1997. Washington, DC: 1997. [Google Scholar]
- Re: Managed Care Litigation. MDL no. 1334, 00–1334-MD-Moreno. 2006a.
- Re: Managed Care Litigation. S.D. Fla MDL no. 1334. 2006b. Settlement approved on December 31, 2005.
- Riley G, Zarabozo C. 2006/2007. Trends in the Health Status of Medicare Risk Contract Enrollees. Health Care Financing Review. 2006;28(2):81–95. [PMC free article] [PubMed] [Google Scholar]
- Robinson JC. Health Care Purchasing and Market Changes in California. Health Affairs. 1995;14(4):117–30. doi: 10.1377/hlthaff.14.4.117. [DOI] [PubMed] [Google Scholar]
- Rothschild M, Stiglitz J. Equilibrium in Competitive Insurance Markets: An Essay on the Economics of Imperfect Information. Quarterly Journal of Economics. 1976;90(4):629–49. [Google Scholar]
- Samuelson W, Zeckhauser R. Status Quo Bias in Decision Making. Journal of Risk and Uncertainty. 1988;1(1):7–59. [Google Scholar]
- Shimada SL, Zaslavsky AM, Zaborski LB, O'Malley AJ, Heller A, Cleary PD. Market and Beneficiary Characteristics Associated with Enrollment in Medicare Managed Care Plans and Fee-for-Service. Medical Care. 2009;47(5):517–23. doi: 10.1097/MLR.0b013e318195f86e. [DOI] [PubMed] [Google Scholar]
- Strombom BA, Buchmueller TC, Feldstein PJ. Switching Costs, Price Sensitivity and Health Plan Choice. Journal of Health Economics. 2002;21(1):89–116. doi: 10.1016/s0167-6296(01)00124-2. [DOI] [PubMed] [Google Scholar]
- Trivedi AN, Zaslavsky AM, Schneider EC, Ayanian JZ. Relationship between Quality of Care and Racial Disparities in Medicare Health Plans. JAMA. 2006;296(16):1998–2004. doi: 10.1001/jama.296.16.1998. [DOI] [PubMed] [Google Scholar]
- Verdier J, Gold M, Davis S. Do We Know If Medicare Advantage Special Needs Plans Are Special? 2008 Kaiser Family Foundation pub. no. 7729. Available at http://www.kff.org/medicare/7729.cfm (accessed March 30, 2011) [Google Scholar]
- Welch WP. Growth in HMO Share of the Medicare Market, 1989–1994. Health Affairs. 1996;15(3):201–14. doi: 10.1377/hlthaff.15.3.201. [DOI] [PubMed] [Google Scholar]
- Young C. Operational Insights no. 10. Washington, DC: Mathematica Policy Research; 2003. Markets Stagnate: Views from the Field, 2003, Monitoring Medicare+Choice. [Google Scholar]
- Zarabozo C. Milestones in Medicare Managed Care. Health Care Financing Review. 2000;22(1):61–67. [PMC free article] [PubMed] [Google Scholar]
- Zarabozo C. Advising the Congress on Medicare Issues: Update on Quality in Medicare Advantage, November 9. Washington, DC: Medicare Payment Advisory Commission; 2007. [Google Scholar]
- Zarabozo C, Harrison S. Payment Policy and the Growth of Medicare Advantage. Health Affairs. 2009;28(1):w55–67. doi: 10.1377/hlthaff.28.1.w55. [DOI] [PubMed] [Google Scholar]
- Zhang Y, Baicker K, Newhouse JP. Geographic Variation in Medicare Drug Spending. New England Journal of Medicine. 2010;363(5):405–9. doi: 10.1056/NEJMp1004872. [DOI] [PMC free article] [PubMed] [Google Scholar]