Abstract
Accurate tertiary structures are very important for the functional study of non-coding RNA molecules. However, predicting RNA tertiary structures is extremely challenging, because of a large conformation space to be explored and lack of an accurate scoring function differentiating the native structure from decoys. The fragment-based conformation sampling method (e.g. FARNA) bears shortcomings that the limited size of a fragment library makes it infeasible to represent all possible conformations well. A recent dynamic Bayesian network method, BARNACLE, overcomes the issue of fragment assembly. In addition, neither of these methods makes use of sequence information in sampling conformations. Here, we present a new probabilistic graphical model, conditional random fields (CRFs), to model RNA sequence–structure relationship, which enables us to accurately estimate the probability of an RNA conformation from sequence. Coupled with a novel tree-guided sampling scheme, our CRF model is then applied to RNA conformation sampling. Experimental results show that our CRF method can model RNA sequence–structure relationship well and sequence information is important for conformation sampling. Our method, named as TreeFolder, generates a much higher percentage of native-like decoys than FARNA and BARNACLE, although we use the same simple energy function as BARNACLE.
Contact: zywang@ttic.edu; j3xu@ttic.edu
Supplementary Information: Supplementary data are available at Bioinformatics online.
1 INTRODUCTION
RNA has become an important research subject in recent years, and there is an increasing study of non-coding RNA in biology and health. Its growing important role appears in various life domains and processes, including regulating gene expression (Backofen et al., 2007; Hiller et al., 2007; Ray et al., 2009; Solnick, 1985), interaction with other ligands (Badorrek et al., 2006; Buck et al., 2005) and stabilizing itself (Reymond et al., 2009). To elucidate the function of an RNA molecule, it is essential to determine its 3D structure. However, there are a great number of RNA sequences without solved structures. Experimental methods for RNA 3D structure determination are time-consuming, expensive and sometimes technically challenging. By far, there are ~29 million RNA molecules with (predicted) secondary structure in the Rfam database (Gardner et al., 2009), but only 4816 of them have tertiary structures in the nucleotide database (Berman et al., 1992). Therefore, we have to fill this large gap by predicting the 3D structure of an RNA using computational methods.
RNA tertiary structure prediction does not gain as much attention as secondary structure prediction (Akutsu, 2000; Alkan et al., 2006; Backofen et al., 2009; Bindewald and Shapiro, 2006; Eddy and Durbin, 1994; Ferretti and Sankoff, 1989; Gardner and Giegerich, 2004; Hamada et al., 2009; Havgaard et al., 2007; Hofacker, 2003; Knudsen and Hein, 2003; Mathews, 2006; Mathews and Turner, 2002; Mathews and Turner, 2006; Poolsap et al., 2009; Will et al., 2007; Zhang et al., 2008; Zuker, 2003; Zuker and Sankoff, 1984). Both molecular dynamic methods (Bindewald and Shapiro, 2006; Hajdin et al., 2010; Sharma et al., 2008) and knowledge-based statistical methods (Das and Baker, 2007; Das et al., 2010; Frellsen et al., 2009) have been proposed to fold RNA molecules. The knowledge-based statistical methods for RNA tertiary structure prediction consist of two major components: an algorithm for conformation sampling and an energy function for differentiating the native structure from decoys. Fragment assembly, a knowledge-based method widely used for protein structure prediction (Haspel et al., 2003; Lee et al., 2004; Simons et al., 1997), has been implemented in FARNA (Das and Baker, 2007) for RNA 3D structure prediction. However, this method has a couple of limitations: (i) there is no guarantee that any region of an RNA structure can be accurately covered by structure fragments in the RNA solved structure database, which currently contains only a limited number of non-redundant solved RNA structures; and (ii) sequence information is not employed in FARNA for conformation sampling. MC-Sym (Parisien and Major, 2008) is a motif assembly method for RNA 3D structure prediction, which uses a library of nucleotides cyclic motifs (NCM) to construct an RNA structure. MC-Sym has a time complexity exponential with respect to RNA length (i.e. the number of nucleotides), so MC-Sym may not be used to predict the tertiary structure for a very large RNA. As reported in Laing and Schlick (2010), MC-Sym also fails in the case when the secondary structure of RNA lacks cyclic motifs. Recently, Frellsen et al. (2009)have proposed a probabilistic model (BARNACLE) of RNA conformation space. BARNACLE uses a dynamic Bayesian network (DBN) to model RNA structures, but this DBN method does not take into consideration any sequence information. In addition, BARNACLE models the interdependency between the local conformations of only two adjacent nucleotides, but not of more nucleotides. Other RNA three dimensional structure prediction methods can be found in Abraham et al. (2008); Das and Baker (2007); Das et al. (2010); Ding et al. (2008); Flores et al. (2010); Frellsen et al. (2009); Gillespie et al. (2009); Hajdin et al. (2010); Jonikas et al. (2009); Laing and Schlick (2010); Parisien and Major (2008); Sharma et al. (2008); Tang et al. (2005); Wexler et al. (2006).
This article presents a novel probabilistic method conditional random fields (CRFs) (Lafferty et al., 2001) to model RNA sequence–structure relationship. Different from BARNACLE modeling only RNA structures, our CRF method models the sophisticated relationship among primary sequence, secondary structure and 3D structure, which enables us to more accurately estimate the probability of RNA conformations from its primary sequence and thus sample RNA conformations more efficiently.
We have already successfully applied CRF to model protein sequence–structure relationship and conformation sampling (Zhao et al., 2008, 2009, 2010). However, our CRF method for proteins cannot be directly applied to RNA. In order to apply CRF to RNA modeling, we have to employ a different method to represent an RNA 3D structure and model RNA bond torsion angles. We also have to face the challenge that there are a lot fewer solved RNA structures than the solved protein structures for CRF model training. By exploiting the secondary structure information of an RNA molecule, we have also developed a novel tree-based sampling scheme that can simultaneously sample conformations for two segments far away from each other along the RNA sequence. In contrast, our protein conformation sampling method can sample conformations for only one short segment at a given time. Finally, we also have to employ a totally different energy function for RNA folding. To the best of our knowledge, CRF has also been applied to RNA secondary structure prediction (Do et al., 2006) and alignment (Sato and Sakakibara, 2005), but not modeling the relationship between RNA sequence and 3D structure.
Our method TreeFolder is more effective in sampling native-like decoys than FARNA and BARNACLE, although we use the same simple energy function as BARNACLE, which contains only base-pairing information. Tested on 11 RNA molecules, TreeFolder obtains much better decoys for most of them. Our results imply that TreeFolder models RNA sequence–structure relationship well, which it is feasible to sample RNA conformations without using fragments and that sequence information is important for RNA conformation sampling. Experiments also show that TreeFolder works well with predicted secondary structures generated by tools such as CONTRAfold (Do et al., 2006).
2 METHODS
2.1 Representation of an RNA structure and conformation state
We can represent an RNA 3D structure using a sequence of torsion angles, as shown in Figure 1. Every nucleotide has in total seven bonds that rotate freely. Six of them lie on the backbone: P–O5′, O5′−C5′, C5′−C4′, C4′−C3′, C3′−O3′ and O3′−P. The seventh bond connects a base to atom C1′. As shown in Figure 2 torsion χ around the seventh bond has a small variance, so we assume that it is independent of the other angles and has a normal distribution. The planar angles between two adjacent bonds on the backbone are almost constants, so are the lengths of the bonds.
Fig. 1.
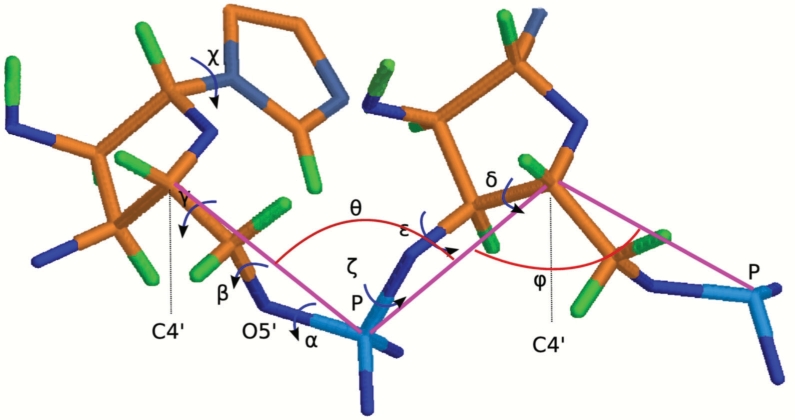
Conformation of a nucleotide is represented by angles.
Fig. 2.
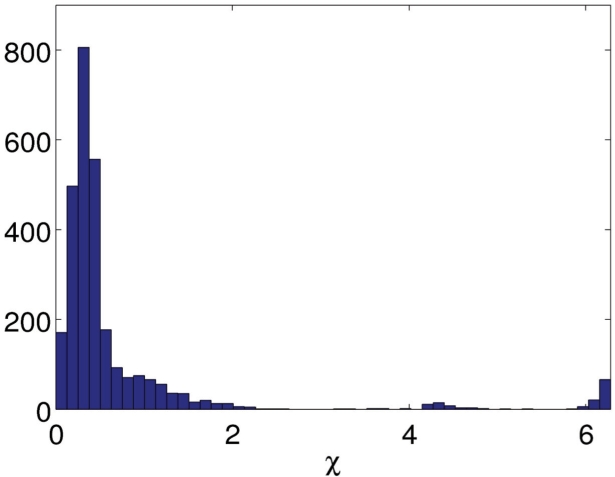
Empirical distribution of the torsion angle χ collected from the all representative RNA structures (see Section 2.4).
We use a simplified representation so that we can reduce the number of torsion angles needed for the local conformation of a nucleotide (Cao and Chen, 2005; Duarte and Pyle, 1998; Hershkovitz et al., 2006; Zhang et al., 2008). In particular, we use the torsions τ1 and τ2 on pseudo-bonds P−C4′ and C4′ –P (see pink lines in Figure 1). However, to determine coordinates of the six backbone atoms of a nucleotide, we also need two planar angles θ, ψ and another torsion α on bond P−O5′. Overall, we use a five tuple (τ1, τ2, θ, ψ, α) to represent the local conformation of a nucleotide. The torsion angles are separated in several groups in the whole angle space, as shown in Figure 3. Although there are many different methods to represent an RNA conformation, this simplified representation enables us to rapidly rebuild backbone atoms from angles. Similar representations have also been extensively adopted by previous works (Cao and Chen, 2005; Duarte and Pyle, 1998; Hershkovitz et al., 2006; Zhang et al., 2008).
Fig. 3.
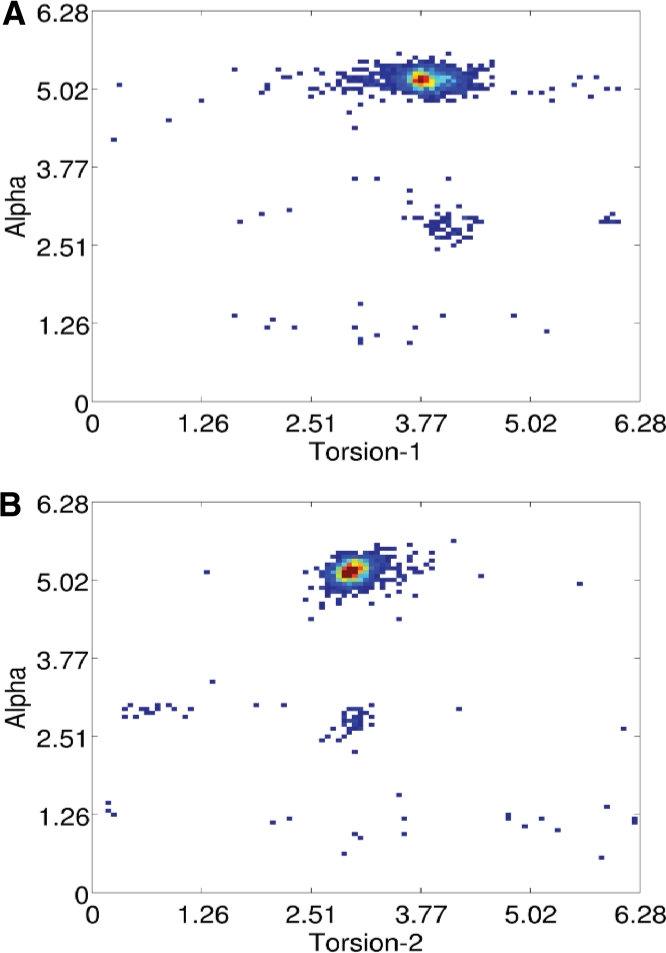
(A) Empirical distribution density of the torsion (τ1) on the pseudo−bond C4′-−P and α. (B) Distribution density of the torsion (τ2) on the pseudo−bond P-C4′ and α. The empirical distributions are built from all representative RNA structures (see Section 2.4).
Our simplified representation does not lose much accuracy: given the torsion angles, we can rebuild the atom coordinates of an RNA molecule with very good accuracy. As shown in Table 1, the structures rebuilt from the native angle values (assuming the bond lengths are constants) have RMSD <1 Å from; their natives.
Table 1.
Accuracy of the structures rebuilt from the native torsion angles, assuming the bond lengths are constants
| PDB ID | RMSD | PDB ID | RMSD |
|---|---|---|---|
| 1esy | 0.77 | 1xjr | 0.55 |
| 1kka | 0.35 | 1zih | 0.22 |
| 1l2x | 0.41 | 28sp | 1.00 |
| 1q9a | 0.28 | 2a43 | 0.34 |
Conformation state: we use a Gaussian distribution to describe the local conformation preference of one nucleotide. First, we cluster all the angles collected from the experimental structures into dozens of groups (20~100). Then, we calculate the mean and variance in each group and model the angle distribution, using Gaussian distribution. Each group (or cluster) and its Gaussian distribution are identified by an index, which is also denoted as a conformation state. Given the conformation state of a nucleotide, we can sample its real-valued angles from the corresponding distribution. Note that to make angle sampling easy and fast, we assume the torsion angles are independent of one another in Gaussian distribution. Later we will show how to empirically determine the best number of conformation states to achieve the best sampling performance.
2.2 CRF model for RNA sequence–structure relationship
Our CRF method can estimate the probability of an RNA conformation from the primary sequence and secondary structure. A CRF model consists of two major components: input features and output labels. The input features at each nucleotide include its nucleotide types, base pairing states and its neighbor nucleotide types. The input features are encoded as a vector of binary variables. The base pairing states can be predicted using some secondary structure prediction programs (Akutsu, 2000; Do et al., 2006; Eddy and Durbin, 1994; Gardner and Giegerich, 2004; Knudsen and Hein, 2003; Mathews and Turner, 2006; Poolsap et al., 2009; Zuker, 2003) with reasonable accuracy. The base pairing information can also be obtained using some experimental methods (Gewirth et al., 1987; Wohnert et al., 1999; Zwahlen et al., 1997), which are much less expensive than those methods determining RNA tertiary structures. The output label at each nucleotide is a conformation state (also called label in CRF). It is also the index of the cluster which the angles at this nucleotide belongs to.
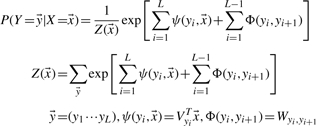
In contrast to BARNACLE (Frellsen et al., 2009) estimating the generative probability of an RNA structure, our CRF model estimates the conditional probability of an RNA structure, represented as a conformation state vector y, from the input feature vector x as follows.
 |
(1) |
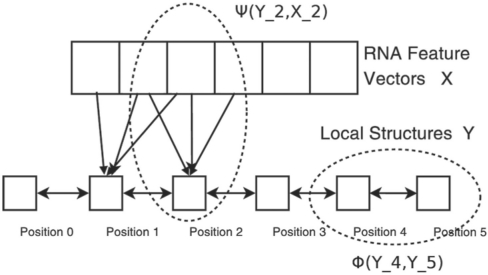
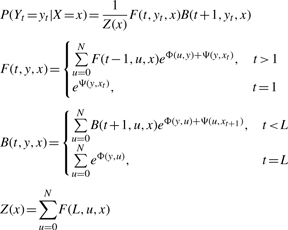
Meanwhile, Z(x) is the partition function; xi is the feature vector at position i; yi is the label at position i; Wi,j is the weight for transition from state i−j; Vi is the weight factor for predicting state i from an input feature x; L is the length of RNA, i.e. the number of nucleotides. The function ψ describes dependency between a conformation state and the input features and thus, called a label feature function. The function Φ describes dependency between two adjacent states and thus called an edge feature function.
Figure 4 shows a linear-chain CRF model for the sequence–structure relationship of an artificial RNA with five nucleotides. We also extend ψ to a linear combination of features of the adjacent nucleotides in a sliding window. That is, ψ is a linear function of  , WL is the window size to be determined later.
Fig. 4.
A linear-chain CRF model describes the RNA sequence–structure relationship. The input feature vector X contains sequence information and the label (state) vector Y contains local conformation states.
Once the CRF model is trained, we can calculate the (marginal) probability of a conformation state at a given position, using the forward–backward algorithm as follows.
 |
We train our CRF model by maximizing the occurring probability of a set of training RNAs with solved structures. In order to avoid overfitting, we also enforce regularization on the model parameters. As such, we train the model parameters by maximizing the following regularized log-likelihood.
Meanwhile, yk and xk are the conformation state vector and input feature vector of the k-th training RNA, W and V are model parameters defined in Equation (1) and λ and μ are the regularization factors. This maximization problem can be solved to optimal using the L-BFGS algorithm (Liu and Nocedal, 1989).
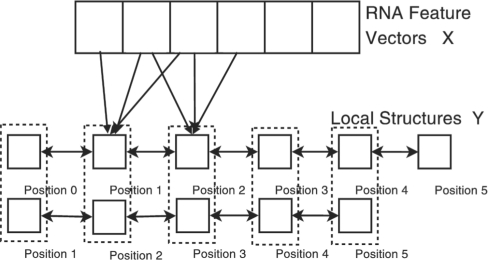
We also extend the first-order CRF model to the second-order model so that we can capture dependency among three adjacent nucleotides. As in Figure 5, two adjacent positions are combined to a single super node. All the algorithms for the first-order CRF model can be easily extended to the second-order model.
Fig. 5.
The second-order CRF model describes RNA sequence–structure relationship. A super node in this model contains the conformation states in two adjacent positions.
2.3 A tree-guided conformation sampling algorithm
Once the CRF model is trained, we can use it to sample conformations for a segment in an RNA molecule. By combining this segment conformation sampling algorithm with a tree representation of the RNA base pairing information, we can have a tree-guided conformation sampling scheme, which enables us to sample conformations for two segments far away from each other along the sequence.
Building a guide tree for conformation sampling: the guide tree represents the base pairing information in an RNA, which can be predicted using a secondary structure prediction method or determined by experimental methods. In the case of pseudo-knots, we remove the minimal number of base pairings so that a tree can be built. Since the pseudo-knots do not occur frequently, removal of a small number of base pairings does not impact our method. Note that all the base pairings are taken into consideration in calculating the energy of a sampled conformation. Therefore, removal of some base pairs in tree construction will not impact the formation of pseudo-knots, since we also use energy function to guide the folding simulation. Given the base pairing information, we build a guide tree as follows. The root node in the tree corresponds to the whole RNA. Given a base pair (i, j), we have one node in the tree corresponding to the segment between i and j. One node A is the child of the other node B if and only if the segment corresponding to B is the minimal segment containing the segment corresponding to A. In case that one node has more than two child nodes, we can always add some intermediate nodes so that any node has at most two child nodes. For example, supposing node B, corresponding to segment (i, j), has three child nodes A1, A2 and A3, where Ak corresponds to segment (ik, jk) and i<i1<j1<i2<j2<i3<j3<j. We can add an intermediate node C for segment (i1, j2) so that C becomes the parent node of A1 and A2 and B has only two child nodes A3 and C.
Segment conformation sampling algorithm: This sampling algorithm consists of two steps: sampling a label for each nucleotide, in the segment, by the probability calculated from the CRF model and sampling real-valued angles from Gaussian distribution corresponding to a label. We use a forward–backward algorithm to sample the label sequence of a segment from position i to j. The algorithm iteratively draws a conformation label of the last position from the conditional probability as follows.
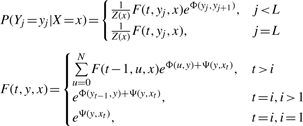 |
Meanwhile, Z(x) is the partition function and can be calculated using the forward–backward algorithm. After the conformation state at position j is sampled, the algorithm replaces j by j−1 and repeats the sampling process until position i is sampled. Once the labels of the segment are sampled, we can sample the real-valued angles from the Gaussian distribution associated with a label.
Folding simulation: the folding simulation begins with a heating up process, in which we repeatedly sample conformations for the whole RNA using the above-mentioned segment conformation sampling algorithm. This heating up procedure terminates if one conformation without steric clashes is generated. In our experiments, we usually can obtain a conformation without clashes very quickly, which is used as the initial conformation of the simulated annealing optimization (Andrieu et al., 2003; Zhao et al., 2010).
To resample conformations of an RNA, we build a conformation sampling guide tree based upon the base pairing information in the RNA and all the nodes in the tree are marked as ‘undone’. The torsion angles of the RNA are resampled using a bottom-up method along the tree as follows. We randomly pick up an ‘undone’ node A in the tree, which is either a leaf node or a node with all the child nodes being marked as ‘done’.
If A is a leaf node, we resample the angles for the segment corresponding to A using the segment conformation sampling algorithm.
If A has one or two child nodes, by cutting out the segments corresponding to the child nodes, we have at most three separate segments left in A, for which we use the segment conformation sampling algorithm to generate angles separately.
The new conformation is accepted if its energy is lower. Otherwise it is accepted by a probability exp (ΔE/T), where ΔE is the energy difference between current and the new conformations and T is the annealing temperature. This sampling procedure is repeated 3000 times and then node A is marked as ‘done’. The folding simulation process ends when the root node is marked as ‘done’.
Energy function: different from the complex energy function in FARNA, we adopt a simple energy function used by BARNACLE (Frellsen et al., 2009) as follows.
where H is the number of hydrogen bonds formed in the secondary structure (every A–U and G–U pair contributes two distances, and every C–G pair contributes three distances),  is the distance between the donor and the acceptor of the k-th hydrogen bond and dk is the average length of hydrogen bonds of the same type. The smaller this value is, the more the decoy is consistent with its secondary structure. The energy is measured in Å, and the ideal base pair energy of 0 Å is only obtained for conformations with perfect base paring.
We employ such a simple energy function (without any tuned parameters) so that we can carefully examine the performance of our sampling algorithm and perform a well-controlled comparison with other sampling methods such as BARNACLE. More sophisticated energy items, such as Mg2+ ion interaction and stacking effect of base pairs, can be taken into account in future study.
2.4 CRF model training
Training data: we build our training dataset from the RNA structure classification database DARTS (Abraham et al., 2008), which collects 244 structures representing 1333 solved RNA structures and groups them into 94 clusters. Our training set comes from the 94 cluster representative structures, which have ~6000 nucleotides in total. We use all 94 cluster representative structures to build empirical distributions of bond torsion angles. To make sure our training dataset does not overlap with the 11 benchmark RNA molecules, we exclude the representative structures in the same cluster as the 11 benchmark RNA. With the remaining 83 structures, we use 3-fold cross-validation to determine the CRF model regularization factors λ and μ and the proper window size. In each fold validation, two thirds of structures are used for training and the remaining for test.
Model selection: the (training/test) accuracy of a second-order CRF model is defined as the number of correctly predicted states divided by the total number of positions. Fixing the number of conformation states in a CRF model, we search for the appropriate regularization factors and window size using a grid search strategy. As shown in the Supplement Figure 1, the CRF model with 50 conformation states has the best performance when λ=5, μ=10 and window size=5. We choose these parameters to maximize accuracy and avoid overfitting. Supplement Figure 1 shows that a larger window size does not improve the test accuracy significantly, but increase the accuracy gap between the training and test data, which might indicate overfitting.
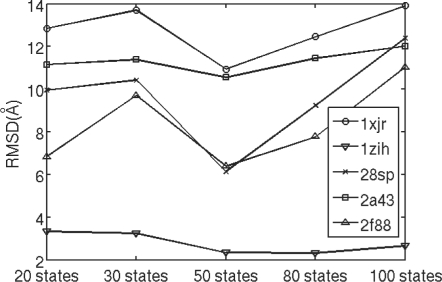
We also investigate the sampling performance of the CRF model with respect to the number of conformation states. We tested our CRF models with 20, 30, 50, 80 and 100 conformation states. For each CRF model, we generate 3000 decoys for each of the five RNAs: 2a43, 28sp, 2f88, 1zih and 1xjr. Figure 6 shows the 5% quantiles of the RMSD distributions for decoys generated by four different CRF models. As shown in Figure 6, the model with 50 states generates better decoys than others.
Fig. 6.
The 5% quantiles of the RMSD distributions for decoys sampled from the CRF models with different number of conformation states. Y-axis is the RMSD value.
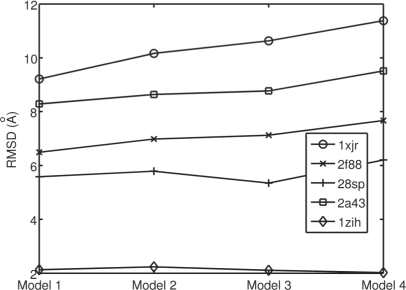
Using different methods to model the distribution of torsion, χ , makes a slight difference on the quality of sampled decoys. Figure 7 shows the 5% quantiles of RMSD values for 300 decoys sampled using four different χ distributions with a well-trained CRF model. In Model 1, we fix χ as the mean of the training data. Model 2 samples χ from a log normal distribution. Model 3 samples χ from a normal distribution. Model 4 uses sample χ directly from the training data without using any mathematical modeling. Finally, we decide to use the normal distribution for χ, to yield a bit of variance.
Fig. 7.
The 5% quantiles of the RMSD distributions for decoys sampled from models with different distributions of torsion χ. Model 1 uses a fixed value of χ. Model 2 uses log normal distribution. Model 3 is the normal distribution. Model 4 is the empirical distribution of all values in training data. Models 2 and 3 are fit from all training data.
3 RESULTS
We use 11 RNAs tested by both BARNACLE and FARNA to benchmark our method TreeFolder. These RNAs contain 12~46 nucleotides and are not homologous to any structures in our training dataset. In case an RNA has multiple NMR structures, we use the first structure in the PDB file as its native structure.
It is not very reliable to compare two methods simply using the decoys with the lowest RMSD, since they may be generated by chance and also depend on the number of decoys to be generated. The more decoys are generated, the more likely the lowest-RMSD decoy has lower RMSD from the native. Therefore, a better strategy is to compare the RMSD distributions of decoys.
Our TreeFolder generates better decoys than FARNA: we compare FARNA and TreeFolder in terms of the quality of the decoy clustering centroids. Similar to FARNA clustering only on the top 1% decoys with the lowest energy, we run MaxCluster to cluster the top 1% of our decoys with the lowest energy into five clusters. As shown in Table 2, TreeFolder can generate decoys with better cluster centroids for nine RNAs: 1a4d, 1esy, 1kka, 1q9a, 1xjr, 1zih, 28sp, 2a43 and 2f88. By the way, even if a significantly smaller number of decoys is generated by us, the lowest RMSD decoys by our TreeFolder for 1a4d, 1zih and 28sp still have smaller RMSD than those by FARNA.
Table 2.
Comparison between FARNA and our method TreeFolder
| FARNA |
TreeFolder |
|||||||
|---|---|---|---|---|---|---|---|---|
| PDB ID | Method | Len | Best cluster centroid | Lowest RMSD decoy | No. of decoys | Best cluster centroid | Lowest RMSD decoy | #Decoys |
| 1a4d | NMR | 41 | 6.48 | 3.43 | 28 949 | 3.65 | 2.69 | 7168 |
| 1esy | NMR | 19 | 3.98 | 1.44 | 69 103 | 2.00 | 1.52 | 22 529 |
| 1kka | NMR | 17 | 4.14 | 2.08 | 81 492 | 3.71 | 2.4 | 24 934 |
| 1l2x | X-ray | 27 | 3.88 | 3.11 | 47 958 | 8.07 | 3.97 | 15 360 |
| 1q9a | X-ray | 27 | 6.11 | 2.65 | 48 817 | 4.76 | 3.5 | 15 415 |
| 1qwa | NMR | 21 | 3.71 | 2.01 | 65 977 | 3.77 | 2.49 | 18 838 |
| 1xjr | X-ray | 46 | 9.82 | 6.25 | 24 646 | 9.26 | 7.05 | 7168 |
| 1zih | NMR | 12 | 1.71 | 1.03 | 117 104 | 1.19 | 0.73 | 40 960 |
| 28sp | NMR | 28 | 3.2 | 2.31 | 46 034 | 2.96 | 1.91 | 17 117 |
| 2a43 | X-ray | 26 | 4.93 | 2.79 | 49 972 | 4.52 | 3.47 | 18 432 |
| 2f88 | NMR | 34 | 3.63 | 2.41 | 36 664 | 3.33 | 2.7 | 12 230 |
The results of FARNA are taken from Table 1 in Das and Baker (2007). Column ‘Best cluster centroid’ lists the RMSD of the best cluster centroid of the top 1% decoys with the lowest energy. Column ‘No. of decoys’ is the number of decoys generated by the methods. Bold fonts indicate better results.
Our TreeFolder generates better decoys than BARNACLE: Table 3 displays the 5% and 25% quantiles of the RMSD distributions for decoys generated by BARNACLE and TreeFolder. The quantiles by BARNACLE are taken from Supplementary Table S4 in Frellsen et al. (2009). BARNACLE considers only decoys with energy <1, since this kind of decoys are likely to have more correct base pairings. We use exactly the same energy function as BARNACLE, so we also consider only decoys with energy <1 to ensure a fair comparison. We did not generate as many decoys as BARNACLE and thus for some test RNAs we do not have many decoys with energy <1. In this case, we use decoys with energy <2. On the 10 RNAs shown in Table 3, TreeFolder yields better RMSD distributions for eight of them: 1esy, 1kka, 1q9a, 1qwa, 1xjr, 1zih, 28sp, 2a43 and 2f88.
Table 3.
The 5 and 25% quantiles of the RMSD distributions for decoys generated by our method TreeFolder and BARNACLE
| BARNACLE |
TreeFolder |
|||||||||
|---|---|---|---|---|---|---|---|---|---|---|
| PDB ID | Len | Bps | 5% | 25% | 5% | 25% | # Energy <1 | 5% | 25% | # Energy <2 |
| 1esy | 19 | 6 | 2.99 | 3.28 | 2.19 | 2.60 | 577 | 2.25 | 2.78 | 1102 |
| 1kka | 17 | 6 | 4.40 | 5.02 | 3.75 | 4.30 | 349 | 3.8 | 4.39 | 776 |
| 1l2x | 27 | 8 | 5.43 | 6.88 | – | – | 0 | 5.44 | 8.08 | 5 |
| 1q9a | 27 | 6 | 4.80 | 5.42 | 4.55 | 5.05 | 486 | 4.61 | 5.07 | 1025 |
| 1qwa | 21 | 8 | 4.06 | 4.64 | 3.65 | 4.26 | 407 | 3.9 | 4.51 | 884 |
| 1xjr | 46 | 15 | 10.41 | 11.01 | 8.50 | 9.43 | 22 | 8.84 | 9.79 | 540 |
| 1zih | 12 | 4 | 1.72 | 2.16 | 1.32 | 1.84 | 1721 | 1.36 | 1.88 | 1931 |
| 28sp | 28 | 8 | 3.23 | 3.76 | 2.88 | 3.43 | 152 | 2.93 | 3.58 | 563 |
| 2a43 | 26 | 7 | 4.72 | 6.08 | – | – | 0 | 4.64 | 5.48 | 26 |
| 2f88 | 34 | 13 | 3.82 | 4.41 | 3.73 | 3.73 | 1 | 3.85 | 4.57 | 130 |
Bold numbers indicate better distributions. Columns ‘#energy < 1’ and ‘#energy < 2’ list the number of decoys with energy <1 and <2, respectively. ‘Bps’ is the number of base pairings.
Sequence information is important for RNA conformation sampling: different from other two state-of-art methods, FARNA and BARNACLE, our TreeFolder makes use of sequence information to significantly improve conformation sampling, as measured by the median RMSD values of decoys. The result is shown in Table 4, in which we compare two CRF models: one using sequence to sample conformations and the other not. Without using sequence information, our CRF method is similar to BARNACLE. That is, it models only angle state transitions in a RNA structure. Both CRF models use 50 conformation states. For the CRF model without sequence features, the regularization factor is set to 5 (i.e. λ=5). While for the CRF model utilizing sequence information, the regularization factor are set to 5 and 10 (i.e. λ=5, μ=10). To calculate the median RMSD, for each RNA we generate 300 decoys using the two CRF models.
Table 4.
Comparison between the CRF models using or without using sequence information
| Median RMSD value |
Median RMSD value |
||||
|---|---|---|---|---|---|
| PDB ID | With seq. feature | Without seq. feature | PDB ID | With seq. feature | Without seq. feature |
| 1zih | 2.68 | 4.56 | 28sp | 6.02 | 10.27 |
| 1esy | 3.73 | 6.17 | 1a4d | 7.79 | 11.60 |
| 1kka | 5.49 | 6.67 | 2a43 | 10.62 | 12.25 |
| 1qwa | 5.58 | 5.99 | 1l2x | 11.01 | 10.74 |
| 1q9a | 5.91 | 6.84 | 1xjr | 10.92 | 12.70 |
| 2f88 | 6.36 | 9.55 | |||
For 10 of the 11 tested RNAs, the model using sequence information yields decoys with much smaller median RMSD. Bold numbers indicate smaller RMSD values.
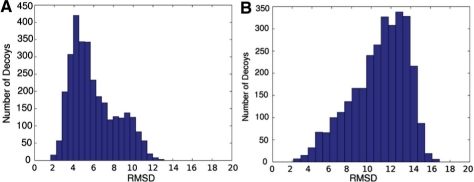
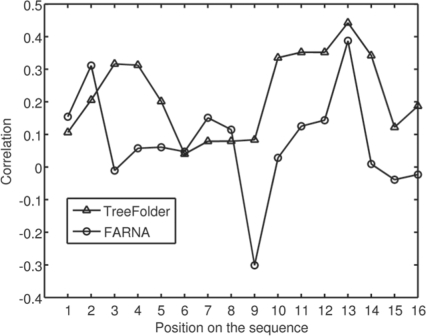
Sampling real-valued angles generates better decoys: in order to show the detailed difference between our TreeFolder and FARNA, we look into the decoys of 1esy. We choose it because that FARNA and TreeFolder yield the largest difference on this RNA among all the 11 tested RNA molecules. As shown in Figure 8. TreeFolder can generate a much larger percentage of decoys with RMSD <4 Å than FARNA. We also compute local RMSD of each position in the decoys, which is defined as the RMSD of the segment of four consecutive nucleotides starting with this position, as compared to the native structure. We calculate the correlation between the local RMSD of each position with the global RMSD, as shown in Figure 9. Among the decoys generated by both FARNA and TreeFolder, the local RMSD at position 13 has the highest correlation with the global RMSD. We also calculate the angle error at each position by Error=‖v−v0‖2 , where v is the angle vector of a decoy at one position and v0 is the native angle vector at the same position.
Fig. 8.
The RMSD histograms of the 3000 decoys generated by our method TreeFolder (A) and FARNA (B) for 1esy.
Fig. 9.
Correlation between the local RMSD at each position and the global RMSD. The X-axis is the start position of a segment.
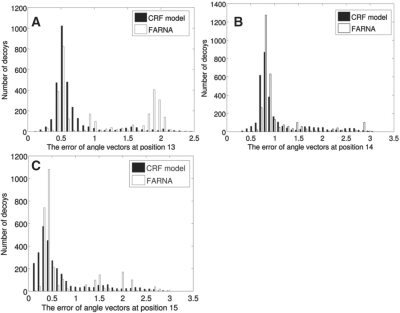
Figure 10 shows the angle error histograms in three positions 13, 14 and 15. The angles at these three positions determine the conformation of the segment starting at position 13. At positions 13 and 15, the angle errors by our method TreeFolder are significantly smaller than those by FARNA. As Figure 10 shows, the angle errors by FARNA are distributed around several separated peaks, which may be caused by the limited number of fragments used in FARNA. In contrast, the angle errors by TreeFolder are distributed more smoothly, possibly because we can sample real-valued angles.
Fig. 10.
The angle error histograms at positions 13, 14 and 15. At positions 13 and 15, the decoys by our TreeFolder have much smaller angle errors than those by FARNA.
Folding RNA using predicted secondary structures: we use the secondary structures predicted by CONTRAfold (Do et al., 2006) and sample 1000 decoys for each RNA. The quantiles of their RMSD values are shown in Table 5. On 6 of the 10 tested RNA, decoys generated from native secondary structures are better than those from predicted secondary structures. On the other four RNAs, the difference between the two types of decoys is small, because of accurate secondary structure prediction. The results for 1l2x and 2a43 from predicted secondary structures are quite bad, since all of their base pairs are contained in a H-type pseudoknot and only half of their base pairs are recovered by CONTRAfold. However, our TreeFolder generates decent conformations for half of the pseudoknot with predicted base pairs, as shown in brackets. In particular, TreeFolder generates decent structures for 2a43 from nucleotides 1 to 14 and for 1l2x from nucleotides 1 to 18, respectively. In order to improve sampling performance on the whole structures of 1l2x and 2a43, we need an energy function like what is used in FARNA to guide the folding simulation.
Table 5.
Comparison between folding with native and predicted secondary structure
| PDB ID | Distribution of RMSD values |
|||
|---|---|---|---|---|
| Native SS |
Predicted SS |
|||
| 5% | 25% | 5% | 25% | |
| 1esy | 2.25 | 2.78 | 3.90 | 4.35 |
| 1kka | 3.80 | 4.39 | 4.57 | 5.46 |
| 1l2x | 5.44 | 8.08 | 15.23 (3.53) | 17.32 (3.88) |
| 1q9a | 4.61 | 5.07 | 4.65 | 5.01 |
| 1qwa | 3.90 | 4.51 | 3.45 | 4.31 |
| 1xjr | 8.84 | 9.79 | 9.17 | 9.79 |
| 1zih | 1.36 | 1.88 | 3.56 | 4.02 |
| 28sp | 2.93 | 3.58 | 2.71 | 3.63 |
| 2a43 | 4.64 | 5.48 | 21.22 (3.89) | 21.99 (4.35) |
| 2f88 | 3.85 | 4.57 | 3.58 | 4.21 |
The four numerical columns list the RMSD values of the 5 and 25% quantiles of the decoys with energy values <2. Bold numbers indicate better results.
Comparison with MC-Sym on the large RNA molecules: our TreeFolder is much faster than the MC-Fold and MC-Sym pipeline (Parisien and Major, 2008) for folding large RNA molecules, as shown in Table 6. The running times in this table were obtained on a workstation with 96 GB RAM and 24 computing cores [2.67 GHz Intel(R) Xeon(R)].
Table 6.
Running time comparison between MC-Sym and our TreeFolder on large RNA molecules
| PDB ID | Length | MC-Sym (h) | TreeFolder (s) | |
|---|---|---|---|---|
| 1l8v | 152 | 48 | 1919 | |
| 2gis | 94 | 32 | 564 | |
| 1vc7 | 74 | 46 | 400 |
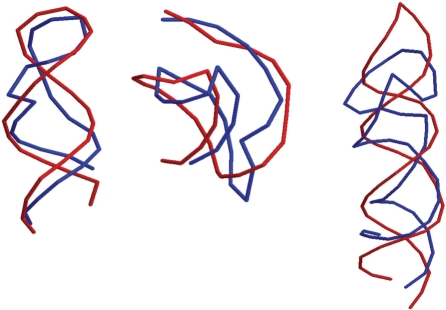
Overlay examples: Figure 11 shows three overlay examples of 1q9a, 2a43 and 1xjr with length of 27 nt, 26 nt and 49 nt, respectively. Pictures in blue display native, while in red the best centroids produced by our algorithm. As shown in this figure, our algorithm recovered a pseudoknot for 2a43.
Fig. 11.
Overlay representation of the best centroids (red) of 1q9a, 2a43 and 1xjr (from left to right) with their native structures (blue). These three RNA molecules have lengths of 27 nt, 26 nt and 49 nt.
4 CONCLUSIONS
We have presented a new method TreeFolder for modeling RNA sequence–structure relationship and conformation sampling using CRFs and a tree-guided sampling scheme. Our CRF method not only captures the relationship between sequence and angles, but also models the interdependency among the angles of three adjacent nucleotides. Our conformation sampling method distinguishes from FARNA in that we do not use fragments to build RNA conformations, so that we do not need to worry about if there are a sufficient number of structure fragments to cover all the possible local conformations. Our TreeFolder also differs from both FARNA and BARNACLE, in that we use primary sequence to estimate the probability of backbone angles, while the latter two do not. In addition, we also use a tree, built from (predicted) secondary structure, to guide conformation sampling so that at one moment we can simultaneously sample conformations for two segments far away from each other along the RNA sequence. In contrast, both FARNA and BARNACLE can only sample conformations for a single short segment at any time. The results indicate that our TreeFolder indeed models sequence–structure relationship well and compares favorably to both FARNA and BARNACLE, even if we use only the same simple energy function as BARNACLE.
We will extend our TreeFolder further. For example, we can incorporate information in sequence homologs into our CRF model so that we can estimate the conformation probability more accurately and thus improve the sampling accuracy. Information in homologs has been successfully used in RNA secondary structure and should be useful for 3D structure prediction. Information in homologs has also been used for protein conformation sampling (Zhao et al., 2010). Currently TreeFolder works well when the native base pairing information is used to calculate the energy function (same as BARNACLE) and to build the sampling guide tree. Not all the RNAs without 3D structures have the native base pairing information. Our next step is to further improve TreeFolder with the predicted base pairings. In particular, we need to design an energy function similar to what is used in FARNA to guide the folding simulation so that TreeFolder works well even if the predicted secondary structure is not very accurate. To tolerate errors in the predicted base pairing information, we will use the predicted confidence as the weight of each item in the energy function and only use those base pairings with high confidence to build the conformation sampling guide tree. We can also take another strategy to circumvent possible impact of errors in the predicted base pairings. In particular, we will extend our CRF method so that we can simultaneously sample base pairings and 3D conformations so that errors in the predicted base pairings will be corrected in the folding simulation process.
Currently, we use a very simple energy function to guide the folding simulation. We will develop a more sophisticated energy function to guide the formation of hydrogen bonds in a better way, just like what FARNA does. Thus, we can not only generate decoys with better RMSD, but also with better hydrogen bonds.
Supplementary Material
ACKNOWLEDGEMENTS
The authors are grateful to the open science grid and to TeraGrid for the computational resources.
Funding: National Institutes of Health (grant R01GM089753, to J.X.); National Science Foundation (grant DBI-0960390, to J.X.); Open Science Grid and TeraGrid (grants TG-MCB100062 and TGCCR100005, to J.X.).
Conflict of Interest: none declared.
REFERENCES
- Abraham M., et al. Analysis and classification of RNA tertiary structures. RNA. 2008;14:2274–2289. doi: 10.1261/rna.853208. [DOI] [PMC free article] [PubMed] [Google Scholar]
- Akutsu T. Dynamic programming algorithms for RNA secondary structure prediction with pseudoknots. Discrete Appl. Math. 2000;104:45–62. [Google Scholar]
- Alkan C., et al. RNA secondary structure prediction via energy density minimization. Res. Comput. Mol. Biol. 2006;3909:130–142. [Google Scholar]
- Andrieu C., et al. An introduction to MCMC for machine learning. Mach. Learn. 2003;50:5–43. [Google Scholar]
- Backofen R., et al. RNAs everywhere: genome-wide annotation of structured RNAs. J. Exp. Zool. Part B: Mol. Dev. Evol. 2007;308B:1–25. doi: 10.1002/jez.b.21130. [DOI] [PubMed] [Google Scholar]
- Backofen R., et al. Sparse RNA folding: time and space efficient algorithms. Com.l Pattern Matching. 2009;5577:249–262. [Google Scholar]
- Badorrek C.S., et al. Structure of an RNA switch that enforces stringent retroviral genomic RNA dimerization. Proc. Natl Acad. Sci. 2006;103:13640–13645. doi: 10.1073/pnas.0606156103. [DOI] [PMC free article] [PubMed] [Google Scholar]
- Berman H.M., et al. The nucleic acid database. A comprehensive relational database of three-dimensional structures of nucleic acids. Biophys. J. 1992;63:751–759. doi: 10.1016/S0006-3495(92)81649-1. [DOI] [PMC free article] [PubMed] [Google Scholar]
- Bindewald E., Shapiro B.A. RNA secondary structure prediction from sequence alignments using a network of k-nearest neighbor classifiers. RNA. 2006;12:342–352. doi: 10.1261/rna.2164906. [DOI] [PMC free article] [PubMed] [Google Scholar]
- Buck A.H., et al. Structural perspective on the activation of RNase P RNA by protein. Nat. Struc. Mol. Biol. 2005;12:958–964. doi: 10.1038/nsmb1004. [DOI] [PubMed] [Google Scholar]
- Cao S., Chen S. Predicting RNA folding thermodynamics with a reduced chain representation model. RNA. 2005;11:1884–1897. doi: 10.1261/rna.2109105. [DOI] [PMC free article] [PubMed] [Google Scholar]
- Das R., Baker D. Automated de novo prediction of native-like RNA tertiary structures. Proc. Natl Acad. Sci. 2007;104:14664–14669. doi: 10.1073/pnas.0703836104. [DOI] [PMC free article] [PubMed] [Google Scholar]
- Das R., et al. Atomic accuracy in predicting and designing noncanonical RNA structure. Nat. Methods. 2010;7:291–294. doi: 10.1038/nmeth.1433. [DOI] [PMC free article] [PubMed] [Google Scholar]
- Ding F., et al. Ab initio RNA folding by discrete molecular dynamics: from structure prediction to folding mechanisms. RNA. 2008;14:1164–1173. doi: 10.1261/rna.894608. [DOI] [PMC free article] [PubMed] [Google Scholar]
- Do C.B., et al. CONTRAfold: RNA secondary structure prediction without physics-based models. Bioinformatics. 2006;22:e90–e98. doi: 10.1093/bioinformatics/btl246. [DOI] [PubMed] [Google Scholar]
- Duarte C.M., Pyle A.M. Stepping through an RNA structure: a novel approach to conformational analysis. J. Mol. Biol. 1998;284:1465–1478. doi: 10.1006/jmbi.1998.2233. [DOI] [PubMed] [Google Scholar]
- Eddy S.R., Durbin R. RNA sequence analysis using covariance models. Nucleic Acids Res. 1994;22:2079–2088. doi: 10.1093/nar/22.11.2079. [DOI] [PMC free article] [PubMed] [Google Scholar]
- Ferretti V., Sankoff D. A continuous analog for RNA folding. B. Math. Biol. 1989;51:167–171. doi: 10.1007/BF02458842. [DOI] [PubMed] [Google Scholar]
- Flores S.C., et al. Pacific Symposium on Biocomputing. Hawaii: World Scientific Publishing, Co.; 2010. Predicting RNA structure by multiple template homology modeling; pp. 216–227. [DOI] [PMC free article] [PubMed] [Google Scholar]
- Frellsen J., et al. A probabilistic model of RNA conformational space. PLoS Comput. Biol. 2009;5:1000406. doi: 10.1371/journal.pcbi.1000406. [DOI] [PMC free article] [PubMed] [Google Scholar]
- Gardner P., Giegerich R. A comprehensive comparison of comparative RNA structure prediction approaches. BMC Bioinformatics. 2004;5:140. doi: 10.1186/1471-2105-5-140. [DOI] [PMC free article] [PubMed] [Google Scholar]
- Gardner P.P., et al. Rfam: updates to the RNA families database. Nucleic Acids Res. 2009;37:136. doi: 10.1093/nar/gkn766. [DOI] [PMC free article] [PubMed] [Google Scholar]
- Gewirth D.T., et al. Secondary structure of 5S RNA: NMR experiments on RNA molecules partially labeled with nitrogen-15. Biochemistry. 1987;26:5213–5220. doi: 10.1021/bi00390a047. [DOI] [PubMed] [Google Scholar]
- Gillespie J., et al. RNA folding on the 3D triangular lattice. BMC Bioinformatics. 2009;10:369. doi: 10.1186/1471-2105-10-369. [DOI] [PMC free article] [PubMed] [Google Scholar]
- Hajdin C.E., et al. On the significance of an RNA tertiary structure prediction. RNA. 2010;16:1340–1349. doi: 10.1261/rna.1837410. [DOI] [PMC free article] [PubMed] [Google Scholar]
- Hamada M., et al. Predictions of RNA secondary structure by combining homologous sequence information. Bioinformatics. 2009;25:330. doi: 10.1093/bioinformatics/btp228. [DOI] [PMC free article] [PubMed] [Google Scholar]
- Haspel N., et al. Reducing the computational complexity of protein folding via fragment folding and assembly. Protein Sci. 2003;12:1177–1187. doi: 10.1110/ps.0232903. [DOI] [PMC free article] [PubMed] [Google Scholar]
- Havgaard J.H., et al. Fast pairwise structural RNA alignments by pruning of the dynamical programming matrix. PLoS Comput. Biol. 2007;3:e193. doi: 10.1371/journal.pcbi.0030193. [DOI] [PMC free article] [PubMed] [Google Scholar]
- Hershkovitz E., et al. Statistical analysis of RNA backbone. IEEE/ACM T. Comput. Biol. Bioinformatics. 2006;3:33. doi: 10.1109/TCBB.2006.13. [DOI] [PMC free article] [PubMed] [Google Scholar]
- Hiller M., et al. Pre-mRNA secondary structures influence exon recognition. PLoS Genet. 2007;3:e204. doi: 10.1371/journal.pgen.0030204. [DOI] [PMC free article] [PubMed] [Google Scholar]
- Hofacker I.L. Vienna RNA secondary structure server. Nucleic Acids Res. 2003;31:3429–3431. doi: 10.1093/nar/gkg599. [DOI] [PMC free article] [PubMed] [Google Scholar]
- Jonikas M.A., et al. Coarse-grained modeling of large RNA molecules with knowledge-based potentials and structural filters. RNA. 2009;15:189–199. doi: 10.1261/rna.1270809. [DOI] [PMC free article] [PubMed] [Google Scholar]
- Knudsen B., Hein J. Pfold: RNA secondary structure prediction using stochastic context-free grammars. Nucleic Acids Res. 2003;31:3423–3428. doi: 10.1093/nar/gkg614. [DOI] [PMC free article] [PubMed] [Google Scholar]
- Lafferty J.D., et al. ICML 2001: Proc. Eighteenth Intl Conf. Mach. Learn. San Francisco, CA, USA: Morgan Kaufmann Publishers Inc.; 2001. Conditional random fields: probabilistic models for segmenting and labeling sequence data; pp. 282–289. [Google Scholar]
- Laing C., Schlick T. Computational approaches to 3D modeling of RNA. J. Phys.: Condens. Matter. 2010;22:283101. doi: 10.1088/0953-8984/22/28/283101. [DOI] [PMC free article] [PubMed] [Google Scholar]
- Lee J., et al. Prediction of protein tertiary structure using PROFESY, a novel method based on fragment assembly and conformational space annealing. Proteins: Struct., Funct., Bioinformatics. 2004;56:704–714. doi: 10.1002/prot.20150. [DOI] [PubMed] [Google Scholar]
- Liu D.C., Nocedal J. On the limited memory BFGS method for large scale optimization. Math. Program. 1989;45:503–528. [Google Scholar]
- Mathews D.H. Revolutions in RNA secondary structure prediction. J. Mol. Biol. 2006;359:526–532. doi: 10.1016/j.jmb.2006.01.067. [DOI] [PubMed] [Google Scholar]
- Mathews D.H., Turner D.H. Dynalign: an algorithm for finding the secondary structure common to two RNA sequences. J. Mol. Biol. 2002;317:191–203. doi: 10.1006/jmbi.2001.5351. [DOI] [PubMed] [Google Scholar]
- Mathews D.H., Turner D.H. Prediction of RNA secondary structure by free energy minimization. Curr. Opin. Struc. Biol. 2006;16:270–278. doi: 10.1016/j.sbi.2006.05.010. [DOI] [PubMed] [Google Scholar]
- Parisien M., Major F. The MC-Fold and MC-Sym pipeline infers RNA structure from sequence data. Nature. 2008;452:51–55. doi: 10.1038/nature06684. [DOI] [PubMed] [Google Scholar]
- Poolsap U., et al. Prediction of RNA secondary structure with pseudoknots using integer programming. BMC Bioinformatics. 2009;10:S38. doi: 10.1186/1471-2105-10-S1-S38. [DOI] [PMC free article] [PubMed] [Google Scholar]
- Ray P.S., et al. A stress-responsive RNA switch regulates VEGFA expression. Nature. 2009;457:915–919. doi: 10.1038/nature07598. [DOI] [PMC free article] [PubMed] [Google Scholar]
- Reymond C., et al. Modulating RNA structure and catalysis: lessons from small cleaving ribozymes. Cell. Mol. Life Sci. 2009;66:3937–3950. doi: 10.1007/s00018-009-0124-1. [DOI] [PMC free article] [PubMed] [Google Scholar]
- Sato K., Sakakibara Y. RNA secondary structural alignment with conditional random fields. Bioinformatics. 2005;21:ii237–ii242. doi: 10.1093/bioinformatics/bti1139. [DOI] [PubMed] [Google Scholar]
- Sharma S., et al. iFoldRNA: three-dimensional RNA structure prediction and folding. Bioinformatics. 2008;24:1951–1952. doi: 10.1093/bioinformatics/btn328. [DOI] [PMC free article] [PubMed] [Google Scholar]
- Simons K.T., et al. Assembly of protein tertiary structures from fragments with similar local sequences using simulated annealing and bayesian scoring functions. J. Mol. Biol. 1997;268:209–225. doi: 10.1006/jmbi.1997.0959. [DOI] [PubMed] [Google Scholar]
- Solnick D. Alternative splicing caused by RNA secondary structure. Cell. 1985;43:667–676. doi: 10.1016/0092-8674(85)90239-9. [DOI] [PubMed] [Google Scholar]
- Tang X., et al. Using motion planning to study RNA folding kinetics. J. Comput. Biol. 2005;12:862–881. doi: 10.1089/cmb.2005.12.862. [DOI] [PubMed] [Google Scholar]
- Wexler Y., et al. A study of accessible motifs and RNA folding complexity. Res. Comput. Mol. Biol. 2006;3909:473–487. doi: 10.1089/cmb.2007.R020. [DOI] [PubMed] [Google Scholar]
- Will S., et al. Inferring noncoding RNA families and classes by means of genome-scale structure-based clustering. PLoS Comput. Biol. 2007;3:e65. doi: 10.1371/journal.pcbi.0030065. [DOI] [PMC free article] [PubMed] [Google Scholar]
- Wohnert J., et al. Direct identification of NH…N hydrogen bonds in non-canonical base pairs of RNA by NMR spectroscopy. Nucleic Acids Res. 1999;27:3104–3110. doi: 10.1093/nar/27.15.3104. [DOI] [PMC free article] [PubMed] [Google Scholar]
- Zhang J., et al. Discrete state model and accurate estimation of loop entropy of RNA secondary structures. J. Chem. Phys. 2008;128:125107. doi: 10.1063/1.2895050. [DOI] [PMC free article] [PubMed] [Google Scholar]
- Zhao F., et al. Discriminative learning for protein conformation sampling. Proteins: Struc., Funct., Bioinformatics. 2008;73:228–240. doi: 10.1002/prot.22057. [DOI] [PMC free article] [PubMed] [Google Scholar]
- Zhao F., et al. A probabilistic graphical model for ab initio folding. Res. Comput. Mol. Biol. 2009;5541:59–73. doi: 10.1007/978-3-642-02008-7_5. [DOI] [PMC free article] [PubMed] [Google Scholar]
- Zhao F., et al. Fragment-free approach to protein folding using conditional neural fields. Bioinformatics. 2010;26:i310–i317. doi: 10.1093/bioinformatics/btq193. [DOI] [PMC free article] [PubMed] [Google Scholar]
- Zuker M. Mfold web server for nucleic acid folding and hybridization prediction. Nucleic Acids Res. 2003;31:3406–3415. doi: 10.1093/nar/gkg595. [DOI] [PMC free article] [PubMed] [Google Scholar]
- Zuker M., Sankoff D. RNA secondary structures and their prediction. B. Math. Biol. 1984;46:591–621. [Google Scholar]
- Zwahlen C., et al. Methods for measurement of intermolecular NOEs by multinuclear NMR spectroscopy: an application to a bacteriophage λ N-peptide/boxB RNA complex. J. Am. Chem. Soc. 1997;119:6711–6721. [Google Scholar]
Associated Data
This section collects any data citations, data availability statements, or supplementary materials included in this article.


