

Abstract
Summary: Gene Ontology and other forms of gene-category analysis play a major role in the evaluation of high-throughput experiments in molecular biology. Single-category enrichment analysis procedures such as Fisher's exact test tend to flag large numbers of redundant categories as significant, which can complicate interpretation. We have recently developed an approach called model-based gene set analysis (MGSA), that substantially reduces the number of redundant categories returned by the gene-category analysis. In this work, we present the Bioconductor package mgsa, which makes the MGSA algorithm available to users of the R language. Our package provides a simple and flexible application programming interface for applying the approach.
Availability: The mgsa package has been made available as part of Bioconductor 2.8. It is released under the conditions of the Artistic license 2.0.
Contact: peter.robinson@charite.de; julien.gagneur@embl.de
1 INTRODUCTION
Gene Ontology (GO) analysis and other forms of gene-set enrichment analysis have become a standard exploratory tool for understanding the results of large-scale genomics experiments and for generating new hypotheses (Robinson and Bauer, 2011). Most early approaches investigated each GO term one at a time, for example testing for significant enrichment of responder genes in each term using Fisher's exact test. In contrast, two recent methods, GenGO and model-based gene set analysis (MGSA) have been developed as global approaches, in which one aims to find the best combination of GO terms to explain the observed biological response (Bauer et al., 2010; Lu et al., 2008). Such global, or ‘model-based’ approaches avoid problems connected with the statistical dependencies inherent in large ontologies such as the GO, in which gene annotations are propagated to ancestor terms, or in any collection of gene sets in which the categories share many annotated genes.
MGSA analyzes all GO categories at once by modeling gene response as a function of the combination of active GO terms. It employs probabilistic inference via a Metropolis-Hasting algorithm to estimate the probability of categories to be active. The MGSA approach naturally takes category overlap into account and avoids the need for multiple testing corrections met in single-category enrichment analysis. More details of the procedure can be found in the original publication, where we also demonstrated that MGSA substantially improves upon single-category statistical enrichment analysis methods and GenGO. Real-life applications have shown the utility of the method in identifying concise yet informative list of categories (Bauer et al., 2010; Ott et al., 2011). In our original work, we integrated a first implementation of MGSA into the Ontologizer application, which is a tool for GO analysis and allows user to inspect the results in an interactive environment (Bauer et al., 2008). Here, we present an implementation of MGSA for users of Bioconductor (Gentleman et al., 2004). The mgsa package wraps a fast C-based implementation of the MGSA algorithm into a flexible application programming interface (API) and utilizes OpenMP to take advantage of the multi-core processing units that modern computer hardware offers (Dagum and Menon, 1998).
2 AVAILABILITY AND USAGE
The mgsa package is part of Bioconductor 2.8, therefore it can be installed directly within the R environment together with all its dependencies. Refer to the Bioconductor Web page at http://www.bioconductor.org/ for installation procedures.
Once the package is installed and loaded, the method can be readily accessed using the function mgsa. To invoke the function, one needs to specify the observations, a vector of gene identifiers corresponding to the study set (e.g. the set of differentially expressed genes), and the gene sets, a list of vectors of gene identifiers for each of the GO terms (or other gene sets or categories) to be analyzed.
To simplify the usage of GO, the readGAF function takes a GAF (Gene Annotation Format) file as input, in which gene annotations are stored, and computes the gene sets of all GO categories including direct and indirect annotations. GAF files are available from the GO homepage and updated regularly. The function takes advantage of the GO.db package to load the structure of the GO, so no external file is needed for the ontology itself. If goa.filename contains the location of a GAF file, observations is a vector of character strings describing the genes of the study set, then an MGSA analysis is as simple as entering the following R code.
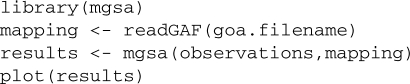
A detailed tutorial is provided in the package vignette that can be invoked with:
![]()
3 APPLICATION
The MGSA package is not restricted to the GO but allows analysis with arbitrary gene sets. This flexibility is illustrated on a dataset in which gene expression for two yeast strains that differ by a single allele (PHO84; Gagneur et al., 2009) is compared. We ask which transcription factor(s) could together best explain the set of 84 transcripts that show differential expression. We stored these as vector of gene identifiers, observations:
![]()
MacIsaac et al. (2006) have compiled a regulatory network for yeast by integrating data of in vivo transcription factor binding from ChIP/chip together with transcription factor motif analysis and sequence conservation. We defined as gene sets the sets of targets of each transcription factor of the network with intermediate cutoffs for binding intensities and conservation (MacIsaac et al., 2006). This network contains a total of 2514 targets across 116 transcription factors. We simply stored it as a named list of vectors of gene identifiers, sets:
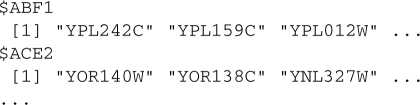
For instance, the first item of the list contains a vector of genes that are targets of the transcription factor ABF1 as predicted by (MacIsaac et al., 2006). We can now call the mgsa method and plot results:
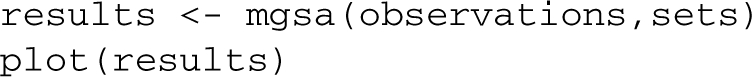
The plot displays the marginal probabilities of the 10 most likely sets (Fig. 1). MGSA infers changes in activity for the PHO4 transcription factor (posterior=0.9995±2×10⁻⁴). Allele variation in the transporter PHO84 affects cellular phosphate levels and regulation of the whole PHO pathway (Gagneur et al., 2009). These transcriptional changes are known to be mediated by the transcription factor PHO4, which MGSA precisely identified.
Fig. 1.

Transcription factor target set enrichment. The posterior probability is shown for the 10 transcription factors with highest marginal probabilities. Categories whose posterior is above 0.5 are interpreted to be ‘active’ according to the MGSA model (Bauer et al., 2010).
4 CONCLUSION
The mgsa package gives users of Bioconductor programmatic access to MGSA. Thus, it can be incorporated into scripts and pipelines written in R and be combined with many other packages of the bioinformatics community. The package comes with a simple but flexible API, which allows researchers not only to use GO as source of gene sets, but also other categorization schemes like the KEGG pathways or the Broad institute gene sets that are easily available through other Bioconductor packages, for instance via GSEABase (Morgan et al., 2007).
Funding: Deutsche Forschungsgemeinschaft (DFG RO 2005/4-1). We thank the lab of Lars Steinmetz for financial support.
Conflict of Interest: none declared.
REFERENCES
- Bauer S., et al. Ontologizer 2.0–a multifunctional tool for go term enrichment analysis and data exploration. Bioinformatics. 2008;24:1650–1651. doi: 10.1093/bioinformatics/btn250. [DOI] [PubMed] [Google Scholar]
- Bauer S., et al. GOing Bayesian: model-based gene set analysis of genome-scale data. Nucleic Acids Res. 2010;38:3523–3532. doi: 10.1093/nar/gkq045. [DOI] [PMC free article] [PubMed] [Google Scholar]
- Dagum L., Menon R. OpenMP: an industry standard API for shared-memory programming. IEEE Comput. Sci. Eng. 1998;5:46–55. [Google Scholar]
- Gagneur J., et al. Genome-wide allele- and strand-specific expression profiling. Mol. Syst. Biol. 2009;5:274. doi: 10.1038/msb.2009.31. [DOI] [PMC free article] [PubMed] [Google Scholar]
- Gentleman R.C., et al. Bioconductor: open software development for computational biology and bioinformatics. Genome Biol. 2004;5:R80. doi: 10.1186/gb-2004-5-10-r80. [DOI] [PMC free article] [PubMed] [Google Scholar]
- Lu Y., et al. A probabilistic generative model for GO enrichment analysis. Nucleic Acids Res. 2008;36:e109. doi: 10.1093/nar/gkn434. [DOI] [PMC free article] [PubMed] [Google Scholar]
- MacIsaac K.D., et al. An improved map of conserved regulatory sites for Saccharomyces cerevisiae. BMC Bioinformatics. 2006;7:113. doi: 10.1186/1471-2105-7-113. [DOI] [PMC free article] [PubMed] [Google Scholar]
- Morgan, M.et al.(2007)GSEABase: Gene set enrichment data structures and methods. R package version 1.12.2. Availabe at http://www.bioconductor.org (last accessed date 2 June, 2011). [Google Scholar]
- Ott C.E., et al. MicroRNAs differentially expressed in postnatal aortic development downregulate elastin via 3′UTR and coding-sequence binding sites. PLoS ONE. 2011;6:e16250. doi: 10.1371/journal.pone.0016250. [DOI] [PMC free article] [PubMed] [Google Scholar]
- Robinson P.N., Bauer S. Introduction to Bio-Ontologies. Boca Raton, Florida: CRC Press; 2011. [Google Scholar]