

Abstract
A default mode network of brain regions is known to demonstrate coordinated activity during the resting state. While the default mode network is well characterized in adults, few investigations have focused upon its development. We scanned 9–13 year old children with diffusion tensor imaging and resting-state functional magnetic resonance imaging. We identified resting state networks using Independent Component Analysis and tested whether the functional connectivity between the medial prefrontal cortex (mPFC) and posterior cingulate cortex (PCC) depends upon the maturation of the underlying cingulum white matter tract. To determine the generalizability of this relationship, we also tested whether functional connectivity depends on white matter maturity between bilateral lateral prefrontal cortex (lateral PFC) within the executive control network. We found a positive relationship between mPFC-PCC connectivity and fractional anisotropy of the cingulum bundle; this positive relationship was moderated by the age of the subjects such that it was stronger in older children. By contrast, no such structure-function relationship emerged between right and left lateral PFC. However, functional and structural connectivity of this tract related positively with cognitive speed, fluency, and set-switching neuropsychological measures.
Keywords: Brain networks, cognition, development, DTI, fMRI
Introduction
Investigations of the intrinsic functional connectivity of the human brain have demonstrated that the brain is organized into multiple networks (termed “resting-state” networks because they were first identified during rest) whose regions are temporally correlated at low-frequencies, reflecting spontaneous neural activity rather than physiological noise (Birn et al., 2006; De Luca et al., 2006). One resting-state network comprising anterior-posterior midline regions of medial prefrontal cortex (mPFC), posterior cingulate cortex and adjacent precuneus and retrosplenial cortex (referred to hereafter as the PCC), bilateral angular gyrus, and bilateral medial temporal lobe, has been termed the “default mode” network (DMN) because it is active during task-free states and attenuated during most task-directed cognitive activity [reviewed in (Buckner et al., 2008)]. Cohesive intrinsic neural activity between mPFC and PCC has been identified in infants (Gao et al., 2009) and in children as young as 7 years (Fair et al., 2008; Thomason et al., 2008), indicating the early presence of the DMN during development.
The relevance of DMN functional connectivity to cognitive development is not fully known. DMN brain regions are nominally involved in self-referential cognition, and DMN activity has been argued to reflect spontaneous internally generated thoughts (Gusnard et al., 2001; Mason et al., 2007; Andrews-Hanna et al., 2010). Nevertheless, there is no general agreement about how the developing properties of the DMN in particular, and resting-state networks in general, may serve cognition (Buckner & Vincent, 2007; Raichle & Snyder, 2007). Findings from life-span developmental studies suggest that cognitive change relates to the integrity of resting-state functional connectivity. First, DMN functional connectivity is disrupted in disorders of both aging [e.g., Alzhiemer’s, (Greicius et al., 2004), Mild cognitive impairment (Rombouts et al., 2005)] and early development [e.g., Autism (Kennedy et al., 2006); Attention-Deficit/Hyperactivity Disorder (Tian et al., 2006; Castellanos et al., 2008)] that involve cognitive impairment. Second, changes in DMN functional connectivity through the lifespan parallel normal cognitive development and decline such that strength of network connectivity is weak in school-age children (Fair et al., 2008), increases through adolescence into adulthood (Kelly et al., 2009; Fair et al., 2009), and weakens during normal aging (Andrews-Hanna et al., 2007). More specific relationships with cognitive function have been noted in normal aging: weaker DMN functional connectivity is associated with lower performance in working memory (Sambataro et al., 2010), processing speed, episodic memory, and executive function (Andrews-Hanna et al., 2007). Whether maturational gains in cognition relate to increasing strength of DMN functional connectivity in childhood is not known.
The cingulum bundle, a white matter tract connecting mPFC and PCC (Mufson and Pandya, 1984), may be important for DMN functional connectivity. The cingulum comprises three components: 1) Efferent fibers from cingulate cortex extending dorsally to premotor and prefrontal cortex and caudoventrally to presubiculum and parahippocampal gyrus; 2) Efferent fibers from the thalamus extending through the cingulate gyrus, rostrally to frontal cortex and caudally to retrosplenial cortex; and 3) Association fibers from prefrontal cortex extending to retrosplenial cortex and from posterior parietal cortex to parahippocampal gyrus and presubiculum regions and rostrally to prefrontal cortex. Thus, the cingulum bundle bridges anterior, posterior, and medial association cortices, thereby supporting communication between the nodes of the DMN, both via direct (anterior-posterior cortico-cortical) and indirect (thalamo-cortical) communication pathways. The cingulum is amenable to diffusion tensor imaging (DTI) using fiber tracking methods at birth (Hermoye et al., 2006), in infancy (Dubois et al., 2008) and in adulthood (Greicius et al., 2009). Consistent with delayed maturation of association cortices compared to primary sensory or motor cortices, the cingulum bundle matures later than other white matter tracts such as the fornix and the cortico-spinal tracts (Dubois et al., 2008). A direct relationship between function and structure has been observed in adults, where individual variability in cingulum microstructural integrity correlated positively with the strength of DMN functional connectivity (Andrews-Hanna et al., 2007; van den Heuval et al., 2008; Skudlarski et al., 2008; Supekar et al., 2010; Teipel et al., 2010). However, a recent study failed to find this structure-function relationship in 7–9 year-old children (Supekar et al., 2010), suggesting that this relationship must emerge after this period in childhood development.
We examined whether the strength of resting-state functional connectivity relates to the microstructural integrity of the underlying white matter fiber tract and to cognitive function in 9–13 year-old children. Our central hypothesis focused upon the DMN because it is detectable by functional magnetic resonance imaging (fMRI) during the preadolescent years. We limited our investigation to the relationship between the mPFC and PCC, the two nodes of the DMN that have been most thoroughly investigated in past studies with adults. We hypothesized that the strength of functional connectivity between mPFC and PCC would relate positively to the microstructural integrity of the cingulum bundle. Because this structure-function relationship likely emerges after age 9 but before adulthood, we further hypothesized that this relationship would be stronger in older children. A second goal of the present study was to determine whether our hypothesized structure-function relationship is specific to the DMN, or whether it may generalize to another resting-state network that is both important for cognition and sensitive to development, but which is very different from the DMN in its anatomical axis and task engagement. Thus, we selected a bilateral (rather than anterior-posterior) network that activates (rather than de-activates) in response to externally-oriented tasks. One such bilateral, task-active network is the executive control network (Seeley et al., 2007). Its primary nodes, within left and right lateral prefrontal cortex (PFC), are connected anatomically by fibers that cross the superior longitudinal fasciculus and course laterally through the corpus callosum (Schmahmann and Pandya, 2006). PFC is critical for goal-directed behavior and matures during childhood (Tsujimoto, 2008). We hypothesized that functional connectivity between left and right lateral PFC would be positively correlated with FA of the tract running through the corpus callosum that connects these regions. However, as corpus callosum matures relatively early in development (Dubois et al., 2008), we expected that this structure-function relationship would not vary with age. Finally, we probed whether connectivity within these two resting state networks related to cognitive function by examining children’s performance on a neuropsychological battery assessing motor and cognitive processing speed, as well as two executive functions, fluency and set-switching. Based upon past work on normal aging (Andrews-Hanna et al., 2007), we expected connectivity in the DMN to be sensitive to individual differences in cognitive but not motor performance. Based upon the critical importance of lateral PFC to executive function, we further expected connectivity in the executive control network to be sensitive selectively to fluency and set-switching performance.
Methods
Subjects
Eighteen boys aged 9–13 years (M = 11.10, SD = 1.38) with average or greater IQ (M = 122.16, SD = 10.18; Range = 101 to 139) were recruited through advertisements; four additional children participated but were excluded due to greater than 1 voxel of head motion during either DTI or fMRI scanning. Written parental consent was obtained following explanation of experimental procedures to parents and children. All subjects were paid for their participation. Exclusion criteria included: (a) Full Scale IQ below 85 as measured by the Wechsler Abbreviated Intelligence Scale (WASI: Wechsler, 1999); (b) Reading disorder as measured by Woodcock-Johnson Letter Word ID or Word Attack (Woodcock et al., 2001) standard scores below 85; and (c) Evidence of neurologic (e.g., epilepsy) or psychiatric (e.g., mood/anxiety) disorders as screened by parent report and the Mini-International Neuropsychiatric Interview (Sheehan et al., 1998).
Neuropsychological Battery
Children were administered the Trail-making, Design Fluency, and Verbal Fluency subtests from the Delis-Kaplan Executive Function System [D–KEFS, (Delis et al., 2001)]. Raw sub-scores from the three tests were grouped to create four indices of information processing, two involving non-executive processing and two involving executive processing (Table I): 1) Motor Processing Speed, consisting of speed on the Motor component of the Trail-making test (the time required for subjects to trace a path between several targets); 2) Cognitive Processing Speed, a composite of the Letter Sequence and Number Sequence Speed subscores of the Trail-making test (the time required for subjects to trace a path between targets in alphabetical or numeric order); 3) Fluency, a composite score of the number of unique items produced in the Category and Letter subtests of the Verbal Fluency tests and in the non-switching component of the Design Fluency test; and 4) Switching, defined by set-switching demands, consisting of subjects’ speed on the Switching component of the Trail-making test (the time required for subjects to trace a line between targets, switching between numeric and alphabetic targets) and the number of items produced in the Switching components of the Verbal and Design Fluency tests (in which subjects must alternate item production between two types of items or connect dots of alternating colors). To combine scores across different tests, each subject’s raw (uncorrected for age) subtest score was converted into a Z-score relative to the scores of the other subjects on that test. Z-score means were then taken across subtests to create the four category scores for each child. Results from the D-KEFS were not available for one child. Letter sequence Trail-making scores (and subsequent Cognitive Processing Speed composite scores) were excluded for another child due to a score more than three standard deviations below the mean score.
Table 1.
Behavioral Measures and Scores
| Subtest | Raw Scores ± SD | Composite Measure |
|---|---|---|
| Trail-Making Test: Motor Speed | 28.2 ± 10.0 sec | Motor Processing Speed |
| Trail-Making Test: Letter Sequence | 34.4 ± 8.8 sec | Cognitive Processing Speed |
| Trail-Making Test: Number Sequence | 38.5 ± 11.6 sec | |
| Verbal Fluency Test: Letter Fluency Total Correct | 30.7 ± 10.2 items | Fluency |
| Verbal Fluency Test: Category Fluency Total Correct | 35.6 ± 9.8 items | |
| Design Fluency: Filled Dots Total Correct | 8.9 ± 3.5 designs | |
| Trail-Making Test: Number-Letter Switching | 100.2 ± 48.5 sec | Switching |
| Verbal Fluency Test: Category Switching Total Correct | 12.0 ± 3.0 items | |
| Design Fluency: Switching Total Correct | 5.9 ± 3.1 designs |
Imaging Procedure
During the resting scan, subjects were instructed to lie in the darkened scanner with their eyes closed but to remain awake. All subjects reported that they had remained awake throughout the entire scan. During the diffusion-tensor scan, subjects watched television via a magnet compatible projector. Head movement was minimized by small foam cushions placed on the sides of the subject’s head.
A high-resolution sagittal T1-weighted structural scan was acquired on a Siemens Trio 3T MRI scanner (Erlangen, Germany) using a 3D MPRAGE sequence for a scan time of 7:23min with the following parameters: TR = 2300ms, TE = 2.94ms, 256×256mm FOV, 160 slabs with 1mm thick slices, 256×256×160 matrix (effective resolution of 1.0mm3), 1 excitation, and a 90 degree flip angle. Functional images were acquired on the same equipment using a T2*-sensitive gradient echo pulse sequence for a scan time of 5:00 min with the following parameters: TR = 2000ms, TE = 30ms, 192×192mm FOV, 64×64 acquisition matrix, and a 90 degree flip angle. Forty-three 2.5mm thick interleaved slices were acquired ascending in the transverse plane (width = 2.5mm, gap width = 0.5mm, effective width = 3mm) for an effective resolution of 3.0mm3. One hundred fifty time points were collected; the first two TRs were included for signal stabilization and were discarded from analysis. Diffusion-tensor images were acquired on the same equipment using a diffusion weighted echo planar sequence with a scan time of 4:39min using gradient values of b=0 and b=1000s/mm2 applied in 35 orthogonal directions with the following parameters: TR = 7700ms, TE = 100ms, 240×240mm FOV, 64×64 acquisition matrix. Fifty-five 2.5mm thick interleaved slices were acquired ascending in the transverse plane (width = 2.5mm, no gap) for an effective resolution of 2.5mm3.
Functional Data Analysis
The functional data was processed using SPM5 (Wellcome Department of Cognitive Neurology, London, UK) implemented in MATLAB (Version 7.1, SP3, Mathworks, Inc., Sherborn, MA). The 3D volumes were corrected for slice acquisition timing and registered to the first volume using an affine transformation. Realigned images were normalized to standard space via registration to the SPM5 EPI template image and interpolated to 2×2×2mm cubic voxels. Normalized image volumes were spatially smoothed using an 8mm full width at half-maximum Gaussian kernel.
Analysis of motion indicated that two of the included subjects exhibited large (> 3mm), transient motion in the Z dimension lasting one timepoint and nine timepoints, respectively. These timepoints were removed from further analysis. After this adjustment, none of the included subjects had greater than 3 mm of translational motion in the x, y, or z dimensions at any point during their functional scan. In each subject, we calculated the maximal translational motion (farthest distance from zero) in each dimension, which measures motion spikes below 3mm translation. The average maximal motion across subjects was small in each dimension (X Translation: M = .27mm, SD = 0.22mm, range = .05mm to .80mm; Y Translation: M = .58mm, SD = .47mm, range = .12mm to 2.2mm; Z Translation: M = .73mm, SD = .42mm, range = .27mm to 1.6mm). Subject age did not correlate with maximal motion in any dimension (all ps > .05). As a further measurement of total motion across the scan, for each subject we calculated the average absolute distance from zero (the square root of the X translation squared plus the Y translation squared plus the Z translation squared, calculated at each timepoint, and then averaged across the scan). This measure of total motion was also small across subjects (M = .25mm, SD = .13mm, range = .049mm to .56mm).
To identify DMN and executive control networks, an independent components analysis (ICA) was performed using the MELODIC toolbox (Beckmann and Smith, 2004) within FSL (Centre for Functional Magnetic Resonance Imaging of the Brain, University of Oxford, London, UK). The smoothed data from all subjects was temporally concatenated to create a single timecourse, and a probabilistic independent components analysis was performed on this timecourse using the MELODIC toolbox, allowing the program to select the optimal number of components to generate. Within each component, MELODIC generated significance values for each voxel using a mixture model combining a “noise” Gaussian function with two gamma functions modeling “active” voxels; the probability of a given voxel’s intensity fitting the gamma functions rather than the background noise Gaussian function was calculated (Beckmann & Smith, 2004). Components were thresholded at P>.999, reflecting a high probability of each “active” voxel truly being a part of that network and not reflecting noise (i.e. stringently excluding false positives). The resulting components were visually inspected for similarities to published accounts of the default network’s spatial extent, as well as for similarities to the executive control network. Within these identified components, we used Marsbar (Brett et al., 2003) to create ROIs based on contiguous clusters of voxels above the threshold of P>.999 within PCC and mPFC (in the default mode component) and within right and left lateral PFC (in the executive control components). These four ROIs subsequently were used as seeds for both the anatomic and functional connectivity analyses, with analyses conducted in pairs according to network membership (DMN or executive control network).
In order to assess functional connectivity, we examined temporal correlations between mean timecourses of ROIs comprising the default mode (PCC and mPFC) and executive control (right lateral PFC and left lateral PFC) networks. In order to minimize the effect of physiological factors (such as respiration or heart rate) common to both regions’ timecourses, we regressed out the signal timecourse from non-neuronal sources such as white matter and CSF (Van Dijk et al., 2010). In order to perform this regression, we first segmented each subject’s MPRAGE into grey matter, white matter, and CSF probability images. White matter and CSF ROIs were then created containing all voxels in the brain with a segmentation value of 1.0 (i.e., no chance of other tissue types being included in the voxel). Mean timecourses during the rest scan were extracted from within white matter and CSF ROIs. These white matter and CSF timecourses were regressed against each voxel within the mPFC, PCC, and lateral PFC timecourses, and the residual timecourse from this regression was obtained for each voxel. This residual timecourse represents the activity within that voxel that is not similar to white matter and CSF timecourses. For each ROI, the residual timecourses for each voxel were averaged, and the mean residual timecourses within the two seed ROIs for each network were then correlated against each other to assess functional connectivity. This procedure generated a correlation value (Pearson’s r) reflecting the strength of functional connectivity within each network for each subject. The resulting r values were converted to normally-distributed Z-scores using Fisher’s transformation in order to allow further analysis of correlation strengths.
Anatomic Data Analysis
The diffusion-weighted scans were processed using the FDT toolbox (Behrens et al., 2003) implemented within FSL (Centre for Functional Magnetic Resonance Imaging of the Brain, University of Oxford, London, UK). The scans were corrected for eddy currents and motion using affine registration to the first b=0 reference volume using the FLIRT toolbox within FSL (Jenkinson & Smith, 2001; Jenkinson et al., 2002). Diffusion tensors were fit to the data and probability distributions on fiber direction at each voxel were calculated using BEDPOSTX (Behrens et al., 2003). This procedure also generated a whole-brain Fractional Anisotropy (FA) map for each subject. FA is a measure of the integrity of white matter based on the diffusivity of water at a given voxel. FA is a positive function ranging between zero and 1, with zero indicating isotropic and 1 indicating perfectly linear diffusion (Basser & Pierpaoli, 1996).
Using ProbtrackX, probabilistic tractography was conducted for each subject to estimate the distributions of white matter connections between seed regions. The seed regions consisted of the four ROIs constructed from the group ICA results, which were transformed into individual subject space using FLIRT. 5,000 streamline samples were initiated from all voxels within each seed region, traveling along the probability distribution functions of local voxels (step length=0.5 mm, curvature threshold=0.2), until they terminated in voxels within the other seed region. For default mode network (with PCC and mPFC seeds), a cingulate cortex ROI was constructed using the Wake Forest Pickatlas (Lancaster et al., 1997, 2000; Maldjian et al., 2003) and was inflated by 6mm to include surrounding white matter (such as the cingulum); this ROI was used as a waypoint through which individual subject PCC-to-mPFC tracts were required to pass. For executive control network, a corpus callosum ROI from the Wake Forest Pickatlas was constructed and inflated by 6mm; this ROI was used as a waypoint through which individual subject right lateral PFC to left lateral PFC tracts were required to pass. To eliminate unlikely white matter paths generated by the algorithm, all obtained tracts were thresholded by 5% of the maximum connectivity value of the tract (following Bennett et al., 2010). The resulting tracts were binarized and applied as masks to the subject’s whole-brain FA map. These steps produced images for each subject that contained only the FA values along the tracts between each of the two pairs of ROIs. The mean FA value of all voxels within each white matter tract was computed for each subject.
The processing steps above yielded indices of anatomic (i.e., mean FA within white matter tracts) and functional connectivity (i.e., temporal correlations) between the ROI pairs, for each subject. First, we examined whether FA or functional correlations for the two networks correlated with age. All correlations were below .3 (range: −.21 to .29) and did not reach significance (ps > .24). Second, we examined the relationship between white matter integrity and functional connectivity by computing the correlation between FA and temporal correlation values (Fisher’s Z) for default mode (mPFC-PCC) and executive control (right lateral PFC-left lateral PFC) networks. Third, as previous work has shown an absence of a structure-function relationship in younger children (Supekar et al., 2010), we examined whether the relationship depended on age by conducting partial correlations of FA with functional connectivity within each network using age as a covariate. Fourth, to examine the relationship between white matter integrity/functional connectivity and behavior, we specified a multiple regression model for each behavioral composite measure testing for effects of DMN FA, DMN temporal correlation, executive control FA, and executive control temporal correlation on the behavioral score. Thus, four multiple regressions were conducted, each determining which of the neural measures significantly impacted the behavioral measure, while accounting for effects of the other neural measures. We followed up the statistically significant models with partial correlations to determine the direction, magnitude, and statistical significance of each neural-behavior relationship within that model.
Results
Functional Connectivity
Results of the ICA analysis are shown in Figure 1. Inspection of the ICA results revealed exactly one component matching the canonical DMN, which included clusters in posterior cingulate cortex, ventral and dorsal medial prefrontal cortex (shown in Figure 1A), bilateral angular gyrus, and bilateral lateral temporal lobe (cannot be seen in Figure 1A). The executive control network was well described by two separate lateralized components: a right executive control component including right dorsolateral prefrontal cortex extending into inferior lateral prefrontal cortex, right lateral parietal cortex, and left lateral cerebellum; and a left executive control component, including all of the contralateral homologue regions of the right executive control component (Figure 1A). See Table 2 for voxels of peak connectivity within these networks. Other components delineated by the ICA procedure were tentatively identified as follows (Figure 1B): a language network with clusters in bilateral ventrolateral prefrontal/orbital cortex, angular gyrus, posterior middle temporal gyrus, and temporal pole; a dorsal attention network including clusters in bilateral inferior parietal cortex; a salience network consisting of clusters in dorsal anterior cingulate cortex, bilateral anterior insula, and bilateral middle frontal gyrus; a primary visual network consisting of one large cluster in occipital cortex; an auditory network consisting of clusters in bilateral auditory cortex extending into inferior postecentral gyrus and in medial supplementary motor area; a visual orienting network consisting of clusters in bilateral precuneus, middle occipital cortex, supramarginal gyrus, and posterior superior frontal gyrus (possibly in frontal eye fields); a visualmotor network consisting of clusters in bilateral middle occipital, superior occipital, and lateral premotor cortex; and a posterior cingulate network consisting of a large posterior cingulate cluster extending into precuneus and bilateral angular gyrus (but, notably, no cluster in medial prefrontal cortex).
Figure 1.
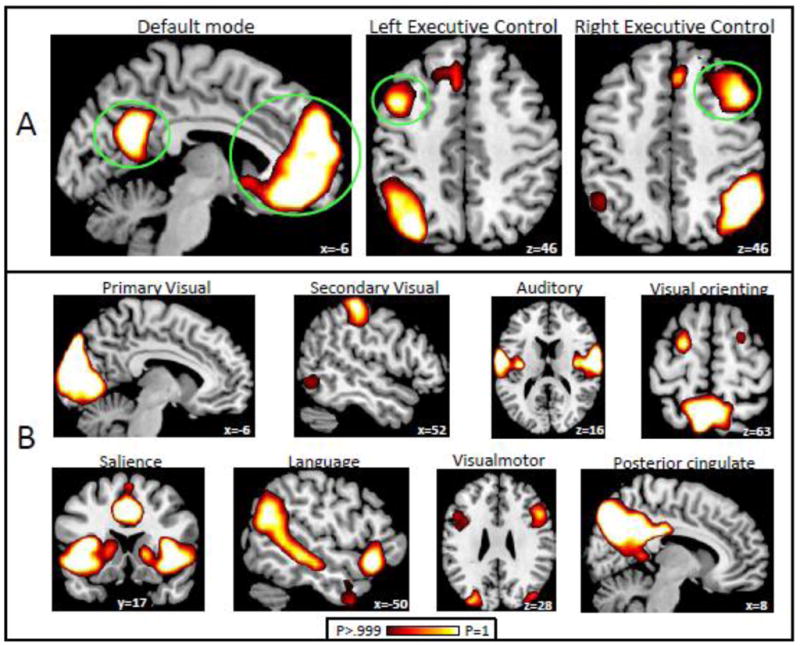
ICA results. (A) Networks of interest: DMN and executive control networks. Networks are thresholded at voxelwise probability of inclusion in the network > .999. Seeds for connectivity analysis were constructed on the activity clusters circled in green. (B) Other networks detected by the ICA analysis.
Table 2.
Voxels of peak connectivity within networks of interest in ICA analysis
| Cluster location | Cluster size (voxels) | Peak Z-score | MNI location of peak voxel |
|---|---|---|---|
| Default Mode Network | |||
| Medial Prefrontal Cortex | 998 | 13.85 | [2, 46, −16] |
| Posterior Cingulate Cortex | 223 | 11.23 | [−2, −58, 28] |
| Right Angular Gyrus | 23 | 5.82 | [54, −62, 24] |
| Left Angular Gyrus | 141 | 8.75 | [−46, −74, 36] |
| Right Anterior Temporal Lobe | 29 | 6.81 | [58, −2, −24] |
| Right Temporal Pole | 24 | 6.23 | [38, 22, −40] |
| Right Executive Control Network | |||
| Right Lateral Prefrontal Cortex | 812 | 9.67 | [38, 58, −4] |
| Right Lateral Parietal Cortex | 381 | 13.29 | [46, −54, 52] |
| Right Posterior Temporal Lobe | 80 | 6.83 | [62, −46, −4] |
| Left Lateral Cerebellum | 97 | 7.39 | [−46, −70, −48] |
| Left Executive Control Network | |||
| Left Lateral Prefrontal Cortex | 587 | 9.79 | [−50, 14, 36] |
| Left Lateral Parietal Cortex | 332 | 9.66 | [−38, −70, 44] |
| Left Posterior Temporal Lobe | 112 | 8.04 | [−58, −54, −12] |
| Right Lateral Cerebellum | 53 | 6.91 | [38, −70, −44] |
Direct assessment of functional connectivity using temporal correlational analyses between the clusters in our networks of interest revealed that the mean connectivity (Z-transformed correlation coefficients) within the DMN was .64 (SD = .37) across subjects, while the mean connectivity within the executive control network was .57 (SD = .22). A post-hoc paired t-test comparing these Z-transformed correlation coefficients indicated that functional connectivity of the two networks did not differ significantly (p = .51).
Structural Connectivity
DTI tractography identified the cingulum tract between mPFC and PCC ROIs (five representative subjects shown in Figure 2). In 12 of 18 subjects, this tract was found in bilateral cingulum, while in the remaining 6 subjects the tract was only detected in the cingulum in one hemisphere. Post-hoc t-tests revealed no differences between subjects with bilateral or unilateral tracts in age, IQ, functional connectivity within the default mode, mean FA within the cingulum, or any composite behavioral measure (ps >.2). The tracts between bilateral lateral PFC ROIs coursed through the body of the corpus callosum and crossed the superior corona radiata and superior longitudinal fasciculus (five representative subjects shown in Figure 3). These tracts were quite variable in appearance, with some extending primarily dorsally to the superior frontal gyrus, some extending directly laterally to posterior middle frontal gyrus, and others extending caudally to anterior middle frontal gyrus. As large portions of these interhemispheric tracts extruded into prefrontal white matter, in which FA is likely to be low due to crossing fibers from the anterior-posterior oriented superior longitudinal fasciculus (Mori et al., 2005), we restricted further analysis of these tracts to the portion of each tract within the corpus callosum by masking the tract with the corpus callosum ROI used previously as a waypoint. For further analyses, FA was thus averaged only within the corpus callosum portion of this tract (Figure 3, in blue).
Figure 2.
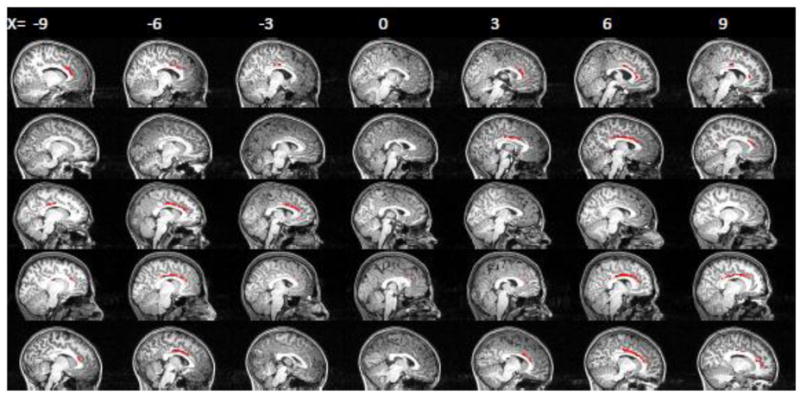
Cingulum tracts traced by the probabilistic tractography procedure in five representative subjects. Tracts are displayed on subjects’ anatomical images.
Figure 3.
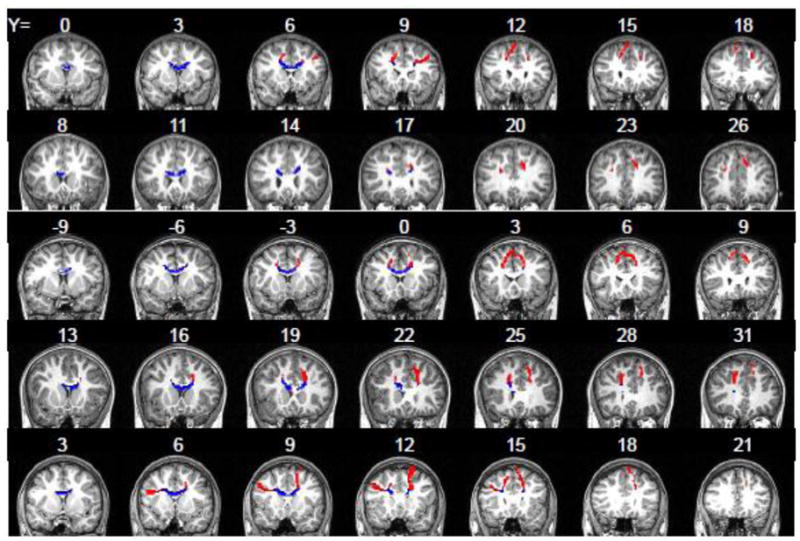
Interhemispheric tracts between lateral PFC clusters traced by the probabilistic tractography procedure in five representative subjects. The portion of the tract outside the corpus callosum is shown in red, while the portion within the corpus callosum (from which FA statistics were calculated) is in blue. Tracts are displayed on subjects’ anatomical images. Note the substantial variations in tract location, as demonstrated by the different Y coordinates at which the tracts emerged.
Across subjects, the average FA value within the mean cingulum tract connecting nodes of the DMN was .39 (SD = .03), while the average value within the corpus callosum portion of the tract connecting executive control network nodes was .60 (SD = .03). A post-hoc paired t-test comparing these values indicated that mean structural integrity was higher for the colossal portion of the executive control network tract than for the cingulum bundle within the DMN, t (17) = 18.71, p < .001.
Correlation between Structural and Functional Connectivity
There was a significant positive correlation between functional connectivity and mean FA in the DMN, r (17) = .48, p = .045 (Figure 4A), indicating that greater functional connectivity was associated with higher white matter microstructural integrity. There was no equivalent relationship between FA and functional connectivity in the executive control network (r (17) = −.08; Figure 5)1.
Figure 4.

(A) Correlation between functional connectivity observed within DMN and mean FA within the cingulum tracts connecting PCC and mPFC. (B) Weak correlation between DMN functional connectivity and cingulum FA in younger children aged 9.1 to 11 years (C) Stronger correlation between DMN functional connectivity and cingulum FA in older children aged 11.4 to 12.9 years
Figure 5.
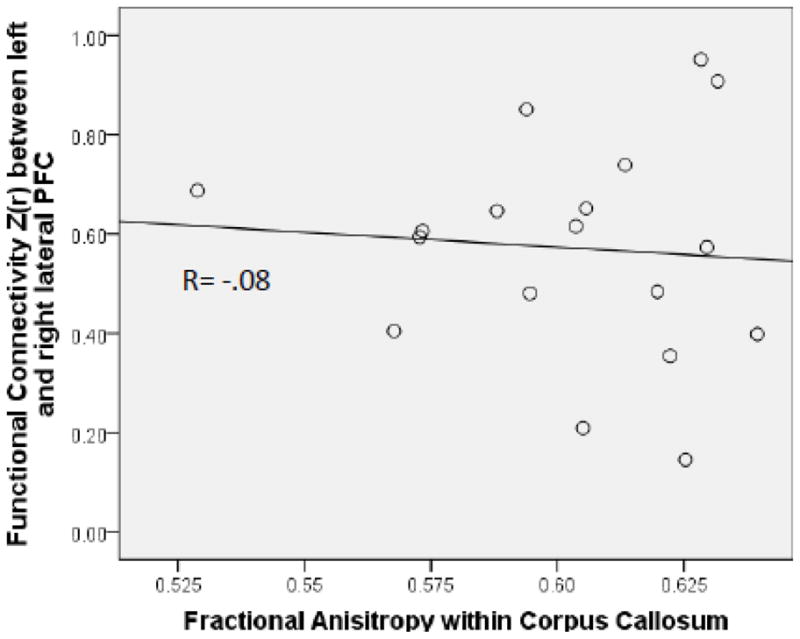
Correlation between functional connectivity within the executive control network and mean FA within the corpus callosum portion of the tracts connecting left and right lateral prefrontal cortex.
Effect of age on structure-function relationship
We found that when a partial correlation was conducted accounting for effects of age, the relationship between DMN functional connectivity and mean FA became stronger (r (15) = .57, p=.016), suggesting that this relationship differs by age. To examine this effect in more detail, we divided the group into a younger (n=9, age range = 9.1 to 11.0) and older group (n=9, age range = 11.4 to 12.9) based on a median split for age. Examination of the two groups separately showed that the correlation between DMN functional connectivity and FA was weak and statistically nonsignificant in the younger group (r (8) = .48, p = .19; Figure 4B), but stronger and statistically significant in the older group (r (8) = .73, p = .027; Figure 4C). Thus, it appears that this structure-function relationship emerges robustly later in childhood. This result was not due to differential motion in the two groups, as maximal motion did not differ between the age groups in any of the three dimensions (ts < 1.7, ps > .1). By contrast, age did not moderate the relationship between functional and structural connectivity in the executive control network, which remained weak when age was included as a covariate (r (15) = −.17).
Relationship with neuropsychological battery
Results of the multiple regression testing for effects of FA and functional connectivity in both networks on each behavioral measure were as follows: 1) Motor Speed. The effect of the neural measures on motor speed was not significant (p = .15). 2) Cognitive Speed. The effect of the neural measures on cognitive speed was significant (F (4,11) = 4.97, p = .016). Post-hoc partial correlations showed that faster cognitive speed correlated with higher corpus callosum FA (r = .75, p=.003), as well as with higher executive control functional connectivity (r = .57, p = .042). 3) Fluency. The effect of the neural measures on fluency was significant (F (4,12) = 10.59, p = .001). Post-hoc partial correlations showed that superior fluency correlated with higher corpus callosum FA (r = .85, p<.001), and correlated at trend level with higher executive control functional connectivity (r = .52, p = .056). 4) Switching. The effect of the neural measures on switching ability was significant (F (4,12) = 5.59, p = .009). Post-hoc partial correlations showed that superior switching scores correlated with higher corpus callosum FA (r = .69, p=.006), as well as with higher executive control functional connectivity (r = .73, p = .003). DMN functional and structural connectivity did not influence any behavioral measure significantly (ps > .10). Further, none of these results changed when age was included as a covariate, suggesting that the reported relationships did not differ by age.
Discussion
We examined the relationships between the strength of intrinsic neural activity during rest and microstructural integrity of the underlying white matter tracts in the DMN (mPFC-PCC) and executive control network (bilateral lateral PFC) in 9–13 year old typically developing children. Consistent with our hypothesis, the strength of functional connectivity of the DMN was positively related to the integrity of the underlying cingulum bundle. However, this relationship was moderated by age such that it was stronger and statistically significant in older but not younger children. In contrast, interhemispheric frontal lobe functional connectivity was not associated with underlying white matter microstructure, and this relationship was not influenced by age. Regarding relationships with behavior, functional and structural connectivity of the executive control network predicted cognitive speed, fluency, and set-switching measures but not motor speed. In contrast, neither structural nor functional DMN connectivity related to any behavioral measure. Together, these results show that the functional relationship within medial nodes of the DMN depended upon the underlying structural connection, more strongly for older than younger children, but that these measures did not predict behavioral performance. In contrast, the functional relationship within the bilateral frontal nodes of the executive control network did not relate reliably to the underlying structural connection, but did predict indices of cognitive performance.
Our study is the first to use DTI to measure the integrity of white-matter microstructure in two white matter tracts that underlie functional networks in late childhood. DTI measures the directional coherence of water diffusion in white matter tracts, with higher FA values reflecting tracts with thicker, more myelinated, and more consistently organized fibers (Basser, 1995; Pierpaoli & Basser, 1996). As the tract connecting bilateral lateral PFC courses through the corpus callosum, the largest and most consistently organized white matter fiber bundle in the brain, FA within this tract is likely to be higher than that of the cingulum bundle within the cingulate gyrus. Indeed, the FA within the corpus callosum potion of this tract was much higher than the FA within the entire tract, and was also higher than FA within the cingulum bundle. As Figure 3 shows, paths of this tract differed widely across individuals. The lack of consistency in tract definition likely results from immaturity of frontal cortex in late childhood, as well as from methodological constraints of tractography in lateral frontal regions that include multiple crossing fibers such as the lateral fibers radiating out of the corpus collosum and the anterior-posterior fibers within the superior longitudinal fasciculus (Mori et al., 2005).
Our results showed that the more organized the cingulum fiber bundle is (i.e., higher FA), the more efficient the communication (i.e., higher functional connectivity) between its interconnected regions. During development, higher FA is an index of white matter maturation (van der Knaap et al., 1991; Klingberg et al., 1999; Barnea-Goraly et al., 2005; Hermoye et al., 2006), while increased DMN functional connectivity is an index of stronger functional organization (Fair et al., 2007, 2008; Thomason et al., 2008). Thus, the association of higher FA with higher DMN functional connectivity in the present study indicates that the increased maturation of the cingulum bundle is related to more efficient communication between mPFC and PCC. Our findings extend the positive correlation between DMN and cingulum FA observed in young adulthood (van den Heuval et al., 2008) and in normal aging (Andrews-Hanna et al., 2007) to an earlier period of development. Our correlation coefficient was higher (r = .48) than those in the adult studies (r = .29 in young adults and r = .33 in older adults, controlled for age), perhaps due to a greater range of functional and structural connectivity in children resulting from variable maturation rates, particularly of fiber tracts connecting association cortices. This greater range may have served to increase the strength of the linear relationship between structure and function.
Our results provide some insight into developmental differences in the maturation of the DMN and its association with the integrity of the cingulum bundle. While age did not correlate with either FA or functional connectivity, it moderated the strength of the structure-function relationship, such that this relationship was stronger in 11–13 year-old children than in 9–11 year-old children. These results extend those of Supekar et al. (2010), who reported a weak, nonsignificant relationship between structure and function of the DMN in 7–9 year old children. The present finding suggests that this relationship emerges after age 9 but is more reliable as children enter the preadolescent years. Interestingly, DMN functional connectivity was not lower in younger than in older children, despite the weakness of the structure-function relationship. Similarly, previous studies have demonstrated that while functional connectivity within the DMN is lower during development than in adulthood, it is still relatively robust (Fair et al., 2008; Kelly et al., 2009; Supekar et al., 2010), even at young ages when the cingulum is quite undeveloped (Dubois et al., 2008). This converging evidence suggests that in early childhood, while the cingulum is relatively immature, DMN functional connectivity may be supported by other structural connections besides the cingulum. One possibility is that communication may be mediated by structural connections through the medial temporal lobe, a component of the DMN. The hippocampal formation matures early, with volume increasing rapidly until age 2 years and slowly thereafter (Utsunomiya et al., 1999), and it is structurally connected to both the anterior and posterior nodes of the DMN. In macaques, direct monosynaptic connections exist between the posterior cingulate and retrosplenial cortex and the medial temporal lobe (Suzuki & Amaral, 1994; Morris et al., 1999; Lavenex et al., 2002; Kobayashi & Amaral, 2003), while the uncinate fasciculus is known to connect the medial temporal lobes to the ventral medial prefrontal cortex (Carmichael & Price, 1995; Petrides & Pandya, 2007). Future work with younger children ought to investigate whether communication between PCC and mPFC may depend on the medial temporal lobe.
The executive control network in the present study was identified as two separate lateralized components, consistent with past ICA studies (Beckmann et al., 2005; Habas et al., 2009; Kiviniemi et al., 2009; Smith et al., 2009; Stevens et al., 2009). In contrast with the DMN, functional connectivity between the lateral prefrontal nodes of the executive control network had no relationship with FA within the corpus callosum. It is possible that this relationship did not emerge because of the highly variable paths of the tracts connecting these nodes. Unlike the cingulum within the DMN, there is no single large, coherent tract connecting lateral prefrontal cortex to its contralateral homologue; thus, the connecting tracts detected using probabilistic tractography are more likely to vary across subjects. Thus, we restricted FA measurement to the corpus callosum portion of the tract in order to increase the consistency of the tract’s anatomical location across subjects. Still, this portion within the corpus callosum was not uniform across subjects, which might increase the noise in our measured FA values and thus reduce our ability to detect a structure-function relationship. Alternately, it is possible that the corpus callosum might not be the only pathway for communication between lateral prefrontal nodes of the executive control network. Interhemispheric resting state functional connectivity in bilateral networks is not eliminated in cases of corpus callosum agenesis (Quigley et al., 2003) or even complete commisurotomy (Uddin et al., 2008), suggesting that subcortical structures might also mediate interhemispheric communication (Uddin et al., 2008). Such an indirect communication pathway obviates the strict dependence of bilateral functional connectivity on direct callosal structural connections, which in this study would reduce our ability to observe correlations between functional and structural connectivity.
Functional connectivity within the DMN was not associated with processing speed in the present study. This association has been observed in healthy adults (Hampson et al., 2006) and in normal aging (Andrews-Hanna et al., 2007; Sambataro et al., 2010). Perhaps this lack of a relationship in the present study resulted from our not using a simple reaction time measure of cognitive speed. Our measure, time taken for trail-making with letter or number sequences, required maintenance of the alphabetic/numeric sequences within working memory and constant monitoring of the position within those sequences—functions commonly associated with executive control processes. Indeed, post-hoc cross-correlations of the cognitive measures revealed that the cognitive speed, fluency, and switching measures were all inter-correlated (all rs > .68; all ps < .01), but that no behavioral measure correlated with motor speed (ps > .1). Thus, the cognitive processing speed measure may not have been “process-pure”, but rather may have required some executive functions, which helps explain both its association with connectivity within the executive control network and its lack of association with functional connectivity within the DMN.
As hypothesized, we observed that functional connectivity between lateral frontal cortex and the structural integrity of the corpus callosum connecting them was associated with two measures of executive function, fluency and set-switching. Furthermore, these connectivity measures also correlated with cognitive speed but not motor speed. The strong inter-correlations between the cognitive speed, fluency, and switching measures suggests these behavioral measures likely all tapped into a single non-motor aspect of cognition which depends on structural and functional connections within the executive control network, but not the DMN. These findings are consistent with others showing that colossal volume correlated with functions supporting higher order interhemispheric functions (e.g., language, inhibition) but not interhemispheric sensory integration (Clarke & Zaidel, 1994). Higher order interhemispheric integration is thought to depend upon interconnection of homologous association cortices, such as the bilateral prefrontal regions investigated in the present study. It is important to note that while both colossal structural integrity and functional connectivity of homologous lateral frontal cortices correlated with the three measures of cognitive function, the interhemispheric functional connectivity did not depend upon the structural integrity of the connecting corpus callosum. Thus, our findings suggest that the concerted functioning of bilateral frontal cortices, which is important for cognitive functioning, can be supported by sources other than a direct bilateral structural connection.
In summary, the present study provides the first evidence for a relationship between functional connectivity within resting-state networks and the maturity of the structural tracts connecting those networks in late childhood. However, our sample size was somewhat small, especially to evaluate age differences. In addition, our sample had relatively high IQ scores, which may limit the generalizability of our findings. Finally, ROIs were based upon group ICA results in order to have a common starting point for structural and functional connectivity analysis across all subjects. In past studies, ROIs for DMN have been based upon loci reported in the literature (e.g., Fair et al., 2008) or task-evoked group average of de-activation (e.g., Hampson et al., 2006). Thus, it will be important to replicate our finding of a stronger structure-function association within the DMN with increasing age with larger and more intellectually heterogeneous samples, as well as with other ROI selection methods. Our findings indicate that the structural maturity of the cingulum bundle is important for the efficiency of communication between the midline nodes of the DMN, particularly as children enter preadolescent years. In contrast, communication between nodes of the bilateral frontal network does not appear to be supported by the structural integrity of the corpus callosum, although integrity of both the functional and structural connections is important for cognitive functioning. Future research should not only extend these findings in different developmental age ranges, but should also examine how these observed relationships might be disrupted in developmental disorders such as ADHD and Autism.
Figure 6.

Partial correlation plots between connectivity measures and behavioral composite measures. Each column of plots represents a multiple regression testing for effects of the four neural measures on that behavioral composite. Each plot shows a partial correlation of the neural measure with the behavioral measure, with the other three neural measures accounted for as covariates. † = p<.10; * = p<.05; ** = p<.01; *** = p<.001.
Acknowledgments
Funding
This work was supported by the National Institute of Mental Health (MH65395) and by a training grant from the National Institute of Neurological Disorders and Stroke (3T32NS041231-03S1).
We would like to thank Rusan Chen for statistical guidance and Devon Shook and Stephanie Bean for assistance with subject recruitment, neuropsychological testing, and MRI data acquisition.
Footnotes
These results did not change substantially if FA was averaged within the entire tract connecting executive control network nodes rather than just within the portion in the corpus callosum. Within the entire tract, mean FA was .46 (SD = .03), which was significantly lower than the mean FA within the corpus callosum portion of the tract (t (17) = −17.99, p < .001), but still significantly higher than the mean FA within the cingulum (t (17) = −7.87, p < .001). FA within this entire tract still did not correlate with functional connectivity in the executive control network (r (17) = .08).
References
- Andrews-Hanna JR, Reidler JS, Huang C, Buckner RL. Evidence for the Default Network’s Role in Spontaneous Cognition. J Neurophysiol. 2010;104(1):322–335. doi: 10.1152/jn.00830.2009. [DOI] [PMC free article] [PubMed] [Google Scholar]
- Andrews-Hanna JR, Snyder AZ, Vincent JL, Lustig C, Head D, Raichle ME, Buckner RL. Disruption of Large-Scale Brain Systems in Advanced Aging. Neuron. 2007;56(5):924–935. doi: 10.1016/j.neuron.2007.10.038. [DOI] [PMC free article] [PubMed] [Google Scholar]
- Barnea-Goraly N, Menon V, Eckert M, Tamm L, Bammer R, Karchemskiy A, Dant CC, Reiss AL. White matter development during childhood and adolescence: a cross-sectional diffusion tensor imaging study. Cereb Cortex. 2005;15(12):1848–54. doi: 10.1093/cercor/bhi062. [DOI] [PubMed] [Google Scholar]
- Basser PJ, Pierpaoli C. Microstructural and physiological features of tissues elucidated by quantitative-diffusion-tensor MRI. J Magn Reson B. 1996;111(3):209–19. doi: 10.1006/jmrb.1996.0086. [DOI] [PubMed] [Google Scholar]
- Basser PJ. Inferring Microstructural Features and the Physiological State of Tissues from Diffusion-Weighted Images. NMR in Biomedicine. 1995;8:333–344. doi: 10.1002/nbm.1940080707. [DOI] [PubMed] [Google Scholar]
- Beckmann CF, DeLuca M, Devlin JT, Smith SM. Investigations into resting-state connectivity using independent component analysis. Philos Trans R Soc Lond B Biol Sci. 2005;360(1457):1001–13. doi: 10.1098/rstb.2005.1634. [DOI] [PMC free article] [PubMed] [Google Scholar]
- Beckmann CF, Smith SM. Probabilistic independent component analysis for functional magnetic resonance imaging. IEEE Trans Med Imaging. 2004;23(2):137–52. doi: 10.1109/TMI.2003.822821. [DOI] [PubMed] [Google Scholar]
- Behrens TE, Woolrich MW, Jenkinson M, Johansen-Berg H, Nunes RG, Clare S, Matthews PM, Brady JM, Smith SM. Characterization and propagation of uncertainty in diffusion-weighted MR imaging. Magn Reson Med. 2003;50(5):1077–88. doi: 10.1002/mrm.10609. [DOI] [PubMed] [Google Scholar]
- Bennett IJ, Madden DJ, Vaidya CJ, Howard JH, Jr, Howard DV. White matter integrity correlates of implicit sequence learning in healthy aging. Neurobiology of Aging. 2010 doi: 10.1016/j.neurobiolaging.2010.03.017. [DOI] [PMC free article] [PubMed] [Google Scholar]
- Birn RM, Diamond JB, Smith MA, Bandettini PA. Separating respiratory-variation-related fluctuations from neuronal-activity-related fluctuations in fMRI. NeuroImage. 2006;31(4):1536–48. doi: 10.1016/j.neuroimage.2006.02.048. [DOI] [PubMed] [Google Scholar]
- Brett M, Anton J, Valabregue R, Poline J. Region of interest analysis using an SPM toolbox (abstract) NeuroImage. 2003;16(Supplemental) (CD-ROM) [Google Scholar]
- Buckner RL, Andrews-Hanna JR, Schacter DL. The Brain’s Default Network: Anatomy, Function, and Relevance to Disease. Annals of the New York Academy of Sciences. 2008;1124:1–38. doi: 10.1196/annals.1440.011. [DOI] [PubMed] [Google Scholar]
- Buckner RL, Vincent JL. Unrest at rest: Default activity and spontaneous network correlations. NeuroImage. 2007;37(4):1091–1096. doi: 10.1016/j.neuroimage.2007.01.010. [DOI] [PubMed] [Google Scholar]
- Carmichael ST, Price JL. Limbic connections of the orbital and medial prefrontal cortex in macaque monkeys. The Journal of Comparative Neurology. 1995;363(4):615–641. doi: 10.1002/cne.903630408. [DOI] [PubMed] [Google Scholar]
- Castellanos FX, Margulies DS, Kelly A, Uddin LQ, Ghaffari M, Kirsch A, Shaw D, Shehzad Z, Di Martino A, Biswal BB, Sonuga-Barke EJ, Rotrosen J, Adler LA, Milham MP. Cingulate-Precuneus Interactions: A New Locus of Dysfunction in Adult Attention-Deficit/Hyperactivity Disorder. Biological psychiatry. 2008;63(3):332–337. doi: 10.1016/j.biopsych.2007.06.025. [DOI] [PMC free article] [PubMed] [Google Scholar]
- Clarke JM, Zaidel E. Anatomical-behavioral relationships: Corpus callosum morphometry and hemispheric specialization. Behavioural Brain Research. 1994;64(1–2):185–202. doi: 10.1016/0166-4328(94)90131-7. [DOI] [PubMed] [Google Scholar]
- De Luca M, Beckmann CF, De Stefano N, Matthews P, Smith S. fMRI resting state networks define distinct modes of long-distance interactions in the human brain. NeuroImage. 2006;29(4):1359–1367. doi: 10.1016/j.neuroimage.2005.08.035. [DOI] [PubMed] [Google Scholar]
- Delis D, Kaplan E, Kramer J. Delis Kaplan Executive Function System technical manual. San Antonio, TX: The Psychological Corporation; 2001. [Google Scholar]
- Dubois J, Dehaene-Lambertz G, Perrin M, Mangin JF, Cointepas Y, Duchesnay E, Le Bihan D, Hertz-Pannier L. Asynchrony of the early maturation of white matter bundles in healthy infants: quantitative landmarks revealed noninvasively by diffusion tensor imaging. Hum Brain Mapp. 2008;29(1):14–27. doi: 10.1002/hbm.20363. [DOI] [PMC free article] [PubMed] [Google Scholar]
- Fair DA, Cohen AL, Dosenbach NUF, Church JA, Miezin FM, Barch DM, Raichle ME, Petersen SE, Schlaggar BL. The maturing architecture of the brain’s default network. Proceedings of the National Academy of Sciences of the United States of America. 2008;105(10):4028–32. doi: 10.1073/pnas.0800376105. [DOI] [PMC free article] [PubMed] [Google Scholar]
- Fair DA, Cohen AL, Power JD, Dosenbach NUF, Church JA, Miezin FM, Schlaggar BL, Petersen SE. Functional Brain Networks Develop from a “Local to Distributed” Organization. PLoS Computational Biology. 2009;5(5):e1000381. doi: 10.1371/journal.pcbi.1000381. [DOI] [PMC free article] [PubMed] [Google Scholar]
- Fair DA, Dosenbach NUF, Church JA, Cohen AL, Brahmbhatt S, Miezin FM, Barch DM, Raichle ME, Petersen SE, Schlaggar BL. Development of distinct control networks through segregation and integration. Proceedings of the National Academy of Sciences of the United States of America. 2007;104(33):13507–13512. doi: 10.1073/pnas.0705843104. [DOI] [PMC free article] [PubMed] [Google Scholar]
- Gao W, Zhu H, Giovanello KS, Smith JK, Shen D, Gilmore JH, Lin W. Evidence on the emergence of the brain’s default network from 2-week-old to 2-year-old healthy pediatric subjects. Proceedings of the National Academy of Sciences. 2009;106(16):6790–6795. doi: 10.1073/pnas.0811221106. [DOI] [PMC free article] [PubMed] [Google Scholar]
- Greicius MD, Srivastava G, Reiss AL, Menon V. Default-mode network activity distinguishes Alzheimer’s disease from healthy aging: evidence from functional MRI. Proc Natl Acad Sci U S A. 2004;101(13):4637–42. doi: 10.1073/pnas.0308627101. [DOI] [PMC free article] [PubMed] [Google Scholar]
- Greicius MD, Supekar K, Menon V, Dougherty RF. Resting-State Functional Connectivity Reflects Structural Connectivity in the Default Mode Network. Cereb Cortex. 2009;19(1):72–78. doi: 10.1093/cercor/bhn059. [DOI] [PMC free article] [PubMed] [Google Scholar]
- Gusnard DA, Akbudak E, Shulman GL, Raichle ME. Medial prefrontal cortex and self-referential mental activity: Relation to a default mode of brain function. Proceedings of the National Academy of Sciences of the United States of America. 2001;98(7):4259–4264. doi: 10.1073/pnas.071043098. [DOI] [PMC free article] [PubMed] [Google Scholar]
- Habas C, Kamdar N, Nguyen D, Prater K, Beckmann CF, Menon V, Greicius MD. Distinct Cerebellar Contributions to Intrinsic Connectivity Networks. J Neurosci. 2009;29(26):8586–8594. doi: 10.1523/JNEUROSCI.1868-09.2009. [DOI] [PMC free article] [PubMed] [Google Scholar]
- Hampson M, Driesen NR, Skudlarski P, Gore JC, Constable RT. Brain Connectivity Related to Working Memory Performance. J Neurosci. 2006;26(51):13338–13343. doi: 10.1523/JNEUROSCI.3408-06.2006. [DOI] [PMC free article] [PubMed] [Google Scholar]
- Hermoye L, Saint-Martin C, Cosnard G, Lee SK, Kim J, Nassogne MC, Menten R, Clapuyt P, Donohue PK, Hua K, Wakana S, Jiang H, van Zijl PC, Mori S. Pediatric diffusion tensor imaging: normal database and observation of the white matter maturation in early childhood. NeuroImage. 2006;29(2):493–504. doi: 10.1016/j.neuroimage.2005.08.017. [DOI] [PubMed] [Google Scholar]
- van den Heuval M, Mandl R, Luigjes J, Pol H. Microstructural Organization of the Cingulum Tract and the Level of Default Mode Functional Connectivity. J Neurosci. 2008;43(28):10844–10851. doi: 10.1523/JNEUROSCI.2964-08.2008. [DOI] [PMC free article] [PubMed] [Google Scholar]
- Jenkinson M, Bannister P, Brady M, Smith S. Improved optimization for the robust and accurate linear registration and motion correction of brain images. NeuroImage. 2002;17(2):825–41. doi: 10.1016/s1053-8119(02)91132-8. [DOI] [PubMed] [Google Scholar]
- Jenkinson M, Smith S. A global optimisation method for robust affine registration of brain images. Medical Image Analysis. 2001;5(2):143–156. doi: 10.1016/s1361-8415(01)00036-6. [DOI] [PubMed] [Google Scholar]
- Kelly A, Di Martino A, Uddin LQ, Shehzad Z, Gee DG, Reiss PT, Margulies DS, Castellanos FX, Milham MP. Development of Anterior Cingulate Functional Connectivity from Late Childhood to Early Adulthood. Cereb Cortex. 2009;19(3):640–657. doi: 10.1093/cercor/bhn117. [DOI] [PubMed] [Google Scholar]
- Kennedy DP, Redcay E, Courchesne E. Failing to deactivate: Resting functional abnormalities in autism. Proc Natl Acad Sci U S A. 2006;103(21):8275–80. doi: 10.1073/pnas.0600674103. [DOI] [PMC free article] [PubMed] [Google Scholar]
- Kiviniemi V, Starck T, Remes J, Long X, Nikkinen J, Haapea M, Veijola J, Moilanen I, Isohanni M, Zang Y, Tervonen O. Functional segmentation of the brain cortex using high model order group PICA. Human Brain Mapping. 2009;30(12):3865–3886. doi: 10.1002/hbm.20813. [DOI] [PMC free article] [PubMed] [Google Scholar]
- Klingberg T, Vaidya CJ, Gabrieli JDE, Moseley ME, Hedehus M. Myelination and organization of the frontal white matter in children: a diffusion tensor MRI study. Neuroreport. 1999;10(13):2817–2821. doi: 10.1097/00001756-199909090-00022. [DOI] [PubMed] [Google Scholar]
- van der Knaap MS, Valk J, Bakker CJ, Schooneveld M, Faber JA, Willemse J, Gooskens RH. Myelination as an expression of the functional maturity of the brain. Developmental Medicine and Child Neurology. 1991;33(10):849–57. doi: 10.1111/j.1469-8749.1991.tb14793.x. [DOI] [PubMed] [Google Scholar]
- Kobayashi Y, Amaral DG. Macaque monkey retrosplenial cortex: II. Cortical afferents. The Journal of Comparative Neurology. 2003;466(1):48–79. doi: 10.1002/cne.10883. [DOI] [PubMed] [Google Scholar]
- Lancaster JL, Woldorff MG, Parsons LM, Liotti M, Freitas CS, Rainey L, Kochunov PV, Nickerson D, Mikiten SA, Fox PT. Automated Talairach atlas labels for functional brain mapping. Human Brain Mapping. 2000;10(3):120–131. doi: 10.1002/1097-0193(200007)10:3<120::AID-HBM30>3.0.CO;2-8. [DOI] [PMC free article] [PubMed] [Google Scholar]
- Lancaster JL, Summerlin JL, Rainey L, Freitas CS, Fox PT. The Talairach daemon, a database server for Talairach atlas labels. Neuroimage. 1997;5(4):S633. [Google Scholar]
- Lavenex P, Suzuki WA, Amaral DG. Perirhinal and parahippocampal cortices of the macaque monkey: Projections to the neocortex. The Journal of Comparative Neurology. 2002;447(4):394–420. doi: 10.1002/cne.10243. [DOI] [PubMed] [Google Scholar]
- Maldjian JA, Laurienti PJ, Kraft RA, Burdette JH. An automated method for neuroanatomic and cytoarchitectonic atlas-based interrogation of fMRI data sets. NeuroImage. 2003;19(3):1233–1239. doi: 10.1016/s1053-8119(03)00169-1. [DOI] [PubMed] [Google Scholar]
- Mason MF, Norton MI, Van Horn JD, Wegner DM, Grafton ST, Macrae CN. Wandering Minds: The Default Network and Stimulus-Independent Thought. Science. 2007;315(5810):393–395. doi: 10.1126/science.1131295. [DOI] [PMC free article] [PubMed] [Google Scholar]
- Mori S, Wakana S, Zijl PCMV. MRI atlas of human white matter. Elsevier Science Ltd; 2005. [Google Scholar]
- Morris R, Petrides M, Pandya DN. Architecture and connections of retrosplenial area 30 in the rhesus monkey (macaca mulatta) European Journal of Neuroscience. 1999;11(7):2506–2518. doi: 10.1046/j.1460-9568.1999.00672.x. [DOI] [PubMed] [Google Scholar]
- Mufson EJ, Pandya DN. Some observations on the course and composition of the cingulum bundle in the rhesus monkey. The Journal of Comparative Neurology. 1984;225(1):31–43. doi: 10.1002/cne.902250105. [DOI] [PubMed] [Google Scholar]
- Petrides M, Pandya DN. Efferent Association Pathways from the Rostral Prefrontal Cortex in the Macaque Monkey. J Neurosci. 2007;27(43):11573–11586. doi: 10.1523/JNEUROSCI.2419-07.2007. [DOI] [PMC free article] [PubMed] [Google Scholar]
- Pierpaoli C, Basser PJ. Toward a quantitative assessment of diffusion anisotropy. Magnetic Resonance in Medicine. 1996;36(6):893–906. doi: 10.1002/mrm.1910360612. [DOI] [PubMed] [Google Scholar]
- Quigley M, Cordes D, Turski P, Moritz C, Haughton V, Seth R, Meyerand ME. Role of the corpus callosum in functional connectivity. AJNR Am J Neuroradiol. 2003;24(2):208–12. [PMC free article] [PubMed] [Google Scholar]
- Raichle ME, Snyder AZ. A default mode of brain function: A brief history of an evolving idea. NeuroImage. 2007;37(4):1083–1090. doi: 10.1016/j.neuroimage.2007.02.041. [DOI] [PubMed] [Google Scholar]
- Rombouts SA, Barkhof F, Goekoop R, Stam CJ, Scheltens P. Altered resting state networks in mild cognitive impairment and mild Alzheimer’s disease: An fMRI study. Human Brain Mapping. 2005;26(4):231–239. doi: 10.1002/hbm.20160. [DOI] [PMC free article] [PubMed] [Google Scholar]
- Sambataro F, Murty VP, Callicott JH, Tan H, Das S, Weinberger DR, Mattay VS. Age-related alterations in default mode network: Impact on working memory performance. Neurobiology of Aging. 2010;31(5):839–52. doi: 10.1016/j.neurobiolaging.2008.05.022. [DOI] [PMC free article] [PubMed] [Google Scholar]
- Schmahmann JD, Pandya DN. Fiber Pathways of the Brain. New York, NY: Oxford University Press; 2006. [Google Scholar]
- Seeley WW, Menon V, Schatzberg AF, Keller J, Glover GH, Kenna H, Reiss AL, Greicius MD. Dissociable intrinsic connectivity networks for salience processing and executive control. The Journal of Neuroscience: The Official Journal of the Society for Neuroscience. 2007;27(9):2349–56. doi: 10.1523/JNEUROSCI.5587-06.2007. [DOI] [PMC free article] [PubMed] [Google Scholar]
- Sheehan DV, Lecrubier Y, Sheehan KH, Amorim P, Janavs J, Weiller E, Hergueta T, Baker R, Dunbar GC. The Mini-International Neuropsychiatric Interview (M.I.N.I.): the development and validation of a structured diagnostic psychiatric interview for DSM-IV and ICD-10. J Clin Psychiatry. 1998;59(Suppl 20):22–33. quiz 34–57. [PubMed] [Google Scholar]
- Skudlarski P, Jagannathan K, Calhoun VD, Hampson M, Skudlarska BA, Pearlson G. Measuring brain connectivity: Diffusion tensor imaging validates resting state temporal correlations. NeuroImage. 2008;43(3):554–561. doi: 10.1016/j.neuroimage.2008.07.063. [DOI] [PMC free article] [PubMed] [Google Scholar]
- Smith SM, Fox PT, Miller KL, Glahn DC, Fox PM, Mackay CE, Filippini N, Watkins KE, Toro R, Laird AR, Beckmann CF. Correspondence of the brain’s functional architecture during activation and rest. Proceedings of the National Academy of Sciences. 2009;106(31):13040–13045. doi: 10.1073/pnas.0905267106. [DOI] [PMC free article] [PubMed] [Google Scholar]
- Stevens MC, Pearlson GD, Calhoun VD. Changes in the interaction of resting-state neural networks from adolescence to adulthood. Human Brain Mapping. 2009;30(8):2356–2366. doi: 10.1002/hbm.20673. [DOI] [PMC free article] [PubMed] [Google Scholar]
- Supekar K, Uddin LQ, Prater K, Amin H, Greicius MD, Menon V. Development of functional and structural connectivity within the default mode network in young children. NeuroImage. 2010;52(1):290–301. doi: 10.1016/j.neuroimage.2010.04.009. [DOI] [PMC free article] [PubMed] [Google Scholar]
- Suzuki WL, Amaral DG. Perirhinal and parahippocampal cortices of the macaque monkey: Cortical afferents. The Journal of Comparative Neurology. 1994;350(4):497–533. doi: 10.1002/cne.903500402. [DOI] [PubMed] [Google Scholar]
- Teipel SJ, Bokde AL, Meindl T, Amaro E, Jr, Soldner J, Reiser MF, Herpertz SC, Möller H, Hampel H. White matter microstructure underlying default mode network connectivity in the human brain. NeuroImage. 2010;49(3):2021–2032. doi: 10.1016/j.neuroimage.2009.10.067. [DOI] [PubMed] [Google Scholar]
- Thomason ME, Chang CE, Glover GH, Gabrieli JD, Greicius MD, Gotlib IH. Default-mode function and task-induced deactivation have overlapping brain substrates in children. NeuroImage. 2008;41(4):1493–1503. doi: 10.1016/j.neuroimage.2008.03.029. [DOI] [PMC free article] [PubMed] [Google Scholar]
- Tian L, Jiang T, Wang Y, Zang Y, He Y, Liang M, Sui M, Cao Q, Hu S, Peng M, Zhuo Y. Altered resting-state functional connectivity patterns of anterior cingulate cortex in adolescents with attention deficit hyperactivity disorder. Neuroscience letters. 2006;400(1–2):39–43. doi: 10.1016/j.neulet.2006.02.022. [DOI] [PubMed] [Google Scholar]
- Tsujimoto S. The Prefrontal Cortex: Functional Neural Development During Early Childhood. The Neuroscientist. 2008;14(4):345–358. doi: 10.1177/1073858408316002. [DOI] [PubMed] [Google Scholar]
- Uddin LQ, Mooshagian E, Zaidel E, Scheres A, Margulies DS, Kelly A, Shehzad Z, Adelstein JS, Castellanos FX, Biswal BB, Milham MP. Residual functional connectivity in the split-brain revealed with resting-state functional MRI. Neuroreport. 2008;19(7):703–9. doi: 10.1097/WNR.0b013e3282fb8203. [DOI] [PMC free article] [PubMed] [Google Scholar]
- Utsunomiya H, Takano K, Okazaki M, Mitsudome A. Development of the Temporal Lobe in Infants and Children: Analysis by MR-Based Volumetry. AJNR Am J Neuroradiol. 1999;20(4):717–723. [PMC free article] [PubMed] [Google Scholar]
- Van Dijk KRA, Hedden T, Venkataraman A, Evans KC, Lazar SW, Buckner RL. Intrinsic Functional Connectivity As a Tool For Human Connectomics: Theory, Properties, and Optimization. J Neurophysiol. 2010;103(1):297–321. doi: 10.1152/jn.00783.2009. [DOI] [PMC free article] [PubMed] [Google Scholar]
- Wechsler D. The Wechsler Abbreviated Scale of Intelligence (WASI) New York: Psychological Corporation; 1999. [Google Scholar]
- Woodcock R, McGrew K, Mather N. Woodcock-Johnson III tests of cognitive abilities. Itasca, IL: Riverside Publishing; 2001. [Google Scholar]