

Abstract
Background
Sedoheptulose, arabitol, ribitol, and erythritol have been identified as key diagnostic metabolites in TALDO deficiency.
Method
Urine from 6 TALDO-deficient patients and TALDO-deficient knock-out mice were analyzed using 1H-NMR spectroscopy and GC–mass spectrometry.
Results
Our data confirm the known metabolic characteristics in TALDO-deficient patients. The β-furanose form was the major sedoheptulose anomer in TALDO-deficient patients. Erythronic acid was identified as a major abnormal metabolite in all patients and in knock-out TALDO mice implicating an as yet unknown biochemical pathway in this disease. A putative sequence of enzymatic reactions leading to the formation of erythronic acid is presented. The urinary concentration of the citric acid cycle intermediates 2-oxoglutaric acid and fumaric acid was increased in the majority of TALDO-deficient patients but not in the knock-out mice.
Conclusion
Erythronic acid is a novel and major hallmark in TALDO deficiency. The pathway leading to its production may play a role in healthy humans as well. In TALDO-deficient patients, there is an increased flux through this pathway. The finding of increased citric acid cycle intermediates hints toward a disturbed mitochondrial metabolism in TALDO deficiency.
Keywords: NMR spectroscopy, Citric acid cycle intermediates, Pentose phosphate pathway, Transaldolase deficiency, Polyols, Sedoheptulose, Erythronic acid, 2-Oxoglutaric acid
1. Introduction
Two new defects in the pentose phosphate pathway (PPP) have recently been discovered: ribose 5-phosphate isomerase (RPI) deficiency (OMIM 608611) and transaldolase (TALDO) deficiency (OMIM 606003).
The first and as yet only case of RPI deficiency was described by Huck et al. [1]. The patient was a 14-year-old boy with leukoencephalopathy and peripheral neuropathy. Magnetic resonance spectroscopy (MRS) showed elevated levels of the polyols ribitol and arabitol in the brain. Ten patients from six families with TALDO deficiency are known [2–5]. The disease is associated with liver symptoms, while other organs are affected to a variable degree [4,5]. The metabolic phenotype of this disease is characterized by increased urinary concentrations of the polyols erythritol, arabitol, ribitol, sedoheptitol, perseitol, the sugars sedoheptulose and mannoheptulose, and sedoheptulose-7-phosphate [4,6]. Erythritol, arabitol, and sedoheptulose have been described as most prominent diagnostic metabolites in urine of patients.
The biochemical diagnosis of RPI and TALDO deficiencies relies on finding strongly increased concentrations of polyols in body fluids. The use of LC–MS/MS, LC–MS, and GC–MS for this purpose has been reported [7–9]. 1H-NMR spectroscopy can be used for identification and quantification of proton-containing metabolites in body fluids [10]. RPI deficiency was diagnosed successfully by measuring high concentrations of ribitol and arabitol in urine and cerebrospinal fluid (CSF) using NMR spectroscopy [11].
In this study, we had the opportunity to characterize urine from 6 patients with genetically confirmed TALDO deficiency. We show for the first time the presence of increased urinary erythronic acid in all TALDO-deficient patients and show that this metabolite is a biochemical hallmark of TALDO deficiency. Furthermore, resonances of the β-furanose anomer of sedoheptulose were identified and quantified in all urine NMR spectra of the TALDO patients.
2. Materials and methods
2.1. Patients
Six patients from 4 families with TALDO deficiency were included in this study (Table 1). Clinical details about patients 1–3 have been described elsewhere (patient 1 [2], patients 2 and 3 [12]). In patients 4, 5, and 6, the diagnosis TALDO deficiency was confirmed at the metabolite level and the molecular genetic level.
Table 1.
Concentrations (μmol/mmol creatinine) of metabolites found in the urine from patients with TALDO deficiency.
| Patient | Agea | Sedoheptuloseb (β-furanose) | Erythronic acidb | Erythritolc | Ribitolc | Arabitolc | Oxoglutaric acidb | Fumaric acidb |
|---|---|---|---|---|---|---|---|---|
| 1 | 16 y | 390 | 550 | 137 | 67 | 142 | 130 | 42 |
| 2d | 1 m | 1700 | 2900 | 1058 | 234 | 345 | nd | 20 |
| 3d | 4 y | 160 | 770 | 205 | 41 | 192 | 50 | 44 |
| 4e | 3 y | 290 | 350 | 217 | 167 | 253 | 280 | 8 |
| 5e | 1 y | 870 | 670 | 494 | 208 | 298 | 440 | 8 |
| 6 | 4 y | 350 | 350 | 290 | 137 | 262 | 1090 | 110 |
| R | 0–3 m | <40 [6] | <120 | 58–162 [9] | 7–16 [9] | 27–97 [9] | ||
| R | 1–2 y | <10 [6] | <50 | 76–192 [9] | 9–24 [9] | 52–88 [9] | ||
| R | 2–6 y | <10 [6] | <50 | 55–104 [9] | 8–11 [9] | 32–78 [9] | ||
| R | 18–80 y | <10 [6] | <50 | 19–76 [9] | 2–5 [9] | 10–44 [9] | ||
| R | ≤5 y | 30–117 [20] | 4–10 [20] | |||||
| R | >5 y | 2–95 [20] | nd–4 [20] |
y, year(s), m, month(s);
analyzed by 1H-NMR;
analyzed by GC–MS;
Sibs from 2 different families;
R, Reference range; nd, not detectable.
2.2. Mice
Urine from TALDO-deficient “knock-out” mice was obtained from Dr. András Perl [7].
2.3. Authentic standards
Sedoheptulose is not commercially available and was isolated from the hybrid plant Sedum spectabile “Brillant” [13]. Leaves and stalk (70 g wet weight) were homogenized in 100 ml water and centrifuged through a 10-kD filter to remove proteins. Subsequently, the ultrafiltrate was concentrated by evaporation. The resulting preparation was further isolated preparatively by thin-layer chromatography (TLC) essentially as described by Engelke et al. [10] and measured as a model compound by 1H-NMR spectroscopy and GC–MS (Fig. 1A and B, respectively).
Fig. 1.

Sedoheptulose purified from Sedum spectabile “Brillant”. (A) 500-MHz 1H-NMR spectrum. Assignments “S” refer to the most prominent anomeric form of sedoheptulose, β-furanose. Subscript numbers refer to the carbon position in the molecule. Assignments “★” refer the other anomeric forms of sedoheptulose. (B) GC profile: Pooled urine spiked with purified sedoheptulose. Sedoheptulose anomers were present in a ratio furanose-1/furanose-2/pyranose-1/pyranose-2=22%:64%:8%:6%. In all likelihoods, furanose-1 and pyranose-1 are alpha forms and furanose-2 and pyranose-2 are the beta forms. (C1) Mass spectrum for the peak with assignment furanose-2 (m/z values {relative abundance}: 73{100}, 217{45}, 147{27}, 204 {18}, and 359{15}). Characteristic for the furanose forms is the low ratio for m/z 204:m/z 217 [18]. (C2) Mass spectrum for the peak with assignment pyranose-2 (m/z values {relative abundance}: 73{100}, 204{62}, 147{26}, 359{22}, and 217{12}). Characteristic for the pyranose forms is the high ratio for m/z 204:m/z 217 [18].
Calcium L-threonic acid, potassium D-erythronic acid, and sedoheptulose-7-phosphate are commercially available from TCI Chemicals (Portland, USA), Carbosynth (Berkshire, UK), and Sigma-Aldrich (St. Louis, MO, USA), respectively.
2.4. Sample preparation
The urine samples were centrifuged before analysis. A volume of 70 μl of a 20.2 mmol/l trimethylsilyl-2,2,3,3-tetradeuteriumpropionic acid (TSP, sodium salt; Aldrich) ·2H2O solution was added to 700 μl of urine as a chemical shift reference (δ=0.00) and as a lock signal. The pH of the urine was adjusted to 2.50±0.05 with HCl. Finally, we placed 650 μl of the sample into a 5-mm NMR tube (Wilmad Royal Imperial; Wilmad LabGlass, USA).
2.5. One-dimensional 1H-NMR spectroscopy and 1H-1H COSY spectroscopy
The urine samples were measured at 500 MHz on a Bruker DRX 500 spectrometer essentially as described before [14]. The samples were spun (14 Hz) during the 1D measurement. Shimming of the field homogeneity was satisfactory when the TSP line width at half peak height was smaller than 1 Hz. Phasing of the spectra was completed manually, and the baseline was corrected using a cubic spline function. Metabolite resonances were fitted semi-automatically with a Lorentzian line shape and the resulting areas were compared with area of creatinine singlet (3.13 ppm; the N–CH3 protons) to determine metabolite concentrations expressed as μmol/mmol creatinine.
2.6. GC–mass spectroscopy
Monosaccharides and polyols were analyzed as trimethylsilyl derivatives by GC–MS essentially as described by Janssen et al. [9]. A VF-01 ms WCOT column (20 m×0.15 mm×0.15 μm) from Varian was used. The method is not optimally suited for quantification of sugar acids.
3. Results
3.1. Sedoheptulose
The 1H-NMR spectrum of the isolated sedoheptulose in aqueous solution at pH 2.50 shows a complex pattern of resonances deriving from a mixture of furanose and pyranose anomers (Fig. 1A). Resonance assignments were based on previously reported NMR spectra of sedoheptulose (The Human Metabolome Database (HMDB, http://www.hmdb.ca), HMDB ID 03219) and sedoheptulose-7-phosphate [15] and simulated NMR spectra of four sedoheptulose anomers: α-furanose, β-furanose, α-pyranose, and β-pyranose (ACD/HNMR Predictor, Advanced Chemistry Development, Toronto, Ontario, Canada). The 1H-NMR spectrum shows that the β-furanose form of sedoheptulose had the highest concentration of the four anomeric forms. This is in line with observations on the anomeric forms of sedoheptulose-7-phosphate (α-furanose/β-furanose/α-pyranose= 20%:60%:20%) [15,16]. As indicated in Fig. 1A (★), the NMR spectrum showed smaller resonances at 4.17, 4.00, 3.94, 3.65, and 3.48 ppm representing the other anomeric forms of sedoheptulose. 1H-NMR assignments for the β-furanose anomer of sedoheptulose are described in Table 2. The splitting pattern and order of shift are comparable with sedoheptulose-7-phosphate. GC–MS analysis showed the presence of four sedoheptulose anomers with the furanose anomer as the most prominent form (Fig. 1B). The furanose and pyranose anomers were identified by their characteristic m/z fragments (Fig. 1C1 and C2, respectively).
Table 2.
1H-NMR assignments for sedoheptulose, sedoheptulose 7-phosphate, threonic acid, and erythronic acid.
| Metabolite | Pos | Multiplicity* | Chemical shift (ppm)
|
|
|---|---|---|---|---|
| pH 2.50 | pH 7.00 | |||
Sedoheptulose (β-furanose)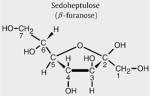
|
1 | AB | 3.55 | 3.58 |
| 3 | D | 4.08 | 4.09 | |
| 4 | DD | 4.29 | 4.31 | |
| 5 | M | 3.75 | 3.77 | |
| 6, 7 | Several | 3.85–3.80 | 3.8 | |
Sedoheptulose 7-phosphate (β-furanose)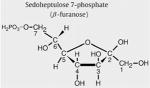
|
1 | AB | 3.56 | 3.54 [15] |
| 3 | D | 4.08 | 4.06 [15] | |
| 4 | DD | 4.32 | 4.33 [15] | |
| 5 | M | 3.81 | 3.78 [15] | |
| 6,7 | Several | 3.92 | 3.93 [15] | |
Threonic acid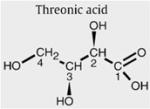
|
2 | D | 4.33 | 4.10 |
| 3 | M | 4.07 | 3.98 | |
| 4 | M | 3.68 | 3.66 | |
Erythronic acid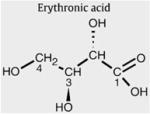
|
2 | D | 4.32 | 4.10 |
| 3 | M | 3.99 | 3.96 | |
| 4 | M | 3.69 | 3.66 | |
Pos, carbon position in the molecule.
D, doublet; M, multiplet; AB, AB system; DD, doublet–doublet.
3.2. Sedoheptulose in urine
In Fig. 2D, the urine 1H-NMR spectrum (4.4–3.4 ppm) from a 1-month-old TALDO patient is shown (Table 1, patient 2). Major metabolites in this region are creatinine (singlet at 4.29 ppm) and betaine (singlet at 3.97 ppm). Several unusual resonances were observed in this region (Fig. 2D, resonances S1, S3, S4, E2, E3, and E4). This pattern of resonances was found in the urine from all patients with TALDO deficiency and was not observed in NMR spectra of urine from 100 healthy children (age: 4 to 12 years). In TALDO deficiency, high micromolar concentrations of sedoheptulose, erythritol, and arabitol are present in the urine [4]. Comparison of the urine from patient 2 with the spectrum of the isolated sedoheptulose shows that the unusual resonances S were caused by the β-furanose anomer of sedoheptulose (Fig. 2C and D). Confirmation was provided by a 2D COSY NMR experiment on the isolated sedoheptulose and the urine sample of TALDO patient 2. Two characteristic cross peaks of sedoheptulose with the coordinates 4.08/4.29 and 4.29/3.75 ppm were observed in the 2-dimensional NMR urine COSY spectra of the TALDO patients. Quantification of β-furanose sedoheptulose was performed on the doublet at 4.08 ppm (Fig. 2D, resonance S3) and was 1700 μmol/mmol creatinine in patient 2. In TALDO-deficient patients, the urinary concentration of β-furanose sedoheptulose ranged between 160 and 1700 μmol/mmol creatinine (Table 1). The other three anomers of sedoheptulose (α-furanose, α-pyranose, and β-pyranose) were not observed in a urine NMR spectrum of the TALDO patients due to their low concentration and overlap by other resonances in the region between 4.3 and 3.5 ppm. The resonances of sedoheptulose-7P could not be observed in a 1D proton NMR spectrum of urine of our patients due to the known low concentration of sedoheptulose-7P in TALDO patients (2–24 μmol/mmol creatinine) and overlap by other resonances [6].
Fig. 2.

In vitro 1H-NMR spectra (500 MHz) of urine and model compounds measured at pH 2.50. (A) Threonic acid. (B) Erythronic acid. (C) Sedoheptulose isolated from Sedum spectabile. (D) Urine of a patient with transaldolase deficiency (S=sedoheptulose and E=erythronic acid. Subscript numbers refer to the carbon position in the molecule [Table 2]).
GC–MS analysis confirmed the presence of abnormally high concentrations of sedoheptulose in the urine of all TALDO patients. The relative abundance of its four anomeric forms was similar for all TALDO urine samples and the sedoheptulose from Sedum spectabile (Fig. 1B). The mass spectrum shows a characteristic ratio for m/z 204 and 217 in the furanose and the pyranose anomers (Fig. 1C; [17,18]). The m/z 217 is caused by a strong ion RO–CH=CH–CH–O+R from furanoid hemiacetals while the m/z 204 derives from the ion from pyranoid hemiacetals [18]. Comparison between the NMR data and the GC–MS profile makes it likely that the alpha forms of furanose and pyranose anomers have a shorter retention time on this column than the beta forms. In the GC–MS profile, the anomeric ratios of sedoheptulose were found to be furanose/pyranose=86%:14% for urine of TALDO patients and 92%:8% for the sedoheptulose isolated from Sedum spectabile.
3.3. Erythritol, ribitol, and arabitol
GC–MS analysis of urine from TALDO patients shows elevated concentrations of erythritol, ribitol, and arabitol (Table 1). The resonances of these polyols could not be observed in either the 1D urine spectra or the 2D COSY NMR spectra. An explanation for this is that the protons of erythritol, ribitol, and arabitol have a high degree of splitting [11]. Identification and quantification of these polyols is further hampered by overlapping resonances from other urinary metabolites in the region 4.0–3.5 ppm [11].
3.4. Erythronic acid
The other unknown resonances in the 1D spectrum (Fig. 2D, resonances E2, E4, and E3) could not be explained by the metabolite erythritol or arabitol. In order to identify resonances E, several NMR and GC–MS experiments were performed. COSY spectra revealed that the doublet resonance at 4.32 ppm was coupled with a resonance at 3.99 ppm. An NMR database (BRUKER, AMIX), containing spectra of 500 metabolites at various pH, revealed threonic acid as a candidate metabolite for the doublet resonance at 4.32 ppm. GC–MS analysis confirmed the presence of a high peak (with the same molecular weight of threonic acid (MW=136)) in urine samples of the TALDO patients. However, spiking threonic acid to the urine and 1D NMR experiments at various pH values proved that the resonances at 4.32 and 3.99 ppm were not caused by threonic acid.
Erythronic acid is the diastereomer of threonic acid. The compound is commercially available and was purchased at Carbosynth (Berkshire, UK). Erythronic acid in H2O at pH 2.5 (Fig. 2B) showed resonances at 4.32 (doublet, J=4.5 Hz), 3.69 (multiplet), and 3.99 (multiplet) ppm (Table 2). Quantification of erythronic acid in urine samples was performed on the single proton attached to the C2 (Fig. 2D, resonance E2) and the TSP singlet at 0.00 ppm was used as the concentration reference. After spiking erythronic acid to a urine sample at a level of 5.8 and 10.7 mmol/l, the recovery amounted to ±90%.
Erythronic acid in H2O at pH 2.5 (Fig. 2B) showed the same 1D and 2D resonance patterns as observed in the urine of the TALDO-deficient patients. The addition of pure erythronic acid to the urine sample of TALDO patient 5 resulted in an increase of the doublet at 4.32 ppm. Additionally, 1D 1H-NMR spectra of erythronic acid and the urine sample were recorded at pH 7.0. Both spectra showed a doublet resonance that shifted from 4.32 ppm (pH 2.50) to 4.10 ppm (pH 7.0). These experiments confirmed the occurrence of erythronic acid in urine of TALDO-deficient patients. The erythronic acid concentration ranged between 350 and 2900 μmol/mmol creatinine in the TALDO-deficient patients. In a control group of 100 healthy children (age: 4 to 12 years), we never found erythronic acid levels higher than 50 μmol/mmol creatinine, in line with results reported by Guneral et al. [19]. In the urine from three newborns (age: 3 to 5 days), higher values up to 150 μmol/mmol creatinine were found. Thus, erythronic acid occurs as a regular metabolite at low micromolar concentration in urine samples.
GC–MS analysis confirmed the presence of abnormally high concentrations of erythronic acid in the urine of TALDO patients. Fig. 3 shows the GC–MS chromatogram of a control urine (Fig. 3C) and urine from TALDO patient (Fig. 3B). The retention time and the mass spectrum of the erythronic acid peak in the urine of the TALDO patients correspond with the model compound spiked to a pooled urine sample (Fig. 3A).
Fig. 3.

GC–MS chromatogram of urine. (A) Pooled urine spiked with erythronic acid. (B) Urine of patient with transaldolase deficiency. (C) Control urine. (D) Mass spectrum of erythronic acid in the urine of the TALDO patient.
3.5. Other metabolic abnormalities
In five out of six TALDO-deficient patients, the urinary concentration of 2-oxoglutaric acid was increased, varying between 50 and 1090 μmol/mmol creatinine (reference ranges in μmol/mmol creatinine: ≤5 years=30–117, >5 years=2–95, adults=4–74 [20]). 2-Oxoglutaric acid was not increased in urine samples from TALDO patient 2. Fumaric acid was increased in four of the six TALDO patients (patients 1, 2, 3, and 6; Table 1). The urine of patient 6 (4 years old) showed the highest concentration of 2-oxoglutaric acid (1090 μmol/mmol creatinine) and fumaric acid (110 μmol/mmol creatinine). The concentrations of other metabolites from the citric acid cycle, succinic acid and citric acid, were normal in all urine samples from the TALDO patients. In addition, lactate was normal in all TALDO urine samples and increased blood lactate has not been observed in these patients.
3.6. TALDO-deficient “knock-out” mice
The urine from two TALDO-deficient “knock-out” mice were measured by 1D and 2D 1H-NMR spectroscopy and compared with the urine spectra from wild-type mice (Fig. 4). The 1D spectra of the two TALDO-deficient mice showed the presence of high concentrations of erythronic acid (1100 and 1700 μmol/mmol creatinine) and of the β-furanose anomer of sedoheptulose (2300 and 3000 μmol/mmol creatinine). These findings are consistent with the results observed in the urine NMR spectra of the TALDO-deficient patients. The β-anomers of sedoheptulose and erythronic acid were not observed in the urine NMR spectra of the wild-type mice. 2-Oxoglutaric acid and fumaric acid had a normal concentration in the urine of TALDO-deficient and wild-type mice.
Fig. 4.

In vitro 1H-NMR spectra (500 MHz) of urine from mice measured at pH 2.50. (A) Urine of a control mouse. (B) Urine of a mouse with transaldolase deficiency (S=sedoheptulose and E=erythronic acid. Subscript numbers refer to the carbon position in the molecule [Table 2]).
4. Discussion
1H-NMR spectroscopy provides an overall view of proton-containing metabolites present in body fluids. Therefore, in vitro NMR spectroscopy is suited to diagnose patients with inborn errors of metabolism [10,21]. This study describes the in vitro NMR investigations at the metabolite level on 6 patients with TALDO deficiency. The 1D and 2D COSY 1H-NMR spectra from these patients show a characteristic metabolic profile, mainly due to the resonances deriving from erythronic acid and the β-furanose anomer of sedoheptulose. GC–MS analysis confirmed the increased erythritol, ribitol, and arabitol concentrations in the urine from the TALDO-deficient patients. An increased concentration of erythronic acid in the urine of TALDO patients has not been described before. A low concentration of erythronic acid is always observed in urine from healthy children [19]. Our data show that on a molar basis, the excretion of erythronic acid is comparable to the sedoheptulose excretion. In this study, in 5 out of 6 TALDO-deficient patients, the concentration of erythronic acid in urine was higher than the concentration of the metabolites sedoheptulose, erythritol, ribitol, and arabitol. Therefore, erythronic acid ranks among the key metabolic features in TALDO deficiency and testifies a high flux through an as yet unknown metabolic pathway. As erythronic acid is always found in low concentration in the urine [19], the putative pathway shown in Fig. 5 may be present in healthy volunteers as well. The accumulation of erythronic acid in TALDO-deficient patients can putatively be explained as shown in Fig. 5. In TALDO deficiency, the flux through the PPP is disturbed leading to the accumulation of sedoheptulose-7-phosphate [4]. Wamelink et al. [4] speculated that the accumulation of sedoheptulose-7-phosphate is further metabolized into sedoheptulose as a detoxification process. Sedoheptulose can further be metabolized to erythrose via the enzymes fructokinase and aldolase (Fig. 5, enzymes 4 and 5 [22]). Subsequently, erythrose can be reduced to erythritol, which is found in high concentration in the urine of TALDO-deficient patients. Alternatively, erythrose may be phosphorylated into erythrose-4-phosphate as shown in Fig. 5, step 7 [23]. Erythrose-4-phosphate can be a substrate for transaldolase in some cell types. In addition, erythrose-4-phosphate is a known substrate for glyceraldehyde 3-phosphate dehydrogenase, converting it to 1,4-bis-phosphor-erythronate or to 4-phosphoerythronate [24,25]. In patients with TALDO deficiency, the flux through this enzymatic reaction will increase. The next step in the formation of erythronic acid is most probably a dephosphorylation by one of the “non-specific” phosphatases that are present in all cells. Erythrose may also be converted to erythronic acid via lactone formation (Fig. 5, step 10) in a similar way as D-galactose can be converted in galactosemia patients via D-galactono-lactone to D-galactonic acid. Confirmation of the pathway leading to erythronic acid by further experiments is required [26]. The availability of TALDO knock-out mice is an advantage in this respect.
Fig. 5.

Pentose phosphate pathway. Transaldolase deficiency (solid black square) results in accumulation of sedoheptulose, erythritol, and erythronic acid. (1) Transaldolase. (2) Sedoheptulokinase. (3) Cytosolic phosphatase. (4) Fructokinase. (5) Aldolase B. (6) Aldehyde reductase. (7) Putative (after Hauschildt et al. [23]). (8) Glyceraldehyde 3-phosphate dehydrogenase [24,25]. (9) Phosphatase. (10) Putative [26]. (11) Transketolase. (12) D-Ribulose 5-phosphate epimerase. (13) Ribose 5-phosphate isomerase.
In almost all TALDO-deficient patients, urinary fumaric acid and 2-oxoglutaric acid were elevated while lactate and other metabolites from the citric acid cycle such as succinic acid and malic acid were normal. The mechanism behind this accumulation of specific citric acid cycle intermediates remains to be elucidated. Via D-glyceraldehyde 3-phosphate, an intermediate of the glycolysis, an increased flux through the glycolysis toward the citric acid cycle may occur in TALDO-deficient patients. However, this would only lead to accumulating citric acid cycle intermediates when there is uncoupling of the citric acid cycle and the respiratory chain or when there is direct inhibition of specific citric acid cycle enzymes. The observation of increased citric acid cycle intermediates is of potential clinical interest. As yet hyperlactacidemia has not been observed in TALDO deficiency and to our knowledge extensive testing of the respiratory chain in muscle or liver of the patients has not been performed. Hanczko et al., however, did find evidence for mitochondrial dysfunction and oxidative stress in the liver of TALDO knock-out mice characterized by low NADPH, low glutathione, low ATP/ADP ratio, and accumulation of lipid hydroperoxides [27]. Our observations may be a starting point for further studies on mitochondrial aspects in human TALDO deficiency.
In conclusion, we have shown that NMR spectroscopy of urine can be used to diagnose patients with TALDO deficiency. The high urinary concentration of erythronic acid in TALDO patients has not been reported before and may serve as a new diagnostic hallmark of TALDO deficiency.
Abbreviations
- CSF
Cerebrospinal fluid
- GC–MS
Gas chromatography–mass spectroscopy
- IEM
Inborn error of metabolism
- LC–MS
Liquid chromatography–mass spectroscopy
- OMIM
Online Mendelian inheritance in man
- PPP
Pentose phosphate pathway
- RPI
Ribose 5-phosphate isomerase
- TALDO
Transaldolase
- TLC
Thin layer chromatography
- TSP
Trimethylsilyl-2,2,3,3-tetradeuterium propionic acid
References
- 1.Huck JH, Verhoeven NM, Struys EA, Salomons GS, Jakobs C, van der Knaap MS. Ribose-5-phosphate isomerase deficiency: new inborn error in the pentose phosphate pathway associated with a slowly progressive leukoencephalopathy. Am J Hum Genet. 2004;74:745–751. doi: 10.1086/383204. [DOI] [PMC free article] [PubMed] [Google Scholar]
- 2.Verhoeven NM, Huck JH, Roos B, Struys EA, Salomons GS, Douwes AC, van der Knaap MS, Jakobs C. Transaldolase deficiency: liver cirrhosis associated with a new inborn error in the pentose phosphate pathway. Am J Hum Genet. 2001;68:1086–1092. doi: 10.1086/320108. [DOI] [PMC free article] [PubMed] [Google Scholar]
- 3.Verhoeven NM, Wallot M, Huck JH, Dirsch O, Ballauf A, Neudorf U, Salomons GS, van der Knaap MS, Voit T, Jakobs C. A newborn with severe liver failure, cardiomyopathy and transaldolase deficiency. J Inherit Metab Dis. 2005;28:169–179. doi: 10.1007/s10545-005-5261-6. [DOI] [PubMed] [Google Scholar]
- 4.Wamelink MM, Struys EA, Jakobs C. The biochemistry, metabolism and inherited defects of the pentose phosphate pathway: a review. J Inherit Metab Dis. 2008;31:703–717. doi: 10.1007/s10545-008-1015-6. [DOI] [PubMed] [Google Scholar]
- 5.Tylki-Szymanska A, Stradomska TJ, Wamelink MM, Salomons GS, Taybert J, Pawlowska J, Jakobs C. Transaldolase deficiency in two new patients with a relative mild phenotype. Mol Genet Metab. 2009;97:15–17. doi: 10.1016/j.ymgme.2009.01.016. [DOI] [PubMed] [Google Scholar]
- 6.Wamelink MM, Smith DE, Jansen EE, Verhoeven NM, Struys EA, Jakobs C. Detection of transaldolase deficiency by quantification of novel seven-carbon chain carbohydrate biomarkers in urine. J Inherit Metab Dis. 2007;30:735–742. doi: 10.1007/s10545-007-0590-2. [DOI] [PubMed] [Google Scholar]
- 7.Vas G, Conkrite K, Amidon W, Qian Y, Banki K, Perl A. Study of transaldolase deficiency in urine samples by capillary LC–MS/MS. J Mass Spectrom. 2006;41:463–469. doi: 10.1002/jms.1004. [DOI] [PMC free article] [PubMed] [Google Scholar]
- 8.Wamelink MM, Smith DE, Jakobs C, Verhoeven NM. Analysis of polyols in urine by liquid chromatography–tandem mass spectrometry: a useful tool for recognition of inborn errors affecting polyol metabolism. J Inherit Metab Dis. 2005;28:951–963. doi: 10.1007/s10545-005-0233-4. [DOI] [PubMed] [Google Scholar]
- 9.Jansen G, Muskiet FA, Schierbeek H, Berger R, van der Slik W. Capillary gas chromatographic profiling of urinary, plasma and erythrocyte sugars and polyols as their trimethylsilyl derivatives, preceded by a simple and rapid prepurification method. Clin Chim Acta. 1986;157:277–293. doi: 10.1016/0009-8981(86)90303-7. [DOI] [PubMed] [Google Scholar]
- 10.Engelke UF, Moolenaar SH, Hoenderop SMGC, Morava E, van der Graaf M, Heerschap A, Wevers RA. Handbook of 1H-NMR spectroscopy in inborn errors of metabolism: body fluid NMR spectroscopy and in vivo MR spectroscopy. 2. SPS Verlagsgesellschaft; Heilbronn: 2007. [Google Scholar]
- 11.Moolenaar SH, van der Knaap MS, Engelke UF, Pouwels PJ, Janssen Zijlstra FS, Verhoeven NM, Jakobs C, Wevers RA. In vivo and in vitro NMR spectroscopy reveal a putative novel inborn error involving polyol metabolism. NMR Biomed. 2001;14:167–176. doi: 10.1002/nbm.690. [DOI] [PubMed] [Google Scholar]
- 12.Valayannopoulos V, Verhoeven NM, Mention K, Salomons GS, Sommelet D, Gonzales M, Touati G, de Lonlay P, Jakobs C, Saudubray JM. Transaldolase deficiency: a new cause of hydrops fetalis and neonatal multi-organ disease. J Pediatr. 2006;149:713–717. doi: 10.1016/j.jpeds.2006.08.016. [DOI] [PubMed] [Google Scholar]
- 13.La Forge FB, Hudson CS. Sedoheptose, a new sugar from Sedum spectabile. J Biol Chem. 1917;30:61–77. [Google Scholar]
- 14.Engelke UF, Kremer B, Kluijtmans LA, van der Graaf M, Morava E, Loupatty FJ, Wanders RJ, Moskau D, Loss S, van den Bergh E, Wevers RA. NMR spectroscopic studies on the late onset form of 3-methylglutaconic aciduria type I and other defects in leucine metabolism. NMR Biomed. 2006;19:271–278. doi: 10.1002/nbm.1018. [DOI] [PubMed] [Google Scholar]
- 15.Charmantray F, Helaine V, Legeret B, Hecquet L. Preparative scale enzymatic synthesis of D-sedoheptulose-7-phosphate from beta-hydroxypyruvate and D-ribose-5-phosphate. J Mol Catal B Enzym. 2008;57:6–9. [Google Scholar]
- 16.Kuchel PW, Berthon HA, Bubb WA, McIntyre LM, Nygh NK, Thorburn DR. 13C and 31P NMR studies of the pentose phosphate pathway in human erythrocytes. Biomed Biochim Acta. 1990;49:S105–S110. [PubMed] [Google Scholar]
- 17.Soria AC, Sanz ML, Villamiel M. Determination of minor carbohydrates in carrot (Daucus carota L.) by GC–MS. Anal Methods. 2009;114:758–762. [Google Scholar]
- 18.Okuda Takuo, Saito Setsuo, Hayashi Masayuki. Trimethysilylation and G.L.C.–mass spectrometry of 3-ketoses and 2-heptuloses. Carbohydr Res. 1997;68:1–13. [Google Scholar]
- 19.Guneral F, Bachmann C. Age-related reference values for urinary organic acids in a healthy Turkish pediatric population. Clin Chem. 1994;40:862–866. [PubMed] [Google Scholar]
- 20.Blau N, Duran M, Blaskovics ME, Gibson KM. Physician’s guide to the laboratory diagnostics of metabolic diseases. 2. Springer-Verlag; Berlin Heidelberg: 2003. [Google Scholar]
- 21.Moolenaar SH, Engelke UF, Wevers RA. Proton nuclear magnetic resonance spectroscopy of body fluids in the field of inborn errors of metabolism. Ann Clin Biochem. 2003;40:16–24. doi: 10.1258/000456303321016132. [DOI] [PubMed] [Google Scholar]
- 22.Kardon T, Stroobant V, Veiga-da-Cunha M, Schaftingen EV. Characterization of mammalian sedoheptulokinase and mechanism of formation of erythritol in sedoheptulokinase deficiency. FEBS Lett. 2008;582:3330–3334. doi: 10.1016/j.febslet.2008.08.024. [DOI] [PubMed] [Google Scholar]
- 23.Hauschildt S, Chalmers RA, Lawson AM, Schultis K, Watts RW. Metabolic investigations after xylitol infusion in human subjects. Am J Clin Nutr. 1976;29:258–273. doi: 10.1093/ajcn/29.3.258. [DOI] [PubMed] [Google Scholar]
- 24.Ryzlak MT, Pietruszko R. Heterogeneity of glyceraldehyde-3-phosphate dehydrogenase from human brain. Biochim Biophys Acta. 1988;954:309–324. doi: 10.1016/0167-4838(88)90086-6. [DOI] [PubMed] [Google Scholar]
- 25.Ishii Y, Hashimoto T, Minakami S, Yoshikawa H. The formation of erythronic acid 4-phosphate from erythrose 4-phosphate by glyceraldehyde-3-phosphate dehydrogenase. J Biochem. 1964;56:111–112. doi: 10.1093/oxfordjournals.jbchem.a127952. [DOI] [PubMed] [Google Scholar]
- 26.Wehrli SL, Berry GT, Palmieri M, Mazur A, Elsas L, Segal S. Urinary galactonate in patients with galactosemia: quantitation by nuclear magnetic resonance spectroscopy. Pediatr Res. 1997;42:855–861. doi: 10.1203/00006450-199712000-00022. [DOI] [PubMed] [Google Scholar]
- 27.Hanczko R, Fernandez DR, Doherty E, Qian Y, Vas G, Niland B, Telarico T, Garba A, Banerjee S, Middleton FA, Barrett D, Barcza M, Banki K, Landas SK, Perl A. Prevention of hepatocarcinogenesis and increased susceptibility to acetaminophen-induced liver failure in transaldolase-deficient mice by N-acetylcysteine. J Clin Invest. 2009;119:1546–1557. doi: 10.1172/JCI35722. [DOI] [PMC free article] [PubMed] [Google Scholar]