Abstract
A new simple and highly sensitive spectrophotometric method for determining nitrogen dioxide in air was developed. The method is based on converting atmospheric nitrogen dioxide to nitrite ions within the IVL passive samplers used for samples collection. Acidifying nitrite ions with concentrated HCl produced the peroxynitrous acid oxidizing agent which was measured using 2, 2-azino-bis(3-ethyl benzothiazoline)-6-sulfonic acid-diammonium salt (ABTS) as reducing coloring agent. A parallel series of collected samples were measured for its nitrite content using a validated ion chromatographic method.
The results obtained using both methods were compared in terms of their sensitivity and accuracy. Developed spectrophotometric method was shown to be one order of magnitude higher in sensitivity compared to the ion chromatographic method. Quantitation limits of 0.05 ppm and 0.55 μg/m3 were obtained for nitrite ion and nitrogen dioxid, respectively. Standard deviations in the ranges of 0.05–0.59 and 0.63–7.92 with averages of 0.27 and 3.11 were obtained for determining nitrite and nitrogen dioxide, respectively.
Student-t test revealed t-values less than 6.93 and 4.40 for nitrite ions and nitrogen dioxide, respectively. These values indicated insignificant difference between the averages of the newly developed method and the values obtained by ion chromatography at 95% confidence level.
Compared to continuous monitoring techniques, the newly developed method has shown simple, accurate, sensitive, inexpensive and reliable for long term monitoring of nitrogen dioxide in ambient air.
Keywords: spectrophotometry, nitrogen dioxide, nitrous acid, peroxynitrous acid, atmosphere, ABTS, passive samplers, ion chromatography
1. Introduction
Several analytical methods have been used for nitrite trace analysis. Many spectrophotometric methods are based on formation of colored azodyes that can be measured at certain wavelengths.1 Other methods include kinetic,2,3 chromatography,4,5 potentiometry,6,7 amperometry,8 polarography,9 capillary electrophoresis,10 spectrophotometry11,12 and flow injection analysis (FIA)13–16 have also been reported. Some of these reported methods have the disadvantages of being time consuming and serious interferences.
ABTS is a redox coloring reagent that has been used for enzymatic peroxide tests,17 percarboxylic acid analysis18 and selective determination of reactive bromine and chlorine species.19 Oxidiation of ABTS undergoes two e-electron transfer steps giving rise to ABTS•+ and ABTS++ as stable green and violet colored radicals that have broad absorbance spectra with several maxima and high molar absorptivities at 415, 650, 728, and 815 nm.20 These radicals were obtained in enzymatic oxidizing of ABTS using myoglobin21 or horseradish peroxidase22 and in chemical oxidation using MnO2,23 potassium persulfate,24 peroxide radicals25 or electrochemically.26
On the other hand, passive sampling involve sampling a specific gas pollutant or vapor from the atmosphere at a rate controlled by diffusion through a static air layer or permeation through a membrane.27 Passive sampling methods are characterized by being of low cost, low technical demand as well as expediency for monitoring many polluted locations.28,29
The aim of this study is to develop a new method for measuring low concentrations of nitrogen dioxide in the atmosphere. The method is based on extracting NO2 from air as nitrite using the passive sampling technique. Nitrite ions extracted will be subsequently acidified and measured using 2,2-azino-bis(3-ethyl benzothiazoline)-6-sulfonic acid-diammonium salt (ABTS) as oxidation-reduction coloring reagent. The results obtained will be compared with ion chromatographic measurements on the same samples batches.
2. Experimental
2.1. Materials
Reagent grade chemicals and deionized water were used throughout. 2,2-azino-bis(3-ethyl benzothiazoline)-6-sulfonic acid-diammonium salt reagent (ABTS) was purchased from Sigma-Aldrich. Hydrochloric acid and sodium nitrite were purchased from Merck. IVL passive sampler was purchased from the Swedish Environmental Research Institute (IVL).
2.2. Standard solutions
A stock (10−3 M) standard solution of ABTS was prepared by dissolving 0.0548 g of diammonium-ABTS salt in 100.0 ml of deionized water and stored at 4 °C.
A 10.0 ppm standard solution of sodium nitrite into 100.0 ml of deionized water was prepared as usual. A 0.1 M hydrochloric acid solution into 1.0 L of deionized water was prepared and standardized as usual.
Impregnation solution for the passive samplers’ filters was prepared by dissolving 7.90 g of NaI and 0.88 g of NaOH into 100.0 ml methanol. The mixture was shacked well in ultrasonic bath.
A 10−3 M Triethanolamine as nitrite ions extracting solution was prepared by transferring 13.3 μl of triethanolamine to a 100.0 ml volumetric flask. The solution was made to 100.0 ml using deionized water.
2.3. Apparatus
Absorption measurements were performed using Cary-50 UV-Vis spectrophotometer (Varian, Inc., Austria) with 1.0 cm quartz cells.
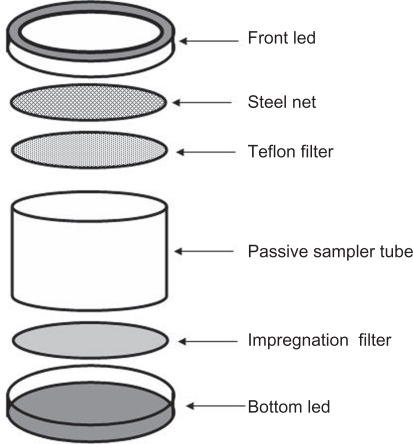
IVL passive samplers developed by the Swedish Environmental Research Institute were used to collect nitrogen dioxide from air. A sampler consists of bottom led impregnation filter, passive sampler tube, Teflon filter, steel net and front led as shown in Figure 1.
Figure 1.
Components of the IVL passive sampler.
Samplers were mounted on a shielding plate with their open sides oriented downwards to protect them from direct exposure to sunlight, wind, dust fall and rain. Exposure time periods of fourteen days were applied for all samplers and then transferred to the lab for analyzing.
An ICS-90 ion chromatograph, Dionex Corp., USA, supported with an AS9-SC anion analytical column and anion Micro Membrane Suppressor (AMMS) was also used for measuring nitrite ions concentrations in the same samples batches.
2.4. Procedures
2.4.1. Optimization of the spectrophotometric method
Several experiments were conducted to establish the optimum conditions for the reaction between nitrite ions and ABTS. Variables such as time, concentrations of HCl, ABTS and nitrite and the order of reagents’ addition were investigated. Soichiometry of the reaction between nitrite and ABTS was also studied.
2.4.1.1. Effect of time
The effect of time on the rate of ABTS oxidation was studied by mixing 1.0 ml of 10−3 M ABTS with 3.0 ml of 0.1 M HCl and 1.0 ml of 5.0 ppm nitrite solution into 10.0 ml volumetric flask. The solution was made up to 10.0 ml using deionized water and its absorption spectra were scanned at three minutes time intervals in the wavelength range 200–500 nm.
2.4.1.2. Effect of HCl concentration
The concentration of HCl needed to oxidize ABTS at convenient reaction rate was studied. Into 10.0 ml volumetric flasks, 1.0 ml portions of the 10−3 M ABTS were mixed with 1.0 ml of the 10.0 ppm nitrite solution each. A 1.0 ml of (0.001–1 M) standard HCl solution was added to each flask.
In another experiment, volumes of 0.5–8 ml of 0.1 M HCl solution were added to 10.0 ml volumetric flasks containing 1.0 ml of the 10−3 M ABTS mixed with 1.0 ml of the 10.0 ppm nitrite solution. The total volume was made up to 10.0 ml and their absorption spectra were scanned in the wavelength range 200–500 nm.
2.4.1.3. Effect of addition order
The effect of addition order of HCl, ABTS and nitrite ions on the reaction rate was studied. A mixture of 1.0 ml of 10−3 M ABTS, 3.0 ml of 0.1 M HCl and 1.0 ml of 5.0 ppm nitrite ions was prepared several times by inversing the order of addition. Resulted solutions were made up to 10.0 ml into volumetric flask. Solutions were incubated for 2.0 minutes at room temperature and scanned in the wavelength range 200–500 nm.
2.4.1.4. Calibration curve
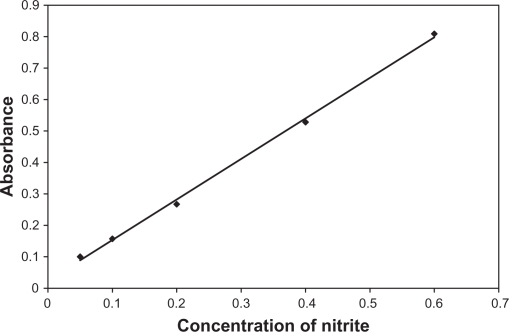
Into 10.0 ml volumetric flasks, 50–600 μl portions of the 10.0 ppm standard nitrite ions were added to mixtures of 3.0 ml of 0.1 M HCl and 1.0 ml of 10−3 M ABTS and made up to 10.0 ml using deionized water. Resulted solutions were incubated for 2.0 minutes at room temperature and their absorbencies at 415 nm against blank containing all ingredients except nitrite ions were measured. Nitrite concentrations in the range of 0.05–0.6 ppm were obtained. Calibration graph of absorbance versus concentration of nitrite ion was plotted.
2.4.2. Sampling of nitrogen dioxide from air (real samples)
The filter paper placed into the sampler’s bottom led was impregnated by 50 μl of the impregnation solution and left to dry for ten minutes. Samplers were then assembled and mounted for fourteen days in selected locations of the city. Nitrogen dioxide in atmosphere was converted into nitrite on the sampler filters. The filters were removed then placed in 10.0 ml vials and soaked into 5.0 ml of the extracting solution. Triethanolamine in extracting solution reduces the iodine formed on the sampler due to the reaction of iodide from the impregnation solution with nitrogen dioxide from air. Vials were closed and shacked carefully to ensure full extraction of all nitrite ions from the filters into the solution.
A 0.7 ml of each nitrite solution produced was mixed with 3.0 ml of 0.1 M hydrochloric acid and 1.0 ml of 10−3 M ABTS. The solution was made up to 10.0 ml by deionized water. Resultant solution was incubated for two minutes at room temperature and its absorbance at 415 nm was recorded. The analysis was repeated at least three times for each sample and the average result was calculated.
A blank sampler treated in the same way, was mounted in the laboratory during the sampling period and analyzed in the same way.
2.4.3. Ion chromatography
Nitrite ions concentrations were measured using AS9-SC anion column on the Dionex ICS-90 ion chromatograph. Anion Micro-Membrane suppressor (AMMS) and dilute sulfuric acid for re-generation were used. A 1.8 × 10⁻³ M sodium carbonate was used as eluent. Standard nitrite solutions, ranging from 1–20 ppm, were prepared using the stock standard solution (100.0 ppm) purchased from Dionex. Calibration graph was prepared by plotting the area integration of the nitrite peak versus the concentration of standard samples. Nitrite ions extracted from the passive samplers were measured under the same condition.
2.4.4. Calculations of the NO2 concentration in air
Concentration of nitrogen dioxide (NO2) in air was calculated using the following formula equation given by IVL protocol.30–32
where C(NO2) is the concentration of the sampled gas in units of μg NO2/m3, m( ) is the concentration of determined in the extract from the filter in the unit of μg/ml, ν is the extraction volume of the filter and equals 5 ml for the IVL samplers used, t is the time of exposure in days (ie, 24 h units) and 0.0323 is the sampler uptake rate for NO2 which has the unit of m3/day.
3. Results and Discussion
3.1. Nitrite decomposition in aqueous acidic solutions
Nitrite ions in acid solution readily form nitrous acid (HNO2) with rate constant of 1.0 × 10⁹ M−1 s−1 (reaction 1).33 Nitrous acid in strongly acidic solution rapidly dissociates into the active electrophile nitrosonium ion (NO+) and hydrogen peroxide (reaction 2). The life time of NO+ in water is very short (∼3 × 10⁻¹⁰ s) and is only found at high acidity.34 This leads to the accumulation of H2O2 in solution which reacts with HNO2 to produce peroxynitrous acid (ONOOH) whose pKa is in the range of 6.5–6.8 (reaction 3).35 Although the rate constant for reaction 5 is approximately 50% higher than reaction 6, accumulation of NO+ from reaction 2 will shift the former to the backward. Consequently reaction 6 will dominant.35
| (1) |
| (2) |
| (3) |
| (4) |
| (5) |
| (6) |
H+ catalyzed decomposition of ONOOH at pH < 2 (in our case) is the dominant mechanism with a decay rate linearly proportional to [H+]. Due to the differences in the rate constants, decomposition/homolysis of ONOOH will give different oxidant species in solution; namely •OH, •NO2, NO2+, NO+ and H2O2 (reactions 4–6).36
Peroxynitrite ion (ONOO−) is a relatively stable species having a maximum absorption at 302 nm with ɛ = 1670 ± 50 M−1 cm−1,37 whereas ONOOH is less stable with maximum absorption at 240 nm and ɛ = 770 M−1 cm−1. No appreciable absorption was observed above 300 nm for both species.38
ONOOH indirectly oxidizes substrates via the highly oxidizing species formed during its decomposition such as •NO2 and •OH radicals. It also fast reacts directly with some substrates such as sulfhydryls,39 metal complexes,40 ebselen,41 iron,42 manganese43 porphyrins, heme proteins44 and ABTS.45 Reducing substances such as ebselen and iron(III) porphyrin were assumed to scavenge ONOOH before being isomerized. This is because ONOOH oxidizes substrate with the same rate as its isomerization.46,47 Rate constants of 2.0 × 10⁶ M−1 s−1 and 2.2 × 10⁶ M−1 s−1 were reported for ebselen48 and iron(III) porphyrin,41 respectively.
3.2. Absorption spectra of ABTS+
In our developed method, oxidation of 2,2-azino-bis (3-ethyl benzothiazoline)-6-sulfonic acid-diammonium salt (ABTS) by peroxynitrous acid or its decomposition products gave the oxidized form of (ABTS•+). ABTS•+ has a green-blue color, which absorbs strongly at 415 nm. The reaction is going in two electrons oxidation process as follows:
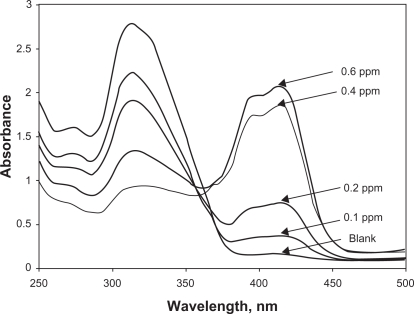
Figure 3 shows the UV-VIS absorption spectra of 1.0 ml of 10−3 M ABTS after successive additions of different volumes of standard nitrite solution to produce concentrations of 0.1–0.6 ppm. The broad intense band at 315 nm is attributed to the reduced form of ABTS. This band was not shown when ABTS totally existed in the reduced form. Upon conversion to the oxidized from (ABTS+), spectra showed broad intense bands at 415 nm. This strong band corresponds to the half oxidation of ABTS to ABTS•+ has been used for monitoring nitrite ions concentration in solution throughout our investigation. Figure 3 shows that by increasing nitrite concentration, the intensity of the 315 nm band decreased while that of 415 nm band increased. An isoesbertic point around 360 nm was obtained indicating a reversible redox reaction at equilibrium.
Figure 3.
Absorption spectra of 1.0 ml of the 10−3 M ABTS at different concentrations (0.1–0.6 ppm) of nitrite.
Other previously reported bands at 650, 732 and 820 nm were not shown since they are produced by the fully oxidized species (ABTS++) which was not formed in our study.49
Therefore the increase in absorbance at 415 nm was used for measuring the change in nitrite ion concentration of nitrite in our collected samples.
3.3. Effect of hydrochloric acid
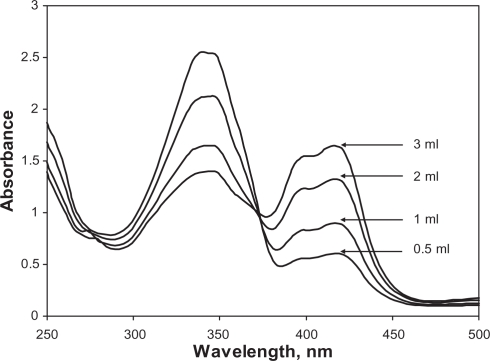
The effect of HCl concentration on the reaction rate was studied by adding 0.5–3 ml of 0.1 M standard HCl solution to 1.0 ml of 10−3 M ABTS mixed with 1.0 ml of 10 ppm nitrite solution and the total volume was made up to 10 ml by deionized water. Solutions were incubated for two minutes at room temperature and their UV-Vis spectra were scanned. The rate of reaction was found to increase with increasing HCl concentration as shown in Figure 4. After several experiments, 3.0 ml of 0.1 M. HCl showed nearly the complete conversion of 1.0 ml of 10−3 M ABTS to ABTS+. Therefore all subsequent measurements were made using 3 ml of 0.1 M HCl.
Figure 4.
Effects of HCl concentration on the reaction of 1.0 ml of 10−3 M ABTS mixed with 1.0 ml of 10 ppm nitrite solution into 10.0 ml volumetric flasks. 0.5–3 ml of 0.1 M standard HCl solution was added. The total volume was adjusted to 10.0 ml in each flask.
3.4. Effect of time
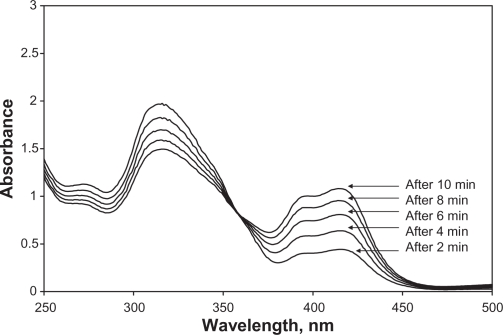
Figure 5 shows the effect of time on the reaction rate of 1.0 ml of 10−3 M ABTS mixed with 3.0 ml of 0.1 M HCl and 1.0 ml of 5.0 ppm nitrite. A slow reaction that needs long time to be terminated was observed. Calibration curves at different incubation time intervals were plotted and used for checking concentrations of standard nitrite samples. Two minutes incubation time gave the best linear regression and recoveries. The reason can be attributed to a change in the kinetic order of the reaction by time. Therefore, two minutes incubation time was used in our all subsequent measurements.
Figure 5.
Effect of time on reaction rate of 1.0 ml of 10−3 M ABTS mixed with 3.0 ml of 0.1 M HCl and 1 ml of 5.0 ppm nitrite solution. The mixture was made to 10.0 ml by deionized water in volumetric flask. The absorption spectra were scanned at 2 minutes time intervals.
3.5. Effect of order of addition
Addition order was studied by mixing 3.0 ml of 0.1 M HCl with 1.0 ml of 5.0 ppm nitrite solution and 1.0 ml of 10−3 M ABTS as mentioned in section 2.4.1.3. The mixture was incubated for two minutes and its absorbance was measured at 415 nm. Addition order was inversed and absorbance was measured similarly. The results showed that the reaction between ABTS and nitrite in strong acidic solution is not affected by the addition order of reagents.
3.6. Calibration and sensitivity
Figure 5 shows the calibration plot of nitrite concentration in ppm versus absorbance at 415 nm. Straight line in the dynamic range of 0.05–0.6 μg/ml with linear regression of Y = 1.271 X + 0.032 was obtained. Correlation coefficient, R2 = 0.998, and slope of 1.271 were obtained. Quantitation limit of 0.05 ppm indicates high sensitivity for measuring low concentration of nitrite was also obtained. This limit is far less than the quantitation limits of spectrophotometric fluorimetric and electrochemical methods for measuring nitrite in water, food, saliva, urine previously published.50 This limit also reflects a 0.55 μg/m3 as quantitation limit for determining nitrogen dioxide in atmosphere.
3.7. Application to real samples
To test the validity of developed spectrophotometric method in measuring nitrogen dioxide in air, a number of passive samplers were distributed in different locations of the city over the months May, June, July and September. Samplers were collected after fourteen days exposure. Nitrogen dioxide in air diffused through the filter was converted into nitrite by reaction with iodide and then extracted into deionized water.
Nitrite contents were subjected to determination using the developed and the ion chromatographic methods. The results obtained are shown in Table 1. A good agreement between results obtained for nitrite and nitrogen dioxide contents by both methods were obtained. Standard deviations of 0.05–0.59 and 0.63–7.92 for determining nitrite and nitrogen dioxide were respectively obtained.
Table 1.
Nitrite ion and nitrogen dioxide concentrations of some air samples using the newly developed spectrophotometric method and the ion chromatographic method.
| No. | Season | Average absorbance |
Average ppm concentrations of nitrite ions |
t-value |
Average μg/m3 concentrations of nitrogen dioxide in air |
t-value | ||||
|---|---|---|---|---|---|---|---|---|---|---|
| Spectrophotometric method | SD** | Ion chromatogr. method | Spectrophotometric method | SD** | Ion chromatorgr. method | |||||
| 1 | May | 0.557 | 5.90 | 0.23 | 5.18 | 5.38 | 65.24 | 3.14 | 57.28 | 4.40 |
| 2 | May | 0.287 | 2.87 | 0.18 | 3.29 | 4.04 | 31.70 | 2.44 | 36.38 | 3.32 |
| 3 | May | 0.323 | 3.27 | 0.59 | 3.35 | 0.24 | 36.19 | 7.92 | 37.04 | 0.19 |
| 4 | June | 0.635 | 6.76 | 0.08 | 6.44 | 6.93 | 74.69 | 2.96 | 71.21 | 2.04 |
| 5 | June | 0.418 | 4.33 | 0.22 | 3.8 | 4.09 | 47.91 | 3.03 | 42.02 | 3.36 |
| 6 | July | 0.224 | 2.15 | 0.10 | 1.34 | 11.90 | 23.81 | 1.24 | 14.82 | – |
| 7 | July | 0.135 | 1.16 | 0.07 | ND* | – | 12.83 | 0.96 | ND* | – |
| 8 | July | 0.434 | 4.52 | 0.28 | 4.6 | 0.50 | 49.98 | 3.78 | 50.86 | 0.40 |
| 9 | July | 0.530 | 5.60 | 0.37 | 5.83 | 1.09 | 61.92 | 4.97 | 64.46 | 0.88 |
| 10 | Sept. | 0.297 | 2.97 | 0.05 | 3.05 | 3.01 | 32.88 | 0.63 | 33.72 | 2.31 |
Notes:
ND, not detected;
SD, standard deviation was calculated based on at least three determinations.
Applying student-t test for the results obtained by both methods gave t-values less than 6.93 and 4.40 for nitrite ions and nitrogen dioxide, indicating insignificant difference in accuracy between the average of the newly developed spectrophotometric method and the ion chromatographic method at 95% confidence level.
Since the concentration range of the developed method is less than the ion chromatographic method (0.05–0.6 μg/ml), samples were diluted before spectrophotometric measurements.
4. Conclusion
A new highly sensitive spectrophotometric method to measure low concentrations of nitrogen dioxide in ambient atmosphere was developed. The method is based on converting NO2 to nitrite ions within the IVL passive samplers used for samples collection. Resultant nitrite ions were rapidly converted to peroxynitrous acid by addition of concentrated HCl. Peroxynitrous acid was calorimetrically measured using ABTS as reducing agent. The latter was converted into ABTS+ which absorbed maximally at 415 nm. For comparison, collected samples were measured for its nitrite contents using a validated ion chromatographic method.
Developed new spectrophotometric method has shown to be one order of magnitude higher in sensitivity compared to the ion chromatographic method. Quantitation limits of 0.05 ppm and 0.55 μg/m3 were obtained for nitrite ion and nitrogen dioxide, respectively. Standard deviations in the ranges of 0.05–0.59 and 0.63–7.92 with averages of 0.27 and 3.11 were obtained for determining nitrite and nitrogen dioxide, respectively.
The quantitation limit of 0.05 ppm nitrite ions obtained by developed method is less than some quantitation limits obtained by spectrophotometric, fluorimetric and electrochemical methods previously reported for measuring nitrite ions in water, food, saliva and urine.50
Student-t test revealed t-values less than 6.93 and 4.40 for nitrite ions and nitrogen dioxide, respectively. These values revealed insignificant difference between the average values determined by the newly developed method and values obtained by the validated ion chromatographic method at the 95% confidence level. Compared to continuous monitoring techniques, the newly developed method has shown simple, accurate, sensitive, inexpensive and reliable for long time monitoring of nitrogen dioxide in air.
Figure 2.
Two electron oxidation steps of ABTS (2,2-azino-bis(3-ethylben-zothiazoline)-6-sulfonate) to ABTS+ and ABTS++.
Figure 6.
Calibration curve of nitrite concentration in ppm versus absorbance. Successive amounts of nitrite solution were added to 3 ml of 0.1 M HCl and 1 ml of 10−3 M ABTS. The solution was made up to 10.0 ml by deionized water.
Footnotes
Disclosure
This manuscript has been read and approved by all authors. This paper is unique and is not under consideration by any other publication and has not been published elsewhere. The authors and peer reviewers of this paper report no conflicts of interest. The authors confirm that they have permission to reproduce any copyrighted material.
References
- 1.Snell FD. Wiely Interscience Publication, John Wiely and Sons, inc; Toronto, Canada: 1981. “Photometric and fluorimetric methods of analysis nonmetals”. [Google Scholar]
- 2.Koupparis M, Walczak K, Malmstadt H. Analyst. 1982;107:1309. [Google Scholar]
- 3.Liang B, Iwatsuki M, Fukasawa T. Analyst. 1994;119:2113. [Google Scholar]
- 4.Butt S, Riaz M, Iqbal M. Talanta. 2001;55:789. doi: 10.1016/s0039-9140(01)00502-1. [DOI] [PubMed] [Google Scholar]
- 5.Siu D, Henshall A. Chromatography JA. 1998;804:157. doi: 10.1016/s0021-9673(97)01245-4. [DOI] [PubMed] [Google Scholar]
- 6.Li JZ, Wu X, Yuan R, Lin H, Yu RQ. Analyst. 1994;119:1363. [Google Scholar]
- 7.Schaller U, Bakker E, Spichiger U, Pretsch E. Talanta. 1994;41:1001. doi: 10.1016/0039-9140(94)e0048-v. [DOI] [PubMed] [Google Scholar]
- 8.Bertotti M, Pletcher D. Anal Chim Acta. 1997;337:49. [Google Scholar]
- 9.Ximenes M, Rath S, Reyes F. Talanta. 2000;51:49. doi: 10.1016/s0039-9140(99)00248-9. [DOI] [PubMed] [Google Scholar]
- 10.Oztekin N, Said M, Erim F. Food Chem. 2002;76:103. [Google Scholar]
- 11.AOAC Official methods of analysis. 16th ed. Gaithersburg: Association of official analytical chemists; 1997. [Google Scholar]
- 12.Kawakami T, Igrashi S. Anal Chim Acta. 1996;333:175. [Google Scholar]
- 13.Gine M, Bergamin F, Zagatto E, Reis B. Anal Chim Acta. 1980;114:191. [Google Scholar]
- 14.Andradea R, Viana C, Guadagnin S, Reyesb F, Rath S. Food Chemistry. 2003;80:597. [Google Scholar]
- 15.Zhao YQ, He Y, Gan W, Yang L. Talanta. 2001;56:619. doi: 10.1016/s0039-9140(01)00624-5. [DOI] [PubMed] [Google Scholar]
- 16.Monser L, Sadok S, Greenway G, Shah I, Uglow R. Talanta. 2002;57:511. doi: 10.1016/s0039-9140(02)00057-7. [DOI] [PubMed] [Google Scholar]
- 17.Bergmeyer HU. Methods of Enzymatic Analysis I. 3rd ed. Verlag Chemie; Weinheim: 1986. pp. 210–7. [Google Scholar]
- 18.Pinkernell U, Lue ke HJ, Karst U. Analyst. 1997;122:567–71. [Google Scholar]
- 19.Pinkernell U, Nowack B, Gallard H, Gunten U. Water Res. 2000;34(18):4343. [Google Scholar]
- 20.Scott S, Chen J, Bakac A, Espenson J. J Phys Chem. 1993;97:6710. [Google Scholar]
- 21.Rice-Evans CA, Miller N. Methods in Enzymology. 1994;234:279. doi: 10.1016/0076-6879(94)34095-1. [DOI] [PubMed] [Google Scholar]
- 22.Arnao MB, Cano A, Hernández-Ruiz J, Garcιa-Cánovas F, Acosta M. Anal Biochem. 1996;236:255. doi: 10.1006/abio.1996.0164. [DOI] [PubMed] [Google Scholar]
- 23.Benavente-Garcιa O, Castillo J, Lorente J, Ortuño A. Food Chemistry. 2000;68:457. doi: 10.1021/jf990665o. [DOI] [PubMed] [Google Scholar]
- 24.Re R, Pellegrini N, Proteggente A, Pannala A, Yang M, Rice-Evans C. Free Radical Biology and Medicine. 1999;26:1231. doi: 10.1016/s0891-5849(98)00315-3. [DOI] [PubMed] [Google Scholar]
- 25.Van den Berg R, Haenen G, van den Berg H, Bast A. Food Chemistry. 1999;66:511. [Google Scholar]
- 26.Alonso AM, Domιnguez C, Guillén D, Barroso C, Agric J. Food Chem. 2002;50:3112. doi: 10.1021/jf0116101. [DOI] [PubMed] [Google Scholar]
- 27.Berlin A, Brown RH, Saunders KJ. “Diffusive Sampling: An Alternative Approach to Workplace Air Monitoring” CEC Pub. No. 10555EN, Commission of the European Communities, Brussels-Luxenbourg; 1987. [Google Scholar]
- 28.Gorecki T, Namiesnik J. Trends in Analytical Chemistry. 2002;21(4):276. [Google Scholar]
- 29.Namiesnik J. Anal Bioanal Chem. 2005;381:279. doi: 10.1007/s00216-004-2830-8. [DOI] [PubMed] [Google Scholar]
- 30.Diffusive samplers for air monitoring, swedish environmental research institute ltd, URL: http://www.ivl.se/en/business/monitoring/diffusive_samplers.asp.
- 31.Ayers G, Keywood M, Gillet R, Mannis P, Malfroya H, Bardsley T. Atm Environ. 1990;32(20):3587. [Google Scholar]
- 32.Royset O, Siversteen B. Environmental information and monitoring program (EIMP) DANIDA; Egypt: 1998. “Air quality monitoring component, mission 10 report”. [Google Scholar]
- 33.Benson SW. The foundations of chemical kinetics. Robert E. Krieger Publishing Company; Florida: 1982. p. 675. [Google Scholar]
- 34.Akhter S, Green JR, Root P, Thatcher GJ, Mutus B. Nitric Oxide Boil Chem. 2003;8:214–21. doi: 10.1016/s1089-8603(03)00031-4. [DOI] [PubMed] [Google Scholar]
- 35.Merenyi G, Lind J, Czapski G, Goldstein S. Inorg Chem. 2003;42:3796. doi: 10.1021/ic025698r. [DOI] [PubMed] [Google Scholar]
- 36.Goldstein S, Lind J, Merenyi G. Chem Rev. 2005;105:2457–70. doi: 10.1021/cr0307087. [DOI] [PubMed] [Google Scholar]
- 37.Hughes MN, Nicklin HG. J Chem Soc (A) 1968:450. [Google Scholar]
- 38.Logager T, Sehested K. J Phy Chem. 1993;97:6664. [Google Scholar]
- 39.Radi R, Beckman JS, Bush KM, Freeman BA. J Biol Chem. 1991;266:4244. [PubMed] [Google Scholar]
- 40.Goldstein S, Czapski G. Inorg Chem. 1995;34:4041. [Google Scholar]
- 41.Masumoto H, Kissner R, Koppenol WH, Sies H. FEBS Lett. 1996;398:179. doi: 10.1016/s0014-5793(96)01237-9. [DOI] [PubMed] [Google Scholar]
- 42.Lee J, Hunt JA, Groves JT. J Am Chem Soc. 1998;120:7493. [Google Scholar]
- 43.Lee JB, Hunt JA, Groves JT. Am Chem Soc. 1998;120:6053. [Google Scholar]
- 44.Bourassa JL, Ives EP, Marqueling AL, Shimanovich R, Groves JT. J Am Chem Soc. 2001;123:5142. doi: 10.1021/ja015621m. [DOI] [PubMed] [Google Scholar]
- 45.Goldstein S, Czapski G. J Am Chem Soc. 1999;121:2444. [Google Scholar]
- 46.Koppenol WH. Free Radical Biology and Medicine. 1998;25(4/5):385–91. doi: 10.1016/s0891-5849(98)00093-8. [DOI] [PubMed] [Google Scholar]
- 47.Koppenol WH, Moreno JJ, Pryor WA, Ischiropoulos H, Beckman JS. Chem Res Toxicol. 1992;5:834–42. doi: 10.1021/tx00030a017. [DOI] [PubMed] [Google Scholar]
- 48.Stern MK, Jensen MP, Kramer K. J Am Chem Soc. 1996;118:8735–6. [Google Scholar]
- 49.Pinkernell U, Ke H, Karst U. Analyst. 1997;122:567. [Google Scholar]
- 50.Moorcroft MJ, Davis J, Compton RG. Talanta. 2001;54:785–803. doi: 10.1016/s0039-9140(01)00323-x. [DOI] [PubMed] [Google Scholar]


