

Abstract
Zebrafish is an emerging model system for cardiac conduction and regeneration. Zebrafish heart regenerates after 20% ventricular resection within 60 days. Whether cardiac conduction phenotype correlated with cardiomyocyte regeneration remained undefined. Longitudinal monitoring of the adult zebrafish heart (n = 12) was performed in terms of atrial contraction (PR intervals), ventricular depolarization (QRS complex) and repolarization (heart rated corrected QTc interval). Baseline electrocardiogram (ECG) signals were recorded one day prior to resection and twice per week over 59 days. Immunostaining for gap junctions with anti-Connexin-43 antibody was compared between the sham (n = 5) and ventricular resection at 60 days post-resection (dpr) (n = 7). Heart rate variability, QTc prolongation and J-point depression developed in the resected group but not in the sham. Despite a trend toward heart rate variability in response to ventricular resection, the differences between the resected and sham fish were, by and large, statistically insignificant. At 10 dpr, J-point depression was statistically significant (sham: −0.179 ± 0.061 mV vs. ventricular resection: −0.353 ± 0.105 mV, p<0.01, n = 7). At 60 days, histology revealed either cardiomyocyte regeneration (n = 4) or scar tissues (n = 3). J-point depression was no longer statistically significant at 59 dpr (sham: −0.114 ± 0.085 mV; scar tissue: −0.268 ± 0.178 mV, p>0.05, n = 3; regeneration: −0.209 ± 0.119 mV, p>0.05, n = 4). Despite positive Connexin-43 staining in the regeneration group, QTc intervals remained prolonged (sham: 325 ± 42 ms, n = 5; scar tissues: 534 ± 51 ms, p<0.01, n = 3; regeneration: 496 ± 31 ms, p<0.01, n = 4). Thus, we observed delayed electric repolarization in either the regenerated hearts or scar tissues. Moreover, early regenerated cardiomyocytes lacked the conduction phenotypes of the sham fish.
Keywords: Microelectrodes, Zebrafish heart regeneration, QTc intervals, Connexin-43
INTRODUCTION
Aberrant electrical activity of the heart, otherwise known as cardiac arrhythmia, is a leading cause of sudden cardiac death. Approximately 450,000 individuals develop acute loss of consciousness and sudden cardiac death in the United States.26 Zebrafish (Danio rerio) represents an emerging vertebrate model for cardiovascular research and regenerative medicine, in part, due to the relatively ease of maintenance and breeding and, in part, due to its significant promise for high throughput drug-screening.5 Recent data supports stem cell based cardiac regeneration in the mammalian systems,2 and zebrafish myocardium has been shown to regenerate after 20% ventricular resection within 60 days.17 Whether structurally regenerated zebrafish hearts displayed functionally normal conduction phenotype remained undefined.
Despite a two-chambered heart and a lack of pulmonary vasculature,16 the zebrafish heart electrocardiogram (ECG) is fundamentally similar to that of humans in terms of P waves, QRS complexes, and T waves.13,22 The critical conduction pathways of the zebrafish in cardiovascular development also parallel that of higher vertebrates.23 The zebrafish heart is encased by a pericardial sac in the thoracic cavity below the pectoral bone, and the atrium is medially dorsal and posterior to the ventricle. The bulbous arteriosus (BA) is analogous to the human aortic arch with thick contractile smooth muscle. Deoxygenated blood returns to the sinus venosus (SA), a structure analogous to the vena cava in humans. Thus, zebrafish is a viable model for developmental biology, cardiac arrhythmia, and drug discovery.1
Unlike mammals, zebrafish myocardium fully regenerates over a period of 60 days, as evidenced by histology.17,19 In response to resection, thrombosis immediately develops to achieve hemostasis in the ventricle. The thrombus is replaced by a fibrin clot at 2–4 days post resection (dpr). Nascent cardiomyocytes replace the vast majority of the lost ventricular tissue by 30 dpr and the structure of the ventricle is fully restored at 60 dpr.17 Zebrafish heart regeneration has been characterized using molecular, genetic, genomic and immunohistochemical approaches11; however, the cardiac conduction phenotype in the early-staged cardiomyocytes had remained unknown.
Zebrafish cardiac propagation in the regenerated cardiac tissue is a complex process governed by the excitable properties of the tissue and its macroscopic and microscopic architecture. Encouraging results from our laboratory24 and others15 showed the feasibility of monitoring zebrafish heart regeneration by the use of microelectrodes. In this context, we assessed the histology–conduction relationship in response to ventricular resection. Zebrafish were periodically sedated for ECG monitoring. Signal processing and wavelet transform were applied to enhance signal-to-noise ratios.24 Dynamic ECG changes developed post-ventricular resection, including J-point depression and QTc prolongation. Despite histological evidence of cardiomyocyte regeneration and a gradual normalization of J-point depression at 60 days post-resection, QTc intervals remained prolonged. Our findings suggest that early regenerated cardiomyocytes lacked the conduction phenotypes of the sham fish. Our in vivo regeneration model provides a non-invasive approach to assess cardiac conduction with relevance to future assessment of genetically,1 epigenetically,5 or pharmacologically 13 induced cardiac phenotypes.
EXPERIMENTAL DESIGNS AND METHODS
Animals
The animal experiments were performed in compliance with the protocol approved by the Institutional Animal Care and Use Committee (IACUC) at the University of Southern California. Adult zebrafish, 3–5 cm in length, were acquired from Tong’s Tropical Fish and Supplies (CA) and maintained under standard laboratory conditions at 24 °C. The individual fish were fed daily with brime shrimp (hatched from eggs in 10 mL in 2 L salt water), kept in constantly circulating water, and isolated from other fish for ECG follow-up post-resection.
Heart Resection or Injury
Eighteen fish were divided into two arms: 6 sham operation and 12 apical ventricular resection. Twelve zebrafish underwent apical ventricular resection according to the previously described method.24 Zebrafish were sedated in 5% Tricaine methanesulfonate (Tricaine). A midline incision of 0.25 cm in length was created posterior to the ventricle and approximately 20% of the apical ventricle was excised by scissors. The control fish underwent sham operation; that is, ventral midline incision was performed without ventricular resection. The zebrafish were returned to freshwater in the presence of a continuous oxygenator. Five resected fish and one sham fish died. Results from the 5 sham operated fish and 7 surviving fish (#1, #2, #3, #6, #7, #11, #12) with ventricular resection were analyzed for serial ECG recordings, histology, and immunostaining for gap junction protein Connexin-43.
ECG Recordings and Signal Processing
Baseline ECG signals were recorded one day prior to ventricular resection and repeated ECGs were performed twice every week for 59 days following resection. In parallel, ECG signals were recorded from 5 control sham fish (midline incision without heart resection) over the identical period.
The ECG measurements were performed using a modified technique.24 The entire recording processes were performed in a Faraday cage to shield interference from electromagnetic radiation. Two 29-gauge stainless steel micro-electrodes (AD Instrument, Colorado Springs, CO) were positioned at 90° to the animal’s ventral epidermis. The recording electrode was positioned directly above the ventricle and the reference electrode was positioned along the midline immediately in front of the anal fin. Both electrodes were inserted into the skin to approximately 1 mm in depth. The fish was allowed to recover from sedation within 5 min in an oxygenated water bath free of Tricaine.
Longitudinal ECG signals prior to and 59 days post-resection (dpr) were recorded from 12 zebrafish. The ECG signals were amplified 10,000-fold (A-M Systems Inc. 1700 Differential Amplifier, Carlsborg, WA) and filtered at a cut-off frequency of 60 Hz (notch) and between 0.1 and 500 Hz. The signals were acquired and digitized at a sampling rate of 1000 Hz (National Instruments USB-6251 DAQ device, Austin, TX, and LabVIEW 8.2). To enhance signal-to-noise ratios (SNR), we digitally processed the signals using the wavelet transform and thresholding Matlab algorithm (Matlab: Mathworks Inc, Natick, MA) developed in our laboratory.24 The parameters used in the algorithm allowed for systematic recordings for QRS and QTc intervals regardless of electrode placements or the cardiac vector orientations.13 J-point depression (J) was computed as the difference between J-point and baseline (signal level prior to P wave) normalized to the QRS voltage signals. J values for the sham and regenerated ventricles with and without residual resection/scar tissue were compared. QTc intervals were computed by normalizing to the heart rates using the standard Bazett formula.24
Histology
At 60 days, the zebrafish hearts were isolated and fixed with paraffin for 5 μm slides. The slides were stained with Acid fuchsin orange G (AFOG) and mouse polyclonal Connexin-43 (CX43) antibody (1:4000) (Sigma-Aldrich, MO, USA). Fibrin and collagen were stained orange/red and blue, respectively (Fig. 1) using the AFOG staining. Using the Connexin-43 antibody staining, Connexin-43 positive tissue was stained light brown and negative tissue was stained light blue. The atria were used as the positive control and the bulbus arteriosus as the negative. Photos were acquired by the microscope (Leica DM LB2, Leica Microsystems, Germany) coupled with a CCD digital camera (Spot RT-KE, Diagnostic Instruments, MI, USA).
FIGURE 1.
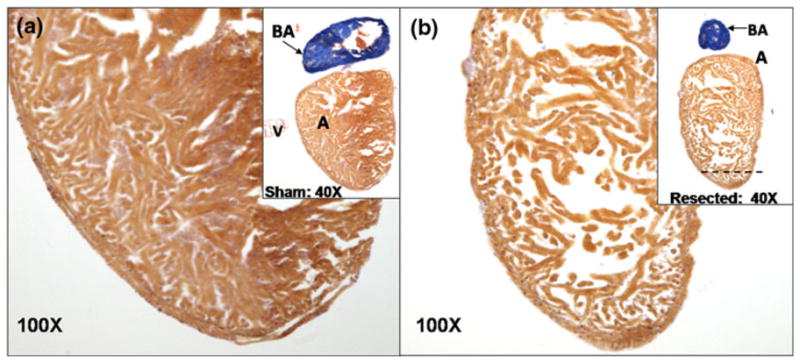
Histological study of sham vs. ventricular resection at 60 dpr. (a) Acid fuchsin orange G (AFOG) staining of heart from the sham. Inset shows the ventricle at 100×. (b) AFOG staining of the regenerated ventricle. Dotted line indicates the region of ventricular resection. Inset highlights regenerated ventricle at 100×. The ventricle revealed cardiomyocyte regeneration as reported by Poss et al.2 Although endo-, mid- and epicardial layers seemed indistinct, trabeculation was notable in zebrafish heart.23 The variations in cardiomyocyte “density” or otherwise known as wall thickness were mainly due the different cardiac contractile stage between systole and diastole at which the heart was arrested and fixed for histology preparation. A, atrium; V, ventricle; BA, bulbus arteriosus.
The specificity of the mouse Connexin-43 primary antibody was verified by using the same antibody for western blotting on ventricle myocardium tissue collected from intact fish. Isolated tissue were lysed in proper volume of RIPA buffer (50 mM Tris–HCl, pH 8.0, 150 mM NaCl, 1% Triton X-100, 0.5% sodium deoxycholate supplemented with protease inhibitor (PI) cocktail) and phosphotase inhibitor cocktail at 4 °C for 30 min. After centrifugation for 5 min at 4 °C, supernatant was collected as whole cell lysates. Protein concentration was determined with DCP protein assay kit from Bio-Rad Inc. (USA). Samples with equal protein amount of lysates were run on a 4–20% gradient SDS-PAGE gel. The proteins were then transferred to PVDF membrane and blotted with primary and secondary antibodies. Signal was developed with Supersignal Western Pico (Pierce) and recorded with FluorChem FC2 (Alpha Innotech Inc., CA, USA). Densitometry scan of Western blot were with the software come with FluorChem FC2 machine.
Statistical Analysis
Numerical data will be expressed as mean ± standard deviation. Statistical analysis was performed for comparisons between sham and resected fish as well as among separate experiments. For comparisons between two groups, two-sample independent-groups t-tests were used. Comparisons of multiple mean values are made by one-way analysis of variance (ANOVA), and statistical significance among multiple groups is determined using the Tukey procedure (for pairwise comparisons of means between sham and ventricular resection). p values of less than 0.05 are considered statistically significant.
RESULTS
Adult Zebrafish Heart Histology
The histological evidence of cardiac regeneration provided a basis to evaluate the status of the heart regeneration at 60 days. While the Acid fuchsin orange G staining showed regenerated fibrin tissue (orange) within ventricles (Fig. 1), immunohistochemistry revealed the regenerated cardiomyocytes and fibroblasts (Fig. 2). In light of the paucity of available zebrafish antibodies and their lack of specificity, we verified the polyclonal rabbit CX43 antibody by performing western blotting on zebrafish ventricular myocardium (Fig. 2a). The protein band corresponded to the 40 kD reference band confirming the molecular weight of CX43. However, the presence of three other bands suggested non-specific bindings. Nonetheless, the brown staining represented presence of cardiomyocytes in the ventricles at 60 dpr (Figs. 2b and 2c) compared to the blue negative staining for bulbus arteriosus and nucleated erythrocytes. Moreover, cardiomyocytes displayed the characteristic muscle striations in reddish-brown.
FIGURE 2.

Immunohistochemistry for cardiomyocyte gap junction protein, Connexin-43. (a) Western blots indicated a band corresponding to the molecular weight of Connexin-43. However, the antibody for zebrafish Connext-43 is not specific as notable for other bands. (b) Atrium and ventricle were surrounded by light brown staining whereas bulbus arteriosus was in light blue staining. Magnification (400×) revealed light born staining in the individual cardiomyocytes and striation was prevalent. Zebrafish erythrocytes are nucleated and stained in dark blue. (c) Immunohistochemistry on incompletely regenerated heart on 60 dpr. Low magnification (40×) presented bulbus arteriosus (BA) as well as pericardial tissue in blue, atrium and ventricle in brown; magnification (400×) revealed ventricular cavity and incomplete ventricle boundary in details. CX43 negative scar tissue with minimal brown staining with prominent nuclei was present near the injured site.
Histological evaluation revealed that three fish developed incomplete heart regeneration (#2, #6 and #12). Compared to the sham-operated fish with intact cardiac boundary (Fig. 2b), the fish heart associated with incomplete regeneration exhibited ill-defined boarder or injured sites associated with a negative CX43-staining (Fig. 2c). In contrast, four fish developed complete regeneration (#1, #3, #7, #11) associated with a positive CX43-staining resembling to that of the sham fish (Figs. 1b, 5d and 5e). There was no histological difference in CX43-staining density between the regenerated and sham myocardium.
FIGURE 5.

Representative ECG recording of fish with incomplete regeneration or residual resection. (a) ECG prior to resection showed distinct P waves, QRS complexes, and T waves. (b) ECG at 31 dpr revealed QTc, prolongation, J point and ST depression. (c) ECG at 59 dpr demonstrated persistent QTc prolongation, J point and ST depression, as well as prominent T waves. (d) Immunohistochemistry revealed scar tissues at ill-defined boarder at 40×. (e) At 100× CX43 negative scar tissue with minimal brown staining with prominent nuclei was present near the injured site. Red arrows point to the blue staining suggesting scar tissues in the resected region.
ECG Recordings and Signal Processing
The initial ECG signals were recorded at 1000 Hz (Fig. 3a). Wavelet transform was performed by breaking down the signals into 10 frequency segments ranging from 0 Hz to the Nyquist frequency (1/2 of sampling frequency, i.e. 500 Hz) (Fig. 3b).24 The individual frequency ranges contained different levels of signal components amidst the noise, which was suppressed by the set threshold value (Fig. 3b). Generally the signals from frequency range 0.98 Hz to 7.8 Hz were kept entirely to preserve T wave.24 The final processed ECG signals were re-constructed by inverse wavelet transform after noise reduction (Fig. 3c). The major features of the ECG were retained while signal-to-noise ratios were significantly improved.
FIGURE 3.

Example of signal processing for fish #11 ECG recorded at 3 dpa. (a) Raw signal directly recorded from sedated zebrafish using Labview at sampling rate of 1000 Hz. (b) Breakdown of raw signals into frequency segments via wavelet transform. Low frequency signals (DC to 0.49 Hz) were completely filtered. Thresholds were applied to each of the individual frequency ranges to suppress corresponding noise levels. Sub-threshold values were set to zero. Signals within frequency range from 0.98 to 7.81 Hz were reserved to ensure fidelity of T-waves. (c) Reconstructed ECG signals from processed frequency segments were shown after applying inverse wavelet transform.
ECG of the Sham Fish
In the sham fish that underwent ventral midline incision without ventricular resection, specific ECG features and intervals remained statically unchanged over the period 59 days post-resection (dpr). Distinct P waves, followed by QRS complexes, were noted. T waves were visible but not prominent at day 0 (Fig. 4). The QTc intervals were similar to the baseline (p>0.05, n = 5), suggesting preserved ventricular depolarization and repolarization. The corresponding immunohistochemistry at 60 dpr revealed intact heart associated with brown staining for CX43 in both atrium and ventricle, light blue for bulbus arteriosus (as a negative control), and dark blue for nucleated erythrocytes (Figs. 4d and 4e).
FIGURE 4.

Representative ECG recording from sham operation fish. (a) ECG recording at 0 dpr revealed P waves and QRS complexes. T waves were visible but not prominent. (b) ECG recording at 31 dpr revealed that P waves, QRS intervals, and T waves were statistically similar to the baseline ECG recording. (c) ECG recordings at 59 dpr revealed that P wave, QRS complexes and QTc intervals remained statistically unchanged. (d) Immunohistochemistry for cardiomyocyte gap junction protein, Connexin-43, at 60 dpr disclosed light brown staining in both atrium and ventricle at 40×. Bulbus arteriosus was in light blue staining. (e) The ventricle remained intact post the sham operation at 100×. The nucleated erythrocytes were stained dark blue.
ECG of Fish with Scar Tissues
Representative ECG recording (fish #12) revealed scar tissues at 59 dpr. P waves and QRS complexes remained unchanged compared to ECG recordings prior to resection (Figs. 5a vs. 5c), suggesting preserved atrial and ventricular depolarization. Dynamic changes in ECG depolarization and repolarization patterns, particularly, J-point depression and QTc prolongation developed post-ventricular resection (Fig. 5b). QTc intervals remained prolonged at 59 dpr (Fig. 5c). J-point depression accompanied with ST-T changes remained statistically significant compared to the sham at 52 dpr (p<0.01, n = 3). However, J-point depression was no longer statistically significant at 59 dpr (p>0.05, n = 3). Overall ECG patterns displayed similar features commonly observed in human ECG in response to myocardial ischemia, particularly the changes in T wave and ST segments. 25 The corresponding immunohistochemistry showed scar tissues at the apex (Fig. 5d). Dark blue staining over the epicardium and around the scar tissues indicated absence of CX43 staining (Figs. 2c and 5e). Thus, our findings suggest that ventricular resection and incomplete regeneration engendered delayed J-point normalization and prolonged QTc intervals.
ECG of Fish Undergoing Ventricular Regeneration
Representative ECG recordings (fish #7) revealed dynamic changes despite histological finding for complete ventricular regeneration at 60 dpr. ECGs prior to resection showed distinct P waves, followed by QRS complexes, and non-prominent T waves (Fig. 6a). At 31 dpr, T waves became prominent, accompanied with prolonged QTc intervals; and J points were depressed, accompanied with notable ST-T changes (Fig. 6b). At 59 dpr, QTc intervals remained prolonged (p<0.01, n = 4) while J-point depression appeared to normalize to the baseline (p>0.05, n = 4) (Fig. 6c). Immunohistochemistry at 59 dpr revealed brown staining for CX43 in the ventricles, and the regenerated cardiomyocytes were indistinguishable from the surrounding tissue (Figs. 6d and 6e). Hence, our findings suggest that ECG repolarization remained prolonged in the early-staged cardiomyocytes.
FIGURE 6.

Representative ECG recording from fish with ventricular regeneration. (a) ECG before ventricular resection displayed distinct P waves, followed by QRS complexes. T waves were not distinguishable. (b) ECG at 31 dpr showed that P waves and QRS complexes remained unchanged, suggesting intact atrial and ventricular depolarization. However, prominent T waves developed and QTc intervals became prolonged. ST segment depression was evidenced by the J-point depression. (c) ECG at 59 dpr showed that QTc intervals remained prolonged, and that ST segment appeared to normalize to baseline. Tall P wave amplitudes were likely due to electrode placement proximal to the source of sinus node pacemaker cells. Note that variations in voltage amplitude at various days post-resection were likely due to lead placements. (d) Immunohistochemistry at 60 dpr revealed light brown staining for Connexin-43 in both atrium and ventricle in contrast to light blue staining for bulbus arteriosus at 40×. (e) Complete cardiomyocyte regeneration was noted despite persistent prolonged QTc intervals at 100×.
Cardiac Resection and Heart Rate Variability
The recorded fish heart rates ranged from 500 to 1500 ms over the period of 60 days. The heart rates could be influenced by the level of sedation.7 To account for individual variability in response to tricaine, we normalized the standard deviation of RR intervals by the mean RR intervals for all of the recorded ECGs. The calculated values, Var (0< Var<1), indicated the degree of variability for a particular ECG recording. Higher Var values associated with a greater variability. The Var values for the individual ECG recording intervals for sham (n = 5) and resected fish (n = 7) were grouped together and were presented as mean ± standard deviation vs. days post-resection (Fig. 7). During the first 17 days, the heart rate variability of sham and resected fish were similar. After 20 dpr, the resected fish group showed higher variability compared to the control. However, the variability was statistically significant at merely 3 time points; specifically, 27, 52, and 55 dpr. Given other confounding variables such as hypoxia and sedation, ventricular resection alone may not be an independent predictor for heart rate variability.
FIGURE 7.

Effect of resection on the variability of RR intervals. Variability, Var, was calculated as the standard deviation of RR interval divided by the mean RR interval. Higher Var value indicates greater variability. Mean and standard deviation of Var values for sham-operated and resected fish were presented against the numbers of day post-resection (dpr). RR variability of sham (n = 5) and resected fish (n = 7) were similar from day 0 to 17 dpr. After 20 dpr, the resected group showed greater Var value. Only 3 time points (27, 52 and 55 dpr) revealed a statistically significant difference.
Dynamic Changes in J-Point Depression
Next, we assessed changes in J-point depression between the sham and ventricle resection. Mean J points for the sham (n = 5), regenerated ventricles (n = 4), and scar tissues (n = 3) were compared (Fig. 8). At 10 dpr, J-point depression became statistically significant for both the regeneration group (p<0.01, n = 4) and scar tissue group (p<0.01, n = 3). At 52 dpr, J-point depression remained for the scar tissue group. At 59 dpr, J-point became statistically insignificant for both the regeneration and scar tissue group.
FIGURE 8.

Dynamic changes in J-point depression values between sham and resected ventricles. J-point depression (J) was calculated as the difference between J-point and baseline (signal level prior to P wave) and normalized with voltage amplitude of QPS complex. Periodic J values for the sham operation (Control), resected ventricles with regeneration, resected ventricles with scar tissues (Scarred) were plotted over 59 days. “*” indicates statistical significant difference between the sham and regeneration (No Scar) (p<0.01); “#” indicates statistical significant difference between the sham and scar tissues (p <0.01).
Dynamic Changes in QTc Intervals
Periodic mean QTc intervals were compared over 59 days (Table 1). Starting at 3 dpr, the QTc intervals were significantly different between the sham and fish undergoing ventricular resection (p<0.01, n = 7). The QTc intervals were not significantly different between fish undergoing regeneration and those with scar tissues (p>0.05, n = 4 and 3, respectively). However, distinct QTc prolongation was observed for fish undergoing ventricular resection compared to the sham (Fig. 9). While the QTc intervals of sham (blue diamond) remained statistically unchanged, ranging from 275 to 350 ms, the mean QTc intervals remained prolonged for both the regeneration (fish #1, 3, 7, and 11) and scar tissue groups (fish #2, 6, and 12) at 59 dpr (p<0.01, n = 7). Taken together, fish that underwent ventricular resection developed prolonged QTc intervals despite positive cardiomyocyte staining for Connexin-43 after 59 dpr (Fig. 3); those that developed scar tissues developed a more accentuated J-point depression between 10 and 45 dpr (Fig. 8).
TABLE 1.
Periodic QTc assessment.
| dpr (days) | 0 | 3 | 10 | 17 | 24 | 31 | 38 | 45 | 52 | 59 |
|---|---|---|---|---|---|---|---|---|---|---|
| QTc control (ms) | 347 ± 41 | 320 ± 32 | 337 ± 47 | 289 ± 32 | 326 ± 43 | 325 ± 60 | 299 ± 14 | 348 ± 64 | 311 ± 24 | 325 ± 42 |
| QTc no scar (ms) | 306 ± 17 | 495 ± 57 | 541 ± 18 | 521 ± 54 | 554 ± 11 | 535 ± 27 | 545 ± 15 | 528 ± 53 | 530 ± 48 | 496 ± 31 |
| QTc scarred (ms) | 322 ± 18 | 450 ± 65 | 472 ± 67 | 577 ± 37 | 499 ± 45 | 502 ± 10 | 531 ± 18 | 527 ± 41 | 543 ± 55 | 534 ± 51 |
| p value for one-way ANOVA test | 0.158 | 0.001 | 0.000 | 0.000 | 0.000 | 0.000 | 0.000 | 0.000 | 0.000 | 0.000 |
| p value for t-test (control vs. scarred) | 0.655 | 0.034 | 0.070 | 0.000 | 0.007 | 0.000 | 0.000 | 0.002 | 0.013 | 0.015 |
| p value for t-test (control vs. no scar) | 0.200 | 0.007 | 0.000 | 0.000 | 0.000 | 0.000 | 0.000 | 0.002 | 0.001 | 0.000 |
| p value for t-test (no scar vs. scarred) | 0.431 | 0.429 | 0.211 | 0.160 | 0.163 | 0.081 | 0.344 | 0.992 | 0.752 | 0.339 |
Periodic mean QTc intervals of fish undergoing ventricular resection were compared with the sham over 59 days. The differences in QTc intervals between the sham and resected ventricles were statistically significant starting at 3 dpr (p<0.05, n = 4 and 3, respectively). However, the QTc values between regeneration and scar tissues were statistically insignificant (p>0.05, n = 4 and 3, respectively).
FIGURE 9.

QTc values between sham and resected ventricles. Statistically significant differences developed at 3 dpr (p <0.01, n = 7). While the QTc of sham (blue diamond) remained statistically unchanged ranging from 275 to 350 ms, the mean QTc values for the resected ventricles showed QTc prolongation ranging from 375 ms to 400–600 ms starting at 3 dpr despite cardiomyocyte regeneration at 59 dpr (p<0.01, n = 7).
DISCUSSION
Zebrafish cardiac conduction in the regenerated cardiac tissue involves the excitable properties of the tissue and its macroscopic and microscopic structure. In this study, we established an in vivo model for the study of conduction phenotypes in the regenerating zebrafish heart. By using the microelectrodes, long-term assessment of PR, QRS, and QTc intervals revealed dynamic changes in response to ventricular resection. Histological analysis also revealed presence of gap junctions such as CX43 in the regenerated cardiomyocytes. Despite a gradual normalization of J-point depression, ECG repolarization was not normalized to baseline as compared to the sham. Moreover, early regenerated cardiomyocytes lacked the conduction phenotypes of the sham fish. Our findings pave the way for a non-invasive platform to assess cardiac regeneration and conduction phenotypes for small animal research with relevance to understand cardiac arrhythmias.
Using zebrafish as a vertebrate model system holds promise for understanding cardiomyocyte conduction. Diverging from the mammalian ancestry 450 million years ago, zebrafish possess the essential common anatomy of humans.16 Understanding heart regeneration in a vertebrate model system is highly relevant to public health concern. Myocardial infarction results in irreversible loss of cardiomyocytes in the heart.20 Injured human hearts heal by scarring, which leads to remodeling and heart failure.6 In contrast to mammals, zebrafish myocardium fully regenerates after 20% ventricular resection, 17,19 thereby providing a genetically tractable model to investigate molecular mechanisms of cardiac myocyte regeneration.
Our longitudinal study demonstrated that zebrafish displayed two gross histological findings ensuing ventricular resection: (1) cardiomyocyte regeneration (fish #1, #3, #7 and #11) and (2) regeneration with scar tissue (fish #2, #6 and #12). All of the fish that underwent ventricular resection developed QTc prolongation and prominent T waves, accompanied with J-point depression. Furthermore, J-point depression was more accentuated in fish displaying scar tissues from between 10 and 45 dpr.
Long QT phenomenon has an important clinical implication for sudden cardiac death.18 The long QT syndromes (LQTS) are due to delayed repolarization of cardiac myocyte action potential, thereby predisposing individuals for torsade de pointes, a lethal form of ventricular tachycardia, leading to fainting and death.3 The common in-born etiology of LQTS is associated with a host of mutations in the rectifier potassium channels. The common exogenous etiology is linked with drug toxicities (class III potassium channel blockers or psychoactive drugs).8 Prolonged QTc reflects delayed repolarization of action potential. Dysfunctional inward rectifier potassium channels such as IKr may be implicated.21 Myocardial ischemia and stem cell therapy also constitute the substrates for LQTS.12 J-point depression is implicated in myocardial ischemia. A decrease in coronary blood perfusion predisposes an individual to develop myocardial injury, leading to heart attack otherwise known as coronary syndromes. Hence, prolong QTc intervals and J-point depressions represent myocardial phenotypes of tissue injury in response to ventricular resection.
The dynamic changes in zebrafish ECG recordings provided a non-invasive means to assess conduction otherwise hampered by the lack of a suitable human model for heart regeneration. While normal function of ion channels, receptors, and cytoskeletal proteins contributed to repolarization of the cardiac myocytes, prolonged QTc intervals suggest an alteration in repolarization. Milan et al. reported that agents known to induce QT prolongation in humans also led to QT prolongation in zebrafish.13 The authors identified 15 repolarization genes implicating in a network of transmembrane and cytoplasmic proteins that modulate ion channel function, underscoring zebrafish as a faithful model for human cardiac repolarization.14 Using the zebrafish model for long QT syndromes in humans, Arnaout et al. demonstrated that mutation in the kcnh2 gene, which encodes the channel responsible for the rapidly activating delayed rectifier current (IKr), accounts for 45% of long QT syndrome1 and results in the inability of zebrafish to generate action potentials and calcium release. While kcnh2 mutation was lethal in homozygous embryonic zebrafish, heterozygous kcnh2 mutation manifested delayed ventricular repolarization and prolonged QTc intervals in anesthetized, paralyzed adult zebrafish.1
In the era of stem cell and regenerative medicine, there is a considerable interest to assess the phenotypes of early regenerated cardiomyocytes. Albeit the advances of molecular imaging and ultrasound modalities to follow stem cell fate, gene therapy and cardiac function,4 the emerging concern in cardiac stem cell therapy and tissue engineering is cardiac toxicities that can manifest clinically as atrial or ventricular arrhythmia. Hence, assessing zebrafish QT intervals in response to ventricular injuries provides a novel approach to address cardiac arrhythmia or long QT syndromes in the early regenerated tissues.1,18
Analogous to human myocardial injury, in our study, QT prolongation in zebrafish was induced by surgically resecting ~20% of the ventricular myocardium. We observed that prolonged QT intervals persisted despite histological evidence of complete ventricular regeneration. Antibody staining for Connexin-43 was positive in the regenerated cardiomyocytes; however, early-staged cardiomyocytes might not have fully expressed potassium channels necessary for excitation and contraction coupling. Thus, the resected fish could be at risk for cardiac arrhythmia in response to pharmacological perturbation.
Overall, our in vivo model provided a basis for the assessment of cardiac conduction phenotypes in relation heart regeneration, allowing for a non-invasive and longitudinal approach to assess gene regulation and ultra-structural functional properties of regenerated cardiomyocytes.10 Recently, the use of microelectrode array (MEA) mapping technique opened new avenue to assess the functional syncytium9 and to perform high throughput phenotyping of genetic deletion or over-expression, as well as lethal mutations otherwise infeasible in transgenic animals. Zebrafish regeneration model provides limitless opportunities to assess conduction phenotypes with relevance to genetic, epigenetic, and pharmacologic perturbation.
Acknowledgments
The authors would like to express gratitude to Professor Calum MacRae from Massachusetts General Hospital, Harvard Medical School, for his advice on zebrafish ECG. The authors would also like to express gratitude for Alfred Mann Biomedical Engineering Institute for providing a low noise level space for ECG recording. This project was supported by NHLB 083015 (TKH) and NHLBI 068689 (TKH).
References
- 1.Arnaout R, Ferrer T, Huisken J, Spitzer K, Stainier DY, Tristani-Firouzi M, Chi NC. Zebrafish model for human long QT syndrome. Proc Natl Acad Sci USA. 2007;104(27):11316–11321. doi: 10.1073/pnas.0702724104. [DOI] [PMC free article] [PubMed] [Google Scholar]
- 2.Bergmann O, Bhardwaj RD, Bernard S, Zdunek S, Barnabe-Heider F, Walsh S, Zupicich J, Alkass K, Buchholz BA, Druid H, Jovinge S, Frisen J. Evidence for cardiomyocyte renewal in humans. Science. 2009;324(5923):98–102. doi: 10.1126/science.1164680. [DOI] [PMC free article] [PubMed] [Google Scholar]
- 3.Braunwald E, Zipes DP, Libby P. Heart Disease: A Textbook of Cardiovascular Medicine. Philadelphia, PA: W.B. Saunders Company; 2001. [Google Scholar]
- 4.Chang GY, Cao F, Krishnan M, Huang M, Li Z, Xie X, Sheikh AY, Hoyt G, Robbins RC, Hsiai T. Positron emission tomography imaging of conditional gene activation in the heart. J Mol Cell Cardiol. 2007;43(1):18–26. doi: 10.1016/j.yjmcc.2007.03.809. [DOI] [PMC free article] [PubMed] [Google Scholar]
- 5.Chi NC, Shaw RM, Jungblut B, Huisken J, Ferrer T, Arnaout R, Scott I, Beis D, Xiao T, Baier H, Jan LY, Tristani-Firouzi M, Stainier DYR. Genetic and physiologic dissection of the vertebrate cardiac conduction system. PLoS Biol. 2008;6(5):1006–1019. doi: 10.1371/journal.pbio.0060109. [DOI] [PMC free article] [PubMed] [Google Scholar]
- 6.Hahn C, Schwartz MA. The role of cellular adaptation to mechanical forces in atherosclerosis. Arterioscler Thromb Vasc Biol. 2008;28(12):2101–2107. doi: 10.1161/ATVBAHA.108.165951. [DOI] [PMC free article] [PubMed] [Google Scholar]
- 7.Hsieh DJY, Liao CF. Zebrafish M2 muscarinic acetylcholine receptor: cloning, pharmacological characterization, expression patterns and roles in embryonic bradycardia. Br J Pharmacol. 2002;137(6):782. doi: 10.1038/sj.bjp.0704930. [DOI] [PMC free article] [PubMed] [Google Scholar]
- 8.Keating MT. The long QT syndrome: a review of recent molecular genetic and physiologic discoveries. Medicine. 1996;75(1):1. doi: 10.1097/00005792-199601000-00001. [DOI] [PubMed] [Google Scholar]
- 9.Kehat I, Gepstein A, Spira A, Itskovitz-Eldor J, Gepstein L. High-resolution electrophysiological assessment of human embryonic stem cell-derived cardiomyocytes. A novel in vitro model for the study of conduction. Circ Res. 2002;91(8):659–663. doi: 10.1161/01.res.0000039084.30342.9b. [DOI] [PubMed] [Google Scholar]
- 10.Kehat I, Kenyagin-Karsenti D, Snir M, Segev H, Amit M, Gepstein A, Livne E, Binah O, Itskovitz-Eldor J, Gepstein L. Human embryonic stem cells can differentiate into myocytes with structural and functional properties of cardiomyocytes. J Clin Invest. 2001;108(3):407–414. doi: 10.1172/JCI12131. [DOI] [PMC free article] [PubMed] [Google Scholar]
- 11.Lien CL, Schebesta M, Makino S, Weber GJ, Keating MT. Gene expression analysis of zebrafish heart regeneration. PLoS Biol. 2006;4(8):e260. doi: 10.1371/journal.pbio.0040260. [DOI] [PMC free article] [PubMed] [Google Scholar]
- 12.Makkar RR, Chen PS. Stem cell therapy for myocardial repair. J Am Coll Cardiol. 2003;42(12):2070–2072. doi: 10.1016/j.jacc.2003.09.018. [DOI] [PubMed] [Google Scholar]
- 13.Milan DJ, Jones IL, Ellinor PT, MacRae CA. In vivo recording of adult zebrafish electrocardiogram and assessment of drug-induced QT prolongation. Am J Physiol Heart Circ Physiol. 2006;291:H269–H273. doi: 10.1152/ajpheart.00960.2005. [DOI] [PubMed] [Google Scholar]
- 14.Milan DJ, Kim AM, Winterfield JR, Jones IL, Pfeufer A, Sanna S, Arking DE, Amsterdam AH, Sabeh KM, Mably JD, Rosenbaum DS, Peterson RT, Chakravarti A, Kääb S, Roden DM, MacRae CA. Drug-sensitized zebrafish screen identifies multiple genes, including GINS3, as regulators of myocardial repolarization. Circulation. 2009;120(7):553–559. doi: 10.1161/CIRCULATIONAHA.108.821082. [DOI] [PMC free article] [PubMed] [Google Scholar]
- 15.Milan DJ, MacRae CA. Animal models for arrhythmias. Cardiovasc Res. 2005;67(3):426–437. doi: 10.1016/j.cardiores.2005.06.012. [DOI] [PubMed] [Google Scholar]
- 16.Nusslein-Volhard C, Dahm R, editors. Zebrafish. New York: Oxford University Press; 2002. [Google Scholar]
- 17.Poss KD, Wilson LG, Keating MT. Heart regeneration in zebrafish. Science. 2002;298(5601):2188–2190. doi: 10.1126/science.1077857. [DOI] [PubMed] [Google Scholar]
- 18.Priori SG, Schwartz PJ, Napolitano C, Bloise R, Ronchetti E, Grillo M, Vicentini A, Spazzolini C, Nastoli J, Bottelli G. Risk stratification in the long-QT syndrome. N Engl J Med. 2003;348(19):1866. doi: 10.1056/NEJMoa022147. [DOI] [PubMed] [Google Scholar]
- 19.Raya A, Consiglio A, Kawakami Y, Rodriguez-Esteban C, Izpisua-Belmonte JC. The zebrafish as a model of heart regeneration. Cloning Stem Cells. 2004;6(4):345–351. doi: 10.1089/clo.2004.6.345. [DOI] [PubMed] [Google Scholar]
- 20.Reeve JL, Duffy AM, O’Brien T, Samali A. Don’t lose heart—therapeutic value of apoptosis prevention in the treatment of cardiovascular disease. J Cell Mol Med. 2005;9(3):609–622. doi: 10.1111/j.1582-4934.2005.tb00492.x. [DOI] [PMC free article] [PubMed] [Google Scholar]
- 21.Rosen MR, Janse MJ, Wit AL. Cardiac Electrophysiology: A Textbook. Austin, TX: Futura Publishing Company; 1990. [Google Scholar]
- 22.Sedmera D, Reckova M, de Almeida A, Sedmerova M, Biermann M, Volejnik J, Sarre A, Raddatz E, McCarthy RA, Gourdie RG, Thompson RP. Functional and morphological evidence for a ventricular conduction system in zebrafish and Xenopus hearts. Am J Physiol Heart Circ Physiol. 2003;284(4):H1152–H1160. doi: 10.1152/ajpheart.00870.2002. [DOI] [PubMed] [Google Scholar]
- 23.Stainier DY. Zebrafish genetics and vertebrate heart formation. Nat Rev Genet. 2001;2(1):39–48. doi: 10.1038/35047564. [DOI] [PubMed] [Google Scholar]
- 24.Sun P, Zhang Y, Yu F, Parks E, Lyman A, Wu Q, Ai L, Hu CH, Zhou Q, Shung K, Lien CL, Hsiai TK. Micro-electrocardiograms to study post-ventricular amputation of zebrafish heart. Ann Biomed Eng. 2009;37(5):890–901. doi: 10.1007/s10439-009-9668-3. [DOI] [PMC free article] [PubMed] [Google Scholar]
- 25.Surawicz B, Knilans TK, Chou TC. Chou’s Electrocardiography in Clinical Practice: Adult and Pediatric. Philadelphia, PA: W.B. Saunders Company; 2001. [Google Scholar]
- 26.Zheng ZJ, Croft JB, Giles WH, Mensah GA. Sudden cardiac death in the United States, 1989 to 1998. Circulation. 2001;104(18):2158. doi: 10.1161/hc4301.098254. [DOI] [PubMed] [Google Scholar]