

Abstract
Purpose
Diffuse large B-cell lymphoma (DLBCL) heterogeneity has prompted investigations for new biomarkers that can accurately predict survival. A previously reported 6-gene model combined with the international prognostic index (IPI) could predict patients’ outcome. However, even these predictors are not capable of unambiguously identifying outcome, suggesting that additional biomarkers might improve their predictive power.
Experimental Design
We studied expression of 11 microRNAs that had previously been reported to have variable expression in DLBCL tumors. We measured the expression of each microRNA by quantitative real-time polymerase-chain-reaction analyses in 176 samples from uniformly treated DLBCL patients and correlated the results to survival.
Results
In a univariate analysis, the expression of miR-18a correlated with overall survival (OS), whereas the expression of miR-181a and miR-222 correlated with progression-free survival (PFS). A multivariate Cox regression analysis including the IPI, the 6-gene model-derived Mortality Predictor Score and expression the of miR-18a, miR-181a, and miR-222, revealed that all variables were independent predictors of survival except the expression of miR-222 for OS and the expression of miR-18a for PFS.
Conclusion
The expression of specific miRNAs may be useful for DLBCL survival prediction and their role in the pathogenesis of this disease should be examined further.
Keywords: MicroRNA, DLBCL, prognosis, pathogenesis, 6-gene model
Introduction
Diffuse large B-cell lymphoma (DLBCL), the most common subtype of non-Hodgkin lymphoma, exhibits an aggressive and variable clinical course. (1) An anthracyclin-based immunochemotherapy regimen, (rituximab, cyclophosphamide, adriamycin, vincristine, and prednisone or R-CHOP) is considered the current standard of therapy and leads to a complete remission in approximately 75%, and a long-term failure-free survival rate of 50% in DLBCL patients. (2) The International Prognostic Index (IPI), which incorporates five clinical parameters, is considered the gold standard for predicting prognosis in DLBCL patients; however, the variable outcomes of patients within specific IPI subgroups argues that clinical features alone cannot precisely predict response to therapy or clinical outcome. Similarly, routine histologic and immunophenotypic evaluation of diagnostic biopsies are insufficient to accurately predict clinical outcome in DLBCL patients.(3, 4)
Gene expression profiling studies demonstrated the presence of DLBCL subtypes associated with distinct cells of origin and clinical outcomes.(5, 6) These pivotal studies suggested the existence of potential prognostic biomarkers, unique pathogenetic pathways and different mechanisms of therapy resistance among the subtypes. To improve the accuracy of existing clinical prognostic methods, we previously established an IPI independent 6-gene model that was capable of predicting progression free (PFS) and overall survival (OS) in DLBCL patients.(7, 8) This model was robust to predict outcome regardless of the type of tissue or platform used for analysis or the treatment regimen given to patients. Although this model was validated in 7 independent cohorts of patients (Supplemental Table 1), and incorporated into an ongoing multicenter prospective study, its inability to capture all of the variability in patients’ survival in the multiple cohorts studied suggested that additional biological variables that are responsible for this residual clinical heterogeneity have yet to be discovered.
MicroRNAs (miRNA) have been reported to predict outcome in several malignancies, including chronic lymphocytic leukemia (CLL),(9) acute myeloid leukemia (AML)(10, 11), and solid tumors.(12) Since miRNAs may be less susceptible to degradation than mRNAs,(13) due to their shorter length, their expression is likely to be more robust for determination of cellular origin of multiple cancers.(14) Initial reports proposed that specific miRNAs may be associated with outcome in DLBCL patients.(15–17) However, these DLBCL studies were performed on very small cohorts of patients and need validation in independent and larger cohorts of patients.
We recently demonstrated the stage-specific expression pattern of multiple miRNAs at distinct differentiation stages of peripheral B-lymphocytes, and identified a 9-miRNA signature that could separate germinal center B-cell (GCB) from activated B-cell (ABC)-derived DLBCL cell lines.(18) This 9-miRNA signature was derived from enriched tumor cells and may not be applicable to whole tumors that also contain non-malignant cellular components that contribute to measured expression of miRNAs.
Therefore, in the current study, we set out to identify specific miRNAs whose expression in whole DLBCL tumors (without enrichment for malignant B cells) correlates with survival of DLBCL patients treated with R-CHOP. We also examined the relationship of these miRNAs to the 6-gene model and the IPI.
Materials and Methods
Patients
A total of 176 diagnostic specimens from DLBCL patients treated with curative intent using R-CHOP chemotherapy at University of Miami (n=25), Stanford University (n=49), Hospital Santa Creu i Sant Pau-Barcelona (n=22), and British Columbia Cancer Agency (n=80), were used for analysis of expression of miRNAs and the genes comprising the 6-gene model (LMO2, BCL6, FN1, CCND2, SCYA3, and BCL2). The specimens were selected based on the following criteria: (1) diagnosis of de novo DLBCL in HIV-negative patients; (2) availability of tissue obtained at diagnosis before initiation of therapy; and (3) availability of follow-up and outcome data at the treating institution. Criteria commonly used for prospective studies such as normal renal and liver functions, absence of co-morbid conditions, and good performance status were not applied for case selection. Patients with primary mediastinal large B-cell lymphoma, or involvement of central nervous system at presentation were not included. None of the patients in the current study were included in our prior study that led to the derivation of the 6-gene model (7), but some were included in the previous study analyzing application of the 6-gene model in formalin-fixed paraffin-embedded (FFPE) specimens.(8)
Institutional review board approval was obtained from all participating institutions for inclusion of anonymized data in this study in accordance with the declaration of Helsinki. The following information at the time of diagnosis was collected: age, sex, performance status, stage, number of extranodal sites involved, serum lactate dehydrogenase (LDH) level, presence or absence of systemic (“B”) symptoms, and IPI score. Staging was done in all patients according to the Ann Arbor system (19) based on physical examination, bone marrow biopsy, and computed tomography of the chest, abdomen, and pelvis. OS and PFS were determined from the follow-up information retrieved from the patients’ medical records. Histological sections were reviewed to confirm the diagnoses of DLBCL according to the 2008 World Health Organization classification of hematopoietic tumors.(20) The cellular context of the analyzed specimens consisted of at least 70% of large CD20+ lymphoma cells (range 70–95%), as determined by hematoxylin and eosin staining and immunohitochemistry.
RNA isolation and real-time PCR
Total RNA was extracted from two 5-μm-thick slices of FFPE sections as previously reported.(21) RNA was successfully extracted from all 176 specimens. For measurement of expression of genes comprising the 6-gene model, RNA (2 μg) was reverse transcribed using the High-Capacity cDNA Reverse Transcription Kit (Applied Biosystems, Foster City, CA) according to the manufacturer’s protocol with a minor modification: addition of RNase inhibitor (Applied Biosystems) at a final concentration of 1 U/μL. The complete reaction mixes were incubated at 25°C for 10 minutes and 37°C for 120 minutes. For miRNA analysis 5 μL of RNA at 2 ng/μL was mixed with 10 μL of TaqMan MicroRNA Reverse Transcription Kit reagent containing specific miRNA primers and reverse-transcribed according to manufacturer’s instructions (Applied Biosystems). Complete reaction mixes were incubated at 16°C for 30 minutes, 42°C for 30 minutes, and 85°C for 5 minutes.
Real-time PCR was performed using the ABI PRISM 7900HT Sequence Detection System Instrument and software (Applied Biosystems), as previously reported.(7, 21, 22) The following commercially available Assays-on-Demand were used for measurement of gene expression [BCL6 (Hs00277037_m1), FN1 (Hs00365058_m1), CCND2 (Hs00277041_m1), BCL2 (Hs00153350_m1), LMO2 (Hs00277106_m1), SCYA3 (Hs00234142_m1)] and expression of miRNAs selected for analysis [miR-146a (MIMAT0000449), miR-146b-5p (MIMAT0002809), miR-222 (MIMAT0000279), miR-500 (MIMAT0004773), miR-574-3p (MIMAT0003239), miR-363 (MIMAT0000707), miR-155 (MIMAT0000646), miR-21 (MIMAT0000076), miR-18a (MIMAT0000072), miR-140-3p (MIMAT0004597), and miR-181a (MIMAT0000256)]. Expression of miRNAs was normalized to the expression of endogenous RNU6B, while gene expression was normalized to phosphoglycerate kinase 1 (PGK1) (Human TaqMan Pre-Developed Assay Reagent; Applied Biosystems) that served as internal controls of RNA amount and integrity, as previously reported.(7, 22) Each measurement was performed in triplicate. Threshold cycle (Ct), the fractional cycle number at which the amount of amplified target reached a fixed threshold, was determined, as previously reported (7, 22). For calibration we used Raji cDNA and/or cDNA prepared from Universal Human Reference RNA (Stratagene, La Jolla, CA), obtaining ΔΔCT values for each gene and miRNA in each sample, as previously reported.(21)
Identification of Forkhead Box Protein P1 (FOXP1) as mir-181a target
Three prediction algorithms, PicTar (23) (http://pictar.mdc-berlin.de/, New York University and Max Delbruck Centrum), miRanda (24) (http://cbio.mskcc.org/mirnaviewer/, Memorial Sloan-Kettering Cancer Center), and TargetScan (25) (http://www.targetscan.org/, Whitehead Institute for Biomedical Research), were used to find possible targets of hsa-miR-181a with potential role in DLBCL pathogenesis or prognosis. In addition, the PITA algorithm(26) (http://genie.weizmann.ac.il/pubs/mir07/mir07_prediction.html, Segal Lab of Computational Biology) was used to confirm the accessibility of the putative miRNA binding sites.
FOXP1 expressing DLBCL cell lines (HBL1 and VAL) were cultured in RPMI (Cellgro, Herndon, VA) with 10% fetal bovine serum (Hyclone, Logan, UT) and 1% penicillin/streptomycin/L-glutamine (Cellgro). HBL1 and VAL DLBCL cells (2.5×10⁶ cells) were transfected with 2μg of hsa-miR-181a precursor or precursor miR-negative control #1 (Ambion, Austin, TX) using program X-001 and solution V of Nucleofector II (Amaxa Biosystems) following the manufacturer’s instructions. Cells were collected at 24 and 48 hours after transfection. Total RNA from these cell lines was extracted using the mirNeasy miRNA Isolation Kit (Qiagen Sciences, Maryland) and used for analysis of FOXP1 mRNAs and miR-181a expression by Real-time PCR as described above. Western blotting for FOXP1 and GAPDH was performed using anti-FOXP1 (p-20, Santa Cruz Biotechnology) and anti-GAPDH (Santa Cruz Biotechnology) antibodies.
The 3′-UTR region of FOXP1 gene was amplified from Raji cell line genomic DNA using the Phusion™ High-Fidelity PCR Master Mix (Finnzymes Oy, Espoo, Finland) according to the manufacturer’s instructions. Primers used for amplification are shown in Supplemental Table 2. PCR products were digested with XbaI (New England Biolabs, Beverly, MA) and ligated into the pGL3 Control vector (Promega, Madison, WI, Madison, WI), linearized with XbaI, and dephosphorylated with Shrimp Alkaline Phosphatase (USB, Cleveland, OH). Ligation products were grown in Top10 F′ E. coli (Invitrogen Gibco BRL, Grand Island, NY) and individual clones were picked up. The sequence of the clones was confirmed using the Taq DyeDideoxy terminator method with the 3130xl Genetic Analyzer DNA Sequencer (Applied Biosystems). Mutagenesis of the 3′-UTR luciferase constructs was performed using the QuickChange XL Site-Directed Mutagenesis Kit (Stratagene, La Jolla, CA).
For luciferase reporter experiments, HeLa cells, cultured in Dulbecco modified Eagle medium with high glucose (Invitrogen) and 10% fetal bovine serum (Hyclone, Logan, UT) and 1% penicillin/streptomycin/L-glutamine (Cellgro) were transfected in triplicate with each 3′-UTR luciferase construct using SiPort NeoFX (Ambion, Austin, TX) according to the manufacturer’s instructions. Briefly, 45,000 cells per well were seeded over 50 μl of transfection mix, in a final volume of 0.5 ml. The transfection mix was prepared using 1 μl of SiPort, 0.4 μg of Luciferase pGL3 control derived construct, 80 ng of pRL-TK (Promega, Madison, WI) and 5 pmol of precursor miR-181a or precursor miR-negative control #1 (Ambion,) per well. Cells were lysed 16–24 hours after transfection and Dual Luciferase Assay (Promega) was performed on a Sirius luminometer (Berthold, Aliquippa, PA). Measured luciferase expression values were normalized to non-targeting pre-miR negative control #1, which measurement was given the value of 100%. Data are presented as average ± standard error of the mean. Each experiment was performed in triplicates and repeated at least 3 times.
Similar experiments were performed to examine the effect of miR-181a on expression of O6-methylguanine-DNA methyltransferase (MGMT) endogenously expressed in VAL and Jurkat cell lines.
Statistical analysis
The normalized gene-expression values were log-transformed (on a base of 2) and the 6-gene Mortality Predictor Score was calculated based on the following equation: Mortality Predictor Score = (−0.0273 × LMO2) + (−0.2103 × BCL6) + (−0.1878 × FN1) + (0.0346 × CCND2) + (0.1888 × SCYA3) +(0.5527 × BCL2).(7) miRNA expression and the 6-gene score were used as a continuous variable or categorically ranked the patients, allowing their division into 2 groups: low- and high molecular-risk groups characterized by 6-gene Mortality Prediction Score below or above the median, respectively, or low-and high- expression groups based on miRNA expression below or above the corresponding median.
Expression of miRNA and Mortality Predictor Score were correlated to PFS and OS. OS was defined as the time interval from the date of diagnosis to the date of death or last follow-up. PFS was defined as the time interval between the date of initial diagnosis and the date of disease progression or death from any cause, whichever came first, or date of last follow-up evaluation. Survival curves were estimated using the product-limit method of Kaplan-Meier and were compared using the log-rank test. Univariate and multivariate analyzes were performed. Multivariate regression analysis according to the Cox proportional hazards regression model,(27) with OS or PFS as the dependent variables, was used to adjust for the effects of the miRNA expression, Mortality Predictor Score and IPI. p value of less than .05 was considered significant.
To merge the predictive power of the IPI, the 6-gene model-derived Mortality Predictor Score and miRNAs, we constructed a combined model integrating these prognostic variables. The weights for each variable were obtained from their independent contributions, as inferred from a Cox proportional hazards fit to the data, and this same model was used to estimate the 5-year survival. The survival curves were generated using the coxph function in the R software package (http://www.r-project.org/). This function estimates the baseline using the Breslow method. In addition, the resulting confidence intervals for survival at each time were smoothed using cubic splines.
Results
Selection of a Panel of miRNAs for Quantitative RT-PCR
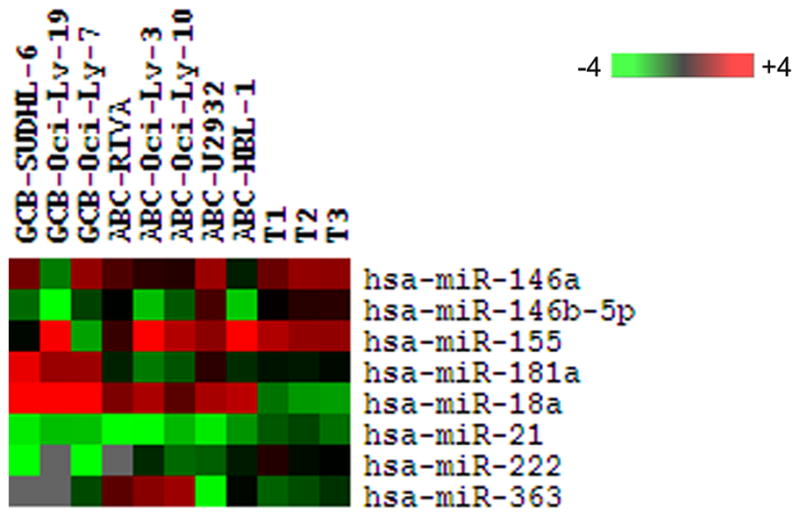
We selected a group of 11 miRNAs for this study. We previously reported that eight of these miRNAs (miR-21, miR-146a, miR-146b-5p, miR-155, miR-222, miR363, miR-500, miR-574-3p) were capable of distinguishing GCB and ABC-like DLBCL cell lines.(18) Three additional miRNAs (miR-18a, miR-140-3p, and miR-181a) were selected since their expression has been suggested to be highly variable in DLBCL patients in previous reports (at least 4 fold difference across all the analyzed unselected cases).(16, 18, 28–31)
Expression of miRNAs and survival of DLBCL patients
We measured the expression of each of the 11 miRNAs and the internal control (RNU6B) for input mRNA, by quantitative RT-PCR in 176 specimens of DLBCL patients treated with R-CHOP. The expression of the genes LMO2, BCL6, FN1, CCND2, SCYA3, and BCL2 comprising the 6-gene model was also measured and the Mortality Predictor Score was calculated as previously reported.(7) Patients’ median age was 59 years (range, 16–92) and their disease characteristics, including the 5 clinical parameters that comprise the IPI, are shown in Table 1. The follow-up period ranged from 15 days to 8.1 years (overall median 2.6 years; 25th and 75th quantiles of 1.4 and 4.1 years, respectively); 41 patients (23%) died while 54 had documented disease progression or relapse. The median follow-up of patients who were alive was 2.84 years, while the median follow-up for patients who died was 0.86 years. Figure 1A demonstrates the OS and PFS curves of all the 176 patients. Both the IPI, segregating the patients into low clinical risk (IPI 0–2) and high clinical risk (IPI 3–5) groups, and the 6-gene model-derived Mortality Predictor Score segregating the patients into low molecular risk (lower than the median) and the high molecular risk (higher than the median) groups, predicted OS and PFS (Figure 1B and C). The Mortality Predictor Score also predicted OS and PFS as a continuous variable (not shown). In a multivariate Cox regression analysis that included the IPI scores and the Mortality Predictor Score with OS and PFS as the dependent variables, both remained independent predictors of OS (p<0.001 and p= 0.038, respectively) and PFS (p<0.001 and p=0.022, respectively).
TABLE 1.
Summary of clinical characteristics of 176 DLBCL patients
| Parameter | Number (%) |
|---|---|
| Age (range - years) | (16–92) |
|
| |
| Median | 59.5 |
| </= 60 | 92 (52%) |
| > 60 | 84 (48%) |
|
| |
|
Stage
| |
| Stage I | 36 (20%) |
| Stage II | 54 (31%) |
| Stage III | 33 (19%) |
| Stage IV | 53 (30%) |
|
| |
|
Performance Status
| |
| 0 | 52 (29.5%) |
| 1 | 70 (40%) |
| 2 | 29 (16.5%) |
| 3 | 22 (12%) |
| 4 | 3 (2%) |
|
| |
|
LDH
| |
| Normal | 100 (57%) |
| High | 76 (43%) |
|
| |
|
Extranodal sites
| |
| 0–1 | 168 (95%) |
| >1 | 8 (5%) |
|
| |
|
IPI
| |
| 0 | 35 (20%) |
| 1 | 42 (24%) |
| 2 | 50 (28%) |
| 3 | 30 (17%) |
| 4 | 17 (10%) |
| 5 | 2 (1%) |
Figure 1. IPI and 6-gene survival scores are predictive of OS and PFS in the analyzed cohort of 176 DLBCL patients treated with R-CHOP.

(A) Overall survival and progression-free survival curves for the entire cohort of DLBCL patients treated with R-CHOP. OS information was available for 176 patients and PFS for 169 patients, (B) Kaplan-Meier curves for OS and PFS in low clinical-risk (IPI 0–2; 127 and 125 patients, respectively) and high-clinical risk (IPI 3–5; 49 and 44 patients, respectively) groups; (C) Kaplan-Meier curves for OS and PFS in low molecular-risk (Mortality Predictor Score bellow median; 88 and 85 patients, respectively) and high molecular-risk (Mortality Predictor Score above median; 88 and 84 patients, respectively) classified based on the 6-gene model.
Expression of three (miR-18a, miR-181a, miR-222) of the 11 analyzed miRNAs was individually associated with survival of DLBCL patients in a univariate analysis. Expression of miR-18a analyzed as a continuous variable was statistically correlated with OS (p=0.038), and increased expression of this miRNA was associated with a shorter OS (Figure 2A). Expression of miR-18a was not associated with PFS. Expression of miR-181a, analyzed as a continuous variable, was statistically correlated with PFS (p=0.026) but not with OS, and increased expression of this miRNA was associated with longer PFS (Figure 2B). Expression of miR-222, analyzed as a dichotomous variable (above and below median expression), was statistically correlated with PFS (p=0.004), but not with OS. Higher expression of miR-222 was associated with shorter PFS (Figure 2C).
Figure 2. Expression of miRNAs is predictive of OS and PFS of DLBCL patients.

(A) Expression of miR-18a is predictive of OS of DLBCL patients. For demonstration purposes, the 176 DLBCL patients treated with R-CHOP were subdivided into tertiles based on the expression of miR-18a. Expression of miR-18a predicted OS as a continuous variable (p=0.038); (B) Expression of miR-181a is predictive of PFS of DLBCL patients (p=0.026). For demonstration purposes, the 169 DLBCL patients treated with R-CHOP were subdivided into tertiles based on the expression of miR-181a. Expression of miR-181a predicted PFS as a continuous variable (p=0.026); (C) Expression of miR-222, analyzed as a categorical variable, is predictive of PFS of DLBCL patients (p=0.004). Kaplan-Meier curves for PFS in DLBCL patients with low (below media) and high (above median) expression of miR-222.
We next examined whether the prognostic significance of these three microRNAs was independent of the IPI score and the Mortality Predictor Score derived from the 6-gene model. A multivariate Cox regression analysis that included the IPI score, the Mortality Predictor Score and the expression of miR-18a and miR-181a as continuous variables, and miR-222 as a dichotomous variable, with OS or PFS as the dependent variables was performed. The IPI, the Mortality Predictor Score (either as a categorical or continuous variable), and the expression of miR-18a and miR-181a were independent predictors of OS (Table 2). In the PFS analysis, the IPI, the Mortality Predictor Score (either as a categorical or continuous variable), and expression of miR-181a and miR-222 were independent predictors of PFS (Table 2). Since two of the three miRNAs predict outcome as continuous variables, we elected to present their independence from the IPI and the Mortality Predictor Score in Table 2 and not to display this data graphically in each relatively small IPI cohort, as the latter would require a selection of cut off values that may be considered a pre-optimization step that would impose unnecessary bias into the data. No significant correlations between the expression of miR-18a, miR-181a, and miR-222 and age, stage, performance status, LDH and extranodal involvement were observed (data not shown).
TABLE 2.
Multivariate Cox regression analyses for OS and PFS including IPI score, Mortality Predictor Scores and expression of miR-18a and miR-181a (continuous variables) and miR-222 (dichotomous variable)
| OS | PFS | |||||
|---|---|---|---|---|---|---|
| Variable | Z score | Coefficient | P value | Z score | Coefficient | P value |
| IPI score | 4.12 | 1.396 | <0.005 | 3.52 | 1.048 | <0.005 |
| 6-gene | 2.11 | 0.2 | 0.035 | 1.95 | 0.255 | 0.05 |
| miR-18a | 2.53 | 0.752 | 0.011 | 0.81 | 0.255 | NS |
| miR-181a | −2.88 | −3.603 | 0.004 | −2.79 | −3.207 | 0.005 |
| miR-222 | 1.06 | 0.363 | NS | 2.65 | 0.817 | 0.008 |
Given that the IPI, the Mortality Prediction Score and the expression of the 3 miRNAs independently correlated with survival, we constructed a combined model integrating all the indices based on their independent contributions as inferred from the multivariate Cox regression. This approach may allow prediction of the 5 year OS and PFS as shown in Figure 3.
Figure 3. Probability of 5-year OS (A) and PFS (B) based on combined IPI, 6-gene Mortality Prediction Score and miRNA expression score.

Curved lines represent 95% CIs.
miR-181a regulates the expression of FOXP1 and MGMT
Given that the association between DLBCL outcome and miRNA expression most probably results from miRNA regulation of specific genes expression, and miR-181a is associated with outcome in other cancers(11), we explored novel miR-181a targets by searching for putative binding sites in the 3′-UTR of genes with a potential role in DLBCL pathogenesis or prognosis. Using 3 different prediction algorithms we found that putative binding sites for miR-181a are harbored in the 3′-UTR of FOXP1 and MGMT. FOXP1 encodes a transcription factor whose expression is associated with outcome in DLBCL patients is some of the previous reports.(32–35) To test whether this gene is regulated by miR-181a, we transfected the precursor of hsa-miR-181a into HBL1 and VAL DLBCL cell lines, which expresses endogenous FOXP1. Western blotting of whole-cell lysates showed a decrease of native FOXP1 in both HBL1 and VAL cells transfected with hsa-miR-181a (Figure 4A), compared with control miRNA transfectants. Examination of effects of hsa-miR-181a precursor on FOXP1 mRNA revealed a decrease in expression at 24 hours after transfection in the HBL1 cells, but an increase in the VAL cells with little effect at 48 hours after transfection (Figure 4B), which suggests that the regulation is mainly occurring at the level of protein translation. Transfection efficacy in each experiment was confirmed by measurements of appropriate miRNAs by TaqMan MicroRNA Assays (Figure 4C). To confirm direct effects, we fused the 3′-UTR sequence of FOXP1, containing 3 miR-181a putative binding sites, to a luciferase reporter gene. By cotransfecting the hsa-miR-181a precursor or a control precursor with the 3′-UTR FOXP1 luciferase reporter, we demonstrated that miR-181a significantly repressed luciferase activity, compared with a nontargeting control(Figure 4D). To demonstrate the specificity of the interaction, we generated a panel of four 3′-UTR FOXP1 luciferase reporter constructs containing individual mutations of each of the 3 putative binding sites (MUT1, MUT2 and MUT3) and a construct with combined mutations of sites 1 and 2 (MUT1+2) (Supplemental Table 2). The specific binding sites chosen for mutagenesis were selected based on analysis of accessibility of each putative miRNA binding site with the PITA algorithm. Mutagenesis of the seeds of sites 1 and 2, but not site 3 induced slight recovery of luciferase activities and the combined mutation of sites 1 and 2 (MUT1+2) produced complete restoration of luciferase activity (not statistically different from the nontargeting control). Taken together, these data support a direct effect of miR-181a on FOXP1 in DLBCL cell lines.
Figure 4. Effect of miR-181a on expression of FOXP1.

(A) Effect of the overexpression of hsa-miR-181a on native FOXP1 protein levels in HBL1 and VAL cell lines at 24 hours after transfection, assessed by Western blot. GAPDH levels were used as loading control. Data were confirmed in triplicate experiments; (B) Effect of the overexpression of hsa-miR-181a on the mRNA levels of FOXP1 measured by real-time PCR using TaqMan Gene Expression Assays (Applied Biosystems) at 24 and 48 hours after transfection. Values of triplicate wells are represented as fold expression with respect to the nontargeting control transfection; (C) Overexpression of hsa-miR-181a was confirmed by TaqMan MicroRNA Assays, expressed as fold increase regarding the control transfection; (D) Dual luciferase activity of reporter plasmids with the wild-type or mutated 3′-UTR of FOXP1 fused to the luciferase gene upon hsa-miR-181a precursor cotransfection in HeLa cells. ■ represents cotransfections with the corresponding miRNA precursor, and □, the cotransfection of the same reporter vector with the nontargeting control. Values are normalized to the value of each control, which is noted as 100%. Mutation of putative binding sites is expressed as MUT1 for the most 5′ site, MUT2 for the middle site and MUT3 for the most 3′ site, and MUT1 + 2 for the combined mutation of sites 1 and 2. Statistical comparisons by 2-tailed t test with Bonferroni correction between different constructs are represented as ↔. Statistical comparisons between the cotransfected miRNA and the nontargeting control for the same reporter vector are noted over the black bars. Significant differences with associated P values less than .05 are expressed as * and nonsignificant difference, as ns. Error bars correspond to standard error of the mean in all graphs.
MGMT encodes an enzyme that protects cells from the toxicity of alkylating agents that frequently target the O6 position of guanine and is one of the major mechanisms of resistance to alkylating drugs.(36, 37) To test whether this gene is also regulated by miR-181a, we transfected the precursor of hsa-miR-181a into VAL and Jurkat cell lines, which expresses endogenous MGMT. While miR-181a decreased protein levels of MGMT in both cell lines compared with control miRNA transfectants, the effect was indirect as demonstrated by absence of significant change in the 3′-UTR MGMT luciferase reporter assay (Supplemental Figure 1).
Discussion
The ability to accurately predict response to therapy and survival may be crucial for initial treatment planning in patients with non-Hodgkin lymphomas. Robust prognostic tools may allow stratification of treatment modalities avoiding exposure to unnecessary treatment toxicity or suboptimal therapy. Besides serving as a tool for risk stratification and enabling comparisons among clinical trials, prognostic markers also assist in further understanding tumor pathogenesis and may facilitate the development of specific therapeutic agents.
miRNAs have recently been demonstrated to play a key role in tumorigenesis and since their initial description, it has been demonstrated that their expression is closely associated with outcome in hematologic neoplasms such as CLL(9) and AML.(10) Here we demonstrate that the expression of miR-18a, miR-181a, and miR-222 is correlated with survival of DLBCL patients treated with the current gold-standard therapy – R-CHOP. Furthermore, we show for the first time that the expression levels of specific miRNAs in DLBCL tumors is associated with survival and is independent of the currently used clinical prognostic index IPI and the 6-gene model previously shown to be robust predictors of outcome in multiple cohorts of DLBCL patients.
Previous studies suggested association between expression of specific miRNAs and outcome of DLBCL patients.(15, 16) However these findings were based on analysis of small cohorts of DLBCL patients mostly treated in the pre-ritiximab era. In these studies, the expression cut offs for increased and decreased expression of the analyzed miRNAs were most likely preselected and optimized for the reported cohorts. Furthermore, many of the analyzed miRNAs demonstrated relatively limited variability across DLBCL tumors in our preliminary studies (not shown) suggesting that they would have limited ability to separate patients with different outcome and thus were not selected for the current analysis. Indeed, our data did not confirm the predictive power of miR-21 and miR-155 which expression was previously reported to predict outcome of DLBCL patients.(16, 17) This finding demonstrates the need for adequate cohort size necessary for sufficient statistical power to identify robust prognostic biomarkers, which must be validated in independent studies. Our findings on prognostic value of miR-18a, miR-181a, and miR-222 in DLBCL patients are based on a multi-institutional DLBCL cohort of sufficient size necessary for statistical power to identify robust prognostic biomarkers. However, these findings still need to be validated in large independent cohorts of DLBCL patients. While it is a common practice to validate prognostic factors based on gene expression data sets available in public domains, currently there are no publicly available miRNAs data sets in DLBCL patients with known outcome. Validation of this work will likely take much more time as patients are currently accrued into our multi-institutional prospective study (NCT00450385), in which we plan to validate the predictive power of these miRNAs before suggesting their application in clinical practice. Once data from these studies become available, recommendations regarding their application in clinical practice can be put forward. However, in the mean time, publishing of our data will offer the opportunity for other groups to repeat and/or validate and expand on our findings.
Currently, quantitative measurement of miRNA expression is most commonly accomplished by real-time PCR or microarrays. Since in the current study only 3 miRNAs were shown to be associated with DLBCL prognosis and because real time PCR allows more precise measurement of miRNA expression across a wider range and is more suitable for continuous variables, we envision that in the future real time PCR will be adopted as the preferred methodology for clinical application. Although recent studies suggested that in situ analysis of miRNa expression can be performed(38), this methodology may not be sufficiently quantitative for continuous variables and may not allow prediction of outcome using the combined model integrating IPI, 6-gene Mortality Prediction Score and the expression of the 3 miRNAs (Figure 3).
In contrast to genes, some of which are specifically and exclusively expressed in GC B-cells and tumors derived from them, the currently known miRNAs do not demonstrate exclusive expression patterns and are present in both malignant B-lymphocytes and non-malignant cells comprising the tumor microenvironment. For example, miR-21, miR-155, miR-222, miR146a and miR146b-5p are expressed at similar or higher levels in T cells in comparison to DLBCL cell lines (Supplemental Figure 2). Consequently, the GCB and ABC-like DLBCL subtypes defined by the previously reported miRNA expression signature (18) did not show differences in survival, since this cell of origin-based miRNA classification was derived from miRNA expression in tumor cells only, and excluded non-malignant cell types present in whole tumors that also contribute to the measured expression patterns of miRNAs. Future studies examining expression levels by in situ hybridization or in paired whole tumors and purified tumor B cells and non-tumor infiltrating cells will help establish the cellular source of specific miRNAs.
We demonstrated that increased expression of miR-18a was associated with inferior OS of DLBCL patients. miR-18a is a component of the miR-17–92 cluster, which is located at 13q31-q32 DNA region that is frequently amplified in human B-cell lymphomas.(29) The components of this cluster are expressed at higher levels in normal GC B-cells compared to naïve and memory B cells.(18) In addition, the region encoding this cluster is more commonly amplified in GCB-like than ABC-like DLBCL.(28) He et al initially suggested an association between increased expression of miRNAs comprising the miR-17–92 cluster and lymphoma.(29) Accordingly, enforced expression of the miR-17–92 cluster, together with c-MYC in mice, accelerated the development of B-cell lymphomas and leukemias.(29) Overexpression of the c-MYC mRNA, together with the miR-17-5p/miR-20a from this cluster, was associated with a more aggressive behavior in mantle cell lymphoma.(39) Our findings of decreased OS in DLBCL patients, whose tumors express increased levels of miR-18a, are in agreement with these data.
Increased expression of miR-181a was associated with improved PFS in DLBCL patients. In cytogenetically normal AML, higher miR-181a expression was associated with a higher complete remission rate, longer OS and longer disease-free survival.(11) In contrast in CLL, high levels of miR-181a were associated with a shorter time from diagnosis to initial therapy.(9) In this context, miR-181a may function as a tumor suppressor. miR-181 was implicated to have an antioncogenic role in CLL by downregulating TCL1, a known oncogene in T-CLL and B-CLL that is particularly overexpressed in the most aggressive subtypes of CLL.(40) It was also reported that miR-181a can repress the expression of BCL-2,(30) a known prognostic factor in DLBCL and a component of the 6-gene model. However in a multivariate analysis, both the miR-181a and the 6-gene model were independent predictors of outcome, suggesting that miR-181a regulates additional targets that influence patient outcome. Herein we have demonstrated that miR-181a directly downregulates expression of FOXP1.
FOXP1 is a member of the FOXP subfamily(FOXP1–4) of transcription factors, characterized by a common DNA-binding, winged-helix or forkhead domain, together with N-terminal zinc finger and leucine zipper domains. The FOXP1 gene was mapped to chromosome 3p14.1, a locus that shows frequent loss of heterozygosity in solid tumors(41); both FOXP1 mRNA and protein expression are commonly affected in a range of solid tumors.(42) FOXP1 was reported to be expressed in normal activated B cells, mantle zone B-cells and some GCB cells (42, 43), however, the physiologic role of FOXP1 in normal lymphocytes is unclear. FOXP1 is recurrently targeted by chromosome translocations involving immunoglobulin heavy chain locus in marginal zone lymphomas and DLBCL, suggesting a potential role for FOXP1 in lymphomagenesis.(44, 45) Previous studies demonstrated more common expression of FOXP1 in a subset of non-GCB-like compared to GCB-like DLBCLs.(32–35) Furthermore, some but not all previous studies demonstrated association between FOXP1 expression and poor prognosis and survival.(32, 33, 35) Downregulation of FOXP1 expression by miR-181a may at least partially explain the association between miR-181 and improved survival of DLBCL patients; however, like other miRNAs, miR-181a regulates multiple genes, some of which may also contribute to better prognosis associated with miR-181a expression. Evaluation of additional miR-181a targets with potential role in DLBCL pathogenesis is currently in progress in our laboratory
Increased expression of miR-222 was associated with shorter PFS, thus confirming our previous observation in an extended cohort of patients.(18) miR-222 is part of the miR-221/miR-222 cluster, which is highly expressed in ABC-like DLBCL cell lines(18) and ABC-like DLBCL tumors(16), but its specific role in DLBCL pathogenesis is unknown. miR-222 was reported to regulate the expression of the stem cell factor c-kit(46) and cyclin-dependent kinase inhibitors p27 and p57.(47, 48) The miR-222-induced downregulation of p27 and p57 may facilitate cell proliferation and survival(47, 48), particularly in pancreatic carcinomas(48) and melanomas(49) that were reported to express miR-222. Shorter PFS of DLBCL patients whose tumors express high levels of miR-222 may reflect the cellular origin of these tumors or specific biological effects of this miRNA. Further investigations are needed to address specific mechanisms associated with miR222 function.
The observation that miR-18a predicts OS while miR-181a and miR-222 are associated with PFS suggests different biological effects on DLBCL cells. Association between miR-18a and shorter OS suggests that this miRNA predicts poor response to either upfront and salvage therapies, most likely by affecting biological aggressiveness of DLBCL tumors. In contrast, exclusive association between expression of miR-181a and miR-222 with PFS but not OS implies an effect on response to upfront R-CHOP but not salvage therapies, which can rescue these patients leading to similar OS. Indeed, our findings suggest that miR-181a indirectly decreases expression of MGMT protein potentially contributing to better cyclophosphamide chemosensitivity and longer PFS. Further studies evaluating biological effects of these miRNAs are needed and are in progress.
The statistically significant association between the expression of specific miRNAs and either PFS or OS of DLBCL patients, suggests that further studies to elucidate their role in lymphomagenesis are required. The observation that some miRNAs predict outcome as dichotomous variables while others as continuous variables, may reflect the relatively small sample size or represent different biological effects of these miRNAs. The association of outcome with miRNA expression as a continuous variable suggests that even small changes in their expression may have profound effects on the expression of their targets, and implies a tightly regulated process. In contrast, dichotomous variables may imply an “all or nothing” modulation in which a certain threshold of miRNA expression must be reached for mRNA modulation. Since dichotomous division was based on median expression, it is possible that non-median classification could result in DLBCL subgroups with statistically significant outcome, but the latter approach would require independent confirmation in a separate cohort of patients, and thus was not done in the current study. Further studies are warranted to investigate these variations, to validate the prognostic impact of individual miRNAs in independent cohorts of DLBCL patients (as was done previously with the 6-gene model) and to elucidate their role in B-cell biology and lymphomagenesis.
Supplementary Material
Figure 5.

Figure 6.
Acknowledgments
Grant support: I.S.L. is supported by National Institutes of Health (NIH) grantsNIH CA109335 and NIH CA122105, and the Dwoskin Family, Bankhead-Coley, and Fidelity Foundations. The work of R.M. was supported bya fellowship from Fundación Caja Madrid. RDG is supported by a National Cancer Institute of Canada and Terry Fox Foundation grant (# 19001). YN is supported by NIH P01 CA34233.
References
- 1.Morton LM, Wang SS, Devesa SS, Hartge P, Weisenburger DD, Linet MS. Lymphoma incidence patterns by WHO subtype in the United States, 1992–2001. Blood. 2006;107:265–76. doi: 10.1182/blood-2005-06-2508. [DOI] [PMC free article] [PubMed] [Google Scholar]
- 2.Habermann TM, Weller EA, Morrison VA, et al. Rituximab-CHOP versus CHOP alone or with maintenance rituximab in older patients with diffuse large B-cell lymphoma. J Clin Oncol. 2006;24:3121–7. doi: 10.1200/JCO.2005.05.1003. [DOI] [PubMed] [Google Scholar]
- 3.Lossos IS, Morgensztern D. Prognostic biomarkers in diffuse large B-cell lymphoma. J Clin Oncol. 2006;24:995–1007. doi: 10.1200/JCO.2005.02.4786. [DOI] [PubMed] [Google Scholar]
- 4.Natkunam Y, Mason DY. Prognostic immunohistologic markers in human tumors: why are so few used in clinical practice? Lab Invest. 2006;86:742–7. doi: 10.1038/labinvest.3700447. [DOI] [PubMed] [Google Scholar]
- 5.Alizadeh AA, Eisen MB, Davis RE, et al. Distinct types of diffuse large B-cell lymphoma identified by gene expression profiling. Nature. 2000;403:503–11. doi: 10.1038/35000501. [DOI] [PubMed] [Google Scholar]
- 6.Rosenwald A, Wright G, Chan WC, et al. The use of molecular profiling to predict survival after chemotherapy for diffuse large-B-cell lymphoma. N Engl J Med. 2002;346:1937–47. doi: 10.1056/NEJMoa012914. [DOI] [PubMed] [Google Scholar]
- 7.Lossos IS, Czerwinski DK, Alizadeh AA, et al. Prediction of survival in diffuse large-B-cell lymphoma based on the expression of six genes. N Engl J Med. 2004;350:1828–37. doi: 10.1056/NEJMoa032520. [DOI] [PubMed] [Google Scholar]
- 8.Malumbres R, Chen J, Tibshirani R, et al. Paraffin-based 6-gene model predicts outcome in diffuse large B-cell lymphoma patients treated with R-CHOP. Blood. 2008;111:5509–14. doi: 10.1182/blood-2008-02-136374. [DOI] [PMC free article] [PubMed] [Google Scholar]
- 9.Calin GA, Ferracin M, Cimmino A, et al. A MicroRNA signature associated with prognosis and progression in chronic lymphocytic leukemia. N Engl J Med. 2005;353:1793–801. doi: 10.1056/NEJMoa050995. [DOI] [PubMed] [Google Scholar]
- 10.Marcucci G, Radmacher MD, Maharry K, et al. MicroRNA expression in cytogenetically normal acute myeloid leukemia. N Engl J Med. 2008;358:1919–28. doi: 10.1056/NEJMoa074256. [DOI] [PubMed] [Google Scholar]
- 11.Schwind S, Maharry K, Radmacher MD, et al. Prognostic significance of expression of a single microRNA, miR-181a, in cytogenetically normal acute myeloid leukemia: a Cancer and Leukemia Group B study. J Clin Oncol. 2010;28:5257–64. doi: 10.1200/JCO.2010.29.2953. [DOI] [PMC free article] [PubMed] [Google Scholar]
- 12.Yanaihara N, Caplen N, Bowman E, et al. Unique microRNA molecular profiles in lung cancer diagnosis and prognosis. Cancer Cell. 2006;9:189–98. doi: 10.1016/j.ccr.2006.01.025. [DOI] [PubMed] [Google Scholar]
- 13.Rosenfeld N, Aharonov R, Meiri E, et al. MicroRNAs accurately identify cancer tissue origin. Nat Biotechnol. 2008;26:462–9. doi: 10.1038/nbt1392. [DOI] [PubMed] [Google Scholar]
- 14.Lu J, Getz G, Miska E, et al. MicroRNA expression profiles classify human cancers. Nature. 2005;435:834–8. doi: 10.1038/nature03702. [DOI] [PubMed] [Google Scholar]
- 15.Roehle A, Hoefig K, Repsilber D, et al. MicroRNA signatures characterize diffuse large B-cell lymphomas and follicular lymphomas. Br J Haematol. 2008;142:732–44. doi: 10.1111/j.1365-2141.2008.07237.x. [DOI] [PubMed] [Google Scholar]
- 16.Lawrie C, Soneji S, Marafioti T, et al. MicroRNA expression distinguishes between germinal center B cell-like and activated B cell-like subtypes of diffuse large B cell lymphoma. Int J Cancer. 2007;121:1156–61. doi: 10.1002/ijc.22800. [DOI] [PubMed] [Google Scholar]
- 17.Jung I, Aguiar RC. MicroRNA-155 expression and outcome in diffuse large B-cell lymphoma. Br J Haematol. 2009;144:138–40. doi: 10.1111/j.1365-2141.2008.07424.x. [DOI] [PMC free article] [PubMed] [Google Scholar]
- 18.Malumbres R, Sarosiek KA, Cubedo E, et al. Differentiation stage-specific expression of microRNAs in B lymphocytes and diffuse large B-cell lymphomas. Blood. 2009;113:3754–64. doi: 10.1182/blood-2008-10-184077. [DOI] [PMC free article] [PubMed] [Google Scholar]
- 19.Carbone PP, Kaplan HS, Musshoff K, Smithers DW, Tubiana M. Report of the Committee on Hodgkin’s Disease Staging Classification. Cancer Res. 1971;31:1860–1. [PubMed] [Google Scholar]
- 20.Swerdlow SH, Campo E, Harris NL, et al. WHO Classification of Tumours of Haematopoietic and Lymphoid Tissues. 4. Geneva, Switzerland: World Health Organization; 2008. [Google Scholar]
- 21.Chen J, Byrne GE, Lossos IS. Optimization of RNA extraction from formalin-fixed, paraffin-embedded lymphoid tissues. Diagn Mol Pathol. 2007;16:61–72. doi: 10.1097/PDM.0b013e31802f0804. [DOI] [PubMed] [Google Scholar]
- 22.Lossos IS, Czerwinski DK, Wechser MA, Levy R. Optimization of quantitative real-time RT-PCR parameters for the study of lymphoid malignancies. Leukemia. 2003;17:789–95. doi: 10.1038/sj.leu.2402880. [DOI] [PubMed] [Google Scholar]
- 23.Krek A, Grun D, Poy MN, et al. Combinatorial microRNA target predictions. Nat Genet. 2005;37:495–500. doi: 10.1038/ng1536. [DOI] [PubMed] [Google Scholar]
- 24.John B, Enright AJ, Aravin A, Tuschl T, Sander C, Marks DS. Human MicroRNA targets. PLoS Biol. 2004;2:e363. doi: 10.1371/journal.pbio.0020363. [DOI] [PMC free article] [PubMed] [Google Scholar]
- 25.Grimson A, Farh KK, Johnston WK, Garrett-Engele P, Lim LP, Bartel DP. MicroRNA targeting specificity in mammals: determinants beyond seed pairing. Mol Cell. 2007;27:91–105. doi: 10.1016/j.molcel.2007.06.017. [DOI] [PMC free article] [PubMed] [Google Scholar]
- 26.Kertesz M, Iovino N, Unnerstall U, Gaul U, Segal E. The role of site accessibility in microRNA target recognition. Nat Genet. 2007;39:1278–84. doi: 10.1038/ng2135. [DOI] [PubMed] [Google Scholar]
- 27.Cox D. Regression models and life tables (with discussion) J R Stat Soc Ser B. 1972;34:187–220. [Google Scholar]
- 28.Lenz G, Wright GW, Emre NC, et al. Molecular subtypes of diffuse large B-cell lymphoma arise by distinct genetic pathways. Proc Natl Acad Sci U S A. 2008;105:13520–5. doi: 10.1073/pnas.0804295105. [DOI] [PMC free article] [PubMed] [Google Scholar]
- 29.He L, Thomson JM, Hemann M, et al. A microRNA polycistron as a potential human oncogene. Nature. 2005;435:828–33. doi: 10.1038/nature03552. [DOI] [PMC free article] [PubMed] [Google Scholar]
- 30.Neilson JR, Zheng GX, Burge CB, Sharp PA. Dynamic regulation of miRNA expression in ordered stages of cellular development. Genes & Development. 2007;21:578–89. doi: 10.1101/gad.1522907. [DOI] [PMC free article] [PubMed] [Google Scholar]
- 31.Alencar AJ, Malumbres R, Advani R, et al. MicroRNA Are Useful Biomarkers for Prediction of Response to Therapy and Survival of Patients with Diffuse Large B-Cell Lymphoma. Blood (ASH Annual Meeting Abstracts) 2009;114:624. [Google Scholar]
- 32.Banham AH, Connors JM, Brown PJ, et al. Expression of the FOXP1 transcription factor is strongly associated with inferior survival in patients with diffuse large B-cell lymphoma. Clin Cancer Res. 2005;11:1065–72. [PubMed] [Google Scholar]
- 33.Barrans SL, Fenton JA, Banham A, Owen RG, Jack AS. Strong expression of FOXP1 identifies a distinct subset of diffuse large B-cell lymphoma (DLBCL) patients with poor outcome. Blood. 2004;104:2933–5. doi: 10.1182/blood-2004-03-1209. [DOI] [PubMed] [Google Scholar]
- 34.Brown PJ, Ashe SL, Leich E, et al. Potentially oncogenic B-cell activation-induced smaller isoforms of FOXP1 are highly expressed in the activated B cell-like subtype of DLBCL. Blood. 2008;111:2816–24. doi: 10.1182/blood-2007-09-115113. [DOI] [PubMed] [Google Scholar]
- 35.Hans CP, Weisenburger DD, Greiner TC, et al. Confirmation of the molecular classification of diffuse large B-cell lymphoma by immunohistochemistry using a tissue microarray. Blood. 2004;103:275–82. doi: 10.1182/blood-2003-05-1545. [DOI] [PubMed] [Google Scholar]
- 36.Ludlum DB. DNA alkylation by the haloethylnitrosoureas: nature of modifications produced and their enzymatic repair or removal. Mutat Res. 1990;233:117–26. doi: 10.1016/0027-5107(90)90156-x. [DOI] [PubMed] [Google Scholar]
- 37.Pegg AE, Dolan ME, Moschel RC. Structure, function, and inhibition of O6-alkylguanine-DNA alkyltransferase. Prog Nucleic Acid Res Mol Biol. 1995;51:167–223. doi: 10.1016/s0079-6603(08)60879-x. [DOI] [PubMed] [Google Scholar]
- 38.Nuovo GJ, Elton TS, Nana-Sinkam P, Volinia S, Croce CM, Schmittgen TD. A methodology for the combined in situ analyses of the precursor and mature forms of microRNAs and correlation with their putative targets. Nat Protoc. 2009;4:107–15. doi: 10.1038/nprot.2008.215. [DOI] [PMC free article] [PubMed] [Google Scholar]
- 39.Navarro A, Bea S, Fernandez V, et al. MicroRNA expression, chromosomal alterations, and immunoglobulin variable heavy chain hypermutations in Mantle cell lymphomas. Cancer Res. 2009;69:7071–8. doi: 10.1158/0008-5472.CAN-09-1095. [DOI] [PubMed] [Google Scholar]
- 40.Pekarsky Y, Santanam U, Cimmino A, et al. Tcl1 expression in chronic lymphocytic leukemia is regulated by miR-29 and miR-181. Cancer Res. 2006;66:11590–3. doi: 10.1158/0008-5472.CAN-06-3613. [DOI] [PubMed] [Google Scholar]
- 41.Kok K, Naylor SL, Buys CH. Deletions of the short arm of chromosome 3 in solid tumors and the search for suppressor genes. Adv Cancer Res. 1997;71:27–92. doi: 10.1016/s0065-230x(08)60096-2. [DOI] [PubMed] [Google Scholar]
- 42.Banham AH, Beasley N, Campo E, et al. The FOXP1 winged helix transcription factor is a novel candidate tumor suppressor gene on chromosome 3p. Cancer Res. 2001;61:8820–9. [PubMed] [Google Scholar]
- 43.Shaffer AL, Rosenwald A, Staudt LM. Lymphoid malignancies: the dark side of B-cell differentiation. Nat Rev Immunol. 2002;2:920–32. doi: 10.1038/nri953. [DOI] [PubMed] [Google Scholar]
- 44.Streubel B, Vinatzer U, Lamprecht A, Raderer M, Chott A. T(3;14)(p14.1;q32) involving IGH and FOXP1 is a novel recurrent chromosomal aberration in MALT lymphoma. Leukemia. 2005;19:652–8. doi: 10.1038/sj.leu.2403644. [DOI] [PubMed] [Google Scholar]
- 45.Wlodarska I, Veyt E, De Paepe P, et al. FOXP1, a gene highly expressed in a subset of diffuse large B-cell lymphoma, is recurrently targeted by genomic aberrations. Leukemia. 2005;19:1299–305. doi: 10.1038/sj.leu.2403813. [DOI] [PubMed] [Google Scholar]
- 46.Felli N, Fontana L, Pelosi E, et al. MicroRNAs 221 and 222 inhibit normal erythropoiesis and erythroleukemic cell growth via kit receptor down-modulation. Proc Natl Acad Sci U S A. 2005;102:18081–6. doi: 10.1073/pnas.0506216102. [DOI] [PMC free article] [PubMed] [Google Scholar]
- 47.Medina R, Zaidi SK, Liu CG, et al. MicroRNAs 221 and 222 bypass quiescence and compromise cell survival. Cancer Res. 2008;68:2773–80. doi: 10.1158/0008-5472.CAN-07-6754. [DOI] [PMC free article] [PubMed] [Google Scholar]
- 48.le Sage C, Nagel R, Egan DA, et al. Regulation of the p27(Kip1) tumor suppressor by miR-221 and miR-222 promotes cancer cell proliferation. EMBO J. 2007;26:3699–708. doi: 10.1038/sj.emboj.7601790. [DOI] [PMC free article] [PubMed] [Google Scholar]
- 49.Felicetti F, Errico MC, Bottero L, et al. The promyelocytic leukemia zinc finger-microRNA-221/-222 pathway controls melanoma progression through multiple oncogenic mechanisms. Cancer Res. 2008;68:2745–54. doi: 10.1158/0008-5472.CAN-07-2538. [DOI] [PubMed] [Google Scholar]
Associated Data
This section collects any data citations, data availability statements, or supplementary materials included in this article.