Abstract
It is important to review trends in youth alcohol use over time in order to effectively tailor prevention programs to address those trends. This article reviews data on alcohol use behaviors from the Centers for Disease Control and Prevention's Youth Risk Behavior Survey in Hawai‘i from 1993 to 2007. Five alcohol use indicators were examined and stratified by grade level, from 9th grade through 12th grade. Significant drops in nearly all indicators are seen among 9th through 11th graders, but not among 12th graders. This suggests that Hawai‘i youth are responding well to anti-alcohol messaging as young teens, but a different approach may be needed to target older teens.
Introduction
Numerous studies have demonstrated a link between early onset drinking and an increased likelihood of problem drinking later in life.1–8 Adolescents who begin drinking before age 15 were four times as likely to be alcohol dependent than those who delay drinking until at least age 21.9 The deleterious effects of early onset drinking among youth include an increase likelihood of committing crimes, having problems in school, sustaining injuries, incurring motor vehicle crashes, and experiencing deaths. In 2007, the US Surgeon General declared alcohol was the preferred substance used among adolescents more than tobacco or illicit drugs.10 The prevalence of alcohol use among youth in Hawai‘i is lower compared to youth in the U.S. (29.1% vs. 44.7%, respectively), whereas the prevalence of heavy drinking among adults in Hawai‘i is higher compared to adults in the U.S. (18.6% vs. 15.8%, respectively).11
Alcohol use is the third leading cause of preventable death in the United States.12 In Hawai‘i, alcohol consumption is the primary attributing factor for motor vehicle accidents, which is the third leading cause of death. Youths who drink and drive were more affected by motor vehicle collisions.9,13,14 Also, in 2001–05, out of 132 motor vehicle crashes due to alcohol consumption among persons aged 1–85+, there were 2 deaths among persons aged 10–14, 16 deaths among persons aged 15–19, and 18 deaths among persons aged 20–24.15 Compared to the United States, in 2001–05, out of 13,819 motor vehicle crashes due to alcohol consumption among persons aged 0 to 65 years-old, the leading number of deaths were 5,540 among persons aged 20–34, followed by 1,584 among persons aged 0–19.14 The reports from Hawai‘i and the United States demonstrate the trend of alcohol attributable deaths start with adolescents and increased when teens drink and drive. Last, mortality from motor vehicle accidents and alcohol use occurred mostly among young adults.
Some measurable outcomes related to youth alcohol use are age of drinking onset, lifetime and recent incidence of alcohol use, and incidence of alcohol-related violence. Thus, understanding and tracking trends in these outcomes over time can aid the establishment of clear alcohol prevention objectives, which are essential to the planning and evaluation of prevention programs. In 2000, the areas with the highest concentration of Asian and Pacific Islanders (API) (over 25%) included Hawai‘i.16 Honolulu County had the highest proportion of Asians (62%) in Hawai‘i. Thus, Hawai‘i is a unique state in that the majority of the population comprise of API persons. However, there is limited knowledge on specific rates among API youth, particularly by grade level.
The Healthy People 2010 objectives include increasing the age and proportion of adolescents who remain alcohol and drug free, and reducing the proportion of persons who engage in binge drinking.17 Therefore, the purpose of the study is to understand the trends of underage drinking in Hawai‘i over time, thereby, assisting stakeholders such as public health educators, legislators, and government officials with valuable knowledge that may be utilized to effectively tailor alcohol prevention programs among youth by specific grade level. This study examined data from the Centers for Disease Control and Prevention, Youth Risk Behavior Survey (YRBS), which was administered to 9th to 12th grade students in Hawai‘i from 1993–2007.
Method
Data Collection
The YRBS is a biennial, nationwide survey of adolescents, grades 9–12, administered by the CDC as part of their Youth Risk Behavior Surveillance System. The survey was administered in public schools in Hawai‘i. The self-reported survey, which was first conducted in 1991, measures the prevalence of a variety of risk factors, including alcohol use and factors relating to alcohol use. A comprehensive description of YRBS procedures is reported elsewhere.18
The response rates and sample size by year of the YRBS are 63% (n=1,577) in 1993, 62% (n=1,244) in 1995, 63% (n=1,409) in 1997, 60% (n=1,248) in 1999, 60% (n=1,662) in 2005, and 60% (n=1,191) in 2007. The response rates were at least 60% for each year, which is a CDC requirement for the data to be weighted.19 The respondents were students from 27 public high schools.19,20
Measure
Seven questions related to alcohol use were asked: (1) During your life, on how many days have you had at least one drink of alcohol?; (2) How old were you when you had your first drink of alcohol other than a few sips?; (3) During the past 30 days, on how many days did you have at least one drink of alcohol?; (4) During the past 30 days, on how many days did you have at least five or more alcoholic drinks in a row?; (5) During the past 30 days how did you usually get the alcohol you drank?; (6) During the past 30 days, on how many days did you have at least one drink of alcohol on school property?; and, (7) During the past 30 days, what type of alcohol did you usually drink? Questions 5 and 7 were excluded from the analysis because they were only asked in 2007.
Responses to the remaining five questions were dichotomized into binary outcomes as follows:
Lifetime use: those who have had at least one drink of alcohol on at least one day during their life versus those who have not (Figure 1);
Onset age: those who had their first drink of alcohol before age 13 versus those who had their first drink at age 13 or later (Figure 2);
Current or recent use: those who had at least one drink of alcohol on at least one day during the 30 days before the survey versus those who had not drank during the previous 30 days (Figure 3);
Binge drinking: those who had five or more drinks of alcohol in a row, that is, within a couple of hours, on at least one day during the 30 days before the survey versus those who had not (Figure 4); and
Drinking on school property: those who had at least one drink of alcohol on school property on at least one day during the 30 days before the survey versus those who had not (Figure 5).
Figure 1.
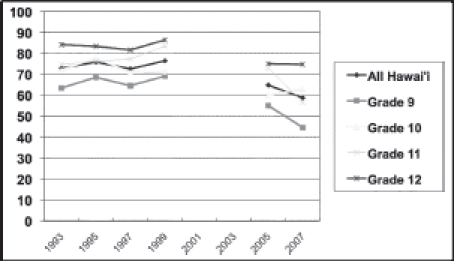
Lifetime Alcohol Use: Percentage of Students Who Reported at Least One Drink of Alcohol on at Least One Day During Their Life
Note: Data from the 1991, 2001, and 2003 Youth Risk Behavior Surveys were not weighted, thus, are excluded in this study's analysis.
Figure 2.
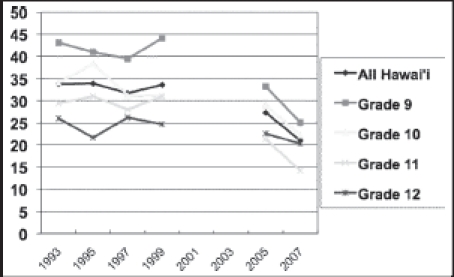
Percentage of Students Who Reported Drinking Alcohol (other than a few sips) Before Age 13
Note: Data from the 1991, 2001, and 2003 Youth Risk Behavior Surveys were not weighted, thus, are excluded in this study's analysis.
Figure 3.
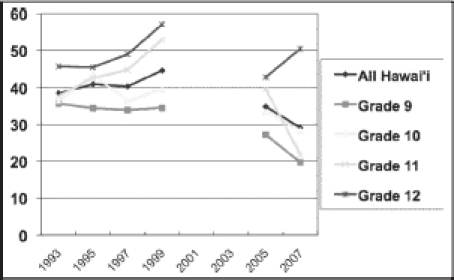
Current Alcohol Use: Percentage of Students Who Reported Having at Least One Drink of Alcohol on at Least One Day During the 30 Days Before the Survey
Note: Data from the 1991, 2001, and 2003 Youth Risk Behavior Surveys were not weighted, thus, are excluded in this study's analysis.
Figure 4.
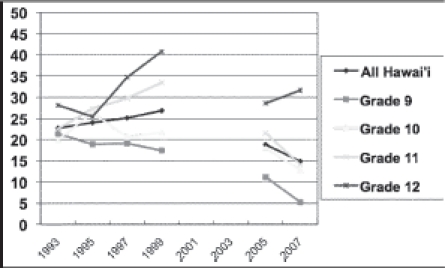
Episodic Heavy Drinking: Percentage of Students Who Reported Having Five or More Drinks of Alcohol in a Row, that is, within a Couple of Hours, on at Least One Day During the 30 Days Before the Survey
Note: Data from the 1991, 2001, and 2003 Youth Risk Behavior Surveys were not weighted, thus, are excluded in this study's analysis.
Figure 5.
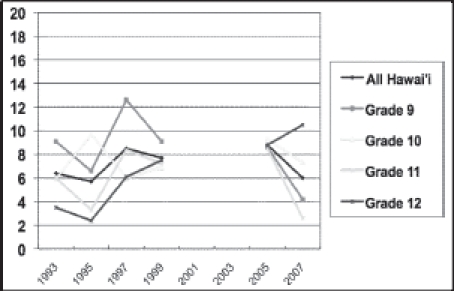
Percentage of students Who Reported Drinking at Least One Drink of Alcohol on School Property on at Least One Day During the 30 Days Before the Survey
Note: Data from the 1991, 2001, and 2003 Youth Risk Behavior Surveys were not weighted, thus, are excluded in this study's analysis.
Data Analysis
The YRBS website offers an online catalog to compare survey results by region, survey year, and demographic characteristics.21 For this analysis, this catalog was used to compare results from all six survey years within each grade level.
For this analysis, comparisons were made for the overall time period from 1993–2007, followed by an assessment of the intervening time periods to determine when the largest change or data trend occurred. Data on alcohol behaviors from the 1993,1995, 1997, 1999, 2005 and 2007 surveys were compared in order to determine trends over time for the state of Hawai‘i. Because data from the 1991, 2001 and 2003 surveys were not weighted, these years were not utilized in our analysis. Overall, trends for Hawai‘i have been reported,20 but our analysis stratifies data by grade level in order to tailor effective future objectives to each specific age-group. Significant differences between survey years, and the estimates for Hawai‘i including confidence intervals, came from the online catalog for YRBS. Institutional review board approval was granted by the University of Hawai'i at Manoa for data analysis purposes.
Results
Lifetime Use (Figure 1)
Overall, the lifetime drinking prevalence among Hawai‘i youth declined steadily, from 72.8% to 58.7% since 1993 (p<0.05). Among ninth graders in particular, the percentage who reported that they drank at least one alcoholic beverage on at least one occasion in their lives was significantly less in 2007, at 44.6%, than in 1993 (63.4%) (p<0.05). The largest decreases, both overall and among 9th graders, occurred between 1999 and 2005 (p<0.05). However, it is unclear when this decrease may have precisely occurred since data from 2001 and 2003 are unavailable. Although overall lifetime alcohol consumption prevalence declined for grades 10, 11, and 12 as well, these decreases were not significant.
Onset Age (Figure 2)
The proportion of students in the overall sample who reported their first drink of alcohol before age 13 decreased significantly, from 33.8% in 1993 to 21.0% in 2007 (p<0.05). Significant decreases in this measure were also observed in grade 9 (from 43.1% in 1993 to 25.1% in 2007, p<0.05), and grade 11 (from 29.4% in 1993 to 14.2% in 2007, p<0.05). Unlike the other four measures examined in this analysis, 9th graders showed the highest rates, with decreasing rates reported with increasing grade level (except for 1997–1999).
Current and Recent Use (Figure 3)
There was a decreasing trend in the prevalence of current and recent alcohol use in grade 9 whereas there was an increasing trend in the prevalence among 10th graders in 1995 and 1999 and 11th and 12th graders from 1993 to 1999. However, the only group that reported significantly decreased rates of recent alcohol consumption (from 35.6% in 1993 to 19.7% in 2007, p<0.05) was grade 9. Among the overall sample, little difference was seen, with a non-statistically significant decrease from 38.4% in 1993 to 29.1% in 2007. Among 11th graders, a significant decrease in recent alcohol use prevalence was seen from 39.5% in 1999 to 21.8% in 2007 (p<0.05), but this rate is not significantly lower than the rate in 1993 (37.7%).
Binge Drinking (Figure 4)
Although overall binge drinking prevalence among Hawai‘i youth dropped from 22.7% in 1993 to 14.9% in 2007, this decrease in trend was not significant. Among 9th graders, however, a significant drop was observed, from 21.3% in 1993 to 5.2% in 2007 (p<0.05). The prevalence of binge drinking among 10th and 11th graders decreased over the 14 year period, but increased slightly among 12th graders; however, the differences were not statistically significant.
Drinking on School Property (Figure 5)
Drinking on school property was the least prevalent of all five alcohol use behaviors among Hawai‘i youth, but was also the only measure which increased significantly, albeit only among 12th graders. Youths in 12th grade were the only group in which an upward trend was observed, a steady increase from 3.5% in 1993 to 10.5% in 2007 (p<0.05). Ninth graders reported high rates of recent drinking on school property in 1993 and 1999 at 9.1%; as well as reported the highest rates of recent drinking on school property in 1997, higher than all other grades, at 12.6%. This figure has steadily decreased from this spike to 4.2% in 2007 (p<0.05). The only other notable change was a sharp decline in this behavior among 11th graders, from 8.5% in 2005 to 2.6% in 2007 (p<0.05).
Discussion
Prevalence of Drinking
Overall, most alcohol indicators have decreased in prevalence among Hawai‘i youth over the past 14 years. The majority of decreases in prevalence across behaviors were seen among 9th graders; in fact, the prevalence of all five drinking behaviors dropped significantly among this group only. This may indicate that programs are targeting younger teens, or that younger teens are more influenced by anti-alcohol messaging than older teens. Another reason may be due to the types of interventions being offered such as the I Mua Mau Ohana's culturally based approach to substance abuse treatment programs for national Hawaiian youth.22 Although not all interventions have been proven to be effective, the majority have had a small to medium impact.23
The foremost exception to the overall downward trend in all of the adolescent drinking behaviors is among 12th graders, where there was an increased prevalence in the past 30-day drinking and binge drinking since 2005. However, because these increases are not statistically significant, it could likely indicate a leveling out of these rates.
There was a significant increase in drinking on school property among 12th graders in the past 14 years. Although the prevalence of this behavior is low in comparison to other drinking behaviors, it is noteworthy because it may suggest that there is a lack of supervision among this group. It is also interesting that this behavior used to be more prevalent among 9th graders, but has decreased in popularity among this group while there was an increase seen among 12th graders.
The prevalence of most drinking behaviors increases with grade level. The notable exception is with age of drinking onset, where more 9th graders report having their first drink before age 13, and then the prevalence rates decrease with increasing grade level. This trend has been consistent throughout the past 14 years where the prevalence of early drinking onset has been decreasing since 1993; one plausible explanation for this observed trend is recall bias because 9th graders are closer to the age of 13, they may remember the actual age of their first drink more accurately. Additional analyses are needed, such as a comparison of the average age of onset across grade level, adjusting for age.
Multiple Characteristics of Alcohol Use
Five questions related to alcohol use were examined. However, race, gender, and socio-economic conditions, violence, illicit drug use, smoking, and sexual activity are additional factors that may be related to alcohol use.24–28 The co-occurrence of these factors could characterize the multi-dimensionality of the use of alcohol by adolescents, and should be explored in future research.
Comparisons with United States Data
These trends are similar to those seen in the YRBS U.S data.12 Significant decreases in prevalence were seen in nearly all five measures since 1993, with the exception of current drinking. Furthermore, these decreases occurred primarily among 9th graders (i.e. all five measures were significantly less prevalent in 2007 than in 1993), and less so among 12th graders (only early age of drinking onset was less prevalent over time).
Although Hawai‘i's downward trend is consistent with national trends, Hawai‘i actually conveys a “better portrait” compared to the general US youth population, specifically in the areas of lifetime alcohol use, recent alcohol use, and binge drinking. With the exception of drinking on school property among 12th graders, significantly fewer 9th, 10th and 11th graders reported participating in these behaviors in Hawai‘i compared with 9th, 10th and 11th grades in the general US population. Whereas in Hawai‘i, there was an increased prevalence of drinking on school property among 12th graders, the prevalence remained relatively consistent through time among 12th graders in the general US population. In 2007, significantly more 12th graders in Hawai‘i reported drinking on school property within the 30 days preceding the survey than 12th graders in the general US population.
Strengths and Limitations
The definition of race has changed over the years. This study is limited in its ability to make valid comparisons over time by race/ethnicity, particularly among API, but still provide a useful examination of alcohol use among Hawai‘i's youth who are predominately API.
Also, the YRBS uses a conservative approach to the testing of significance (95% confidence interval).29 This however, allows some level of confidence that the differences observed are indeed true differences.
Furthermore, the data are self-reported. Hence, it is possible that there is underreporting of alcohol use, especially given the high proportion of API. API persons may be less likely to report undesirable behaviors due to shame and loss of face -factors that are particularly salient in API cultures.30,31 However, Brener, Billy and Grady (2003) conducted a review of the literature and concluded that though situational and cognitive factors affect the validity of self-reported data, “these factors… do not threaten the validity of self-reports” and “the importance of assessing health-risk behaviors as part of research activities involving adolescents necessitates the use of self-report measures.” 32
The YRBS data are restricted to public school students; thus, the conclusions of this study are limited to only public (vs. private or home-schooled) school students. Also, the small sample size prevents the ability to conduct additional analyses (the YRBS do not report subgroup findings if the cell size is <100 students29).
Recommendations
To the authors' knowledge, there are no specific anti-alcohol messaging interventions that target older teens; however, interventions targeting youths and incoming college freshman have shown to be effective. For example, one community and school intervention included a workshop and presentation with one underage drinking video, and distributed handouts, and incorporated group discussions between youths and adults.33 The objective of the program was to increase awareness about the problem of underage drinking, increase viewers and participants' knowledge, and encourage discussion about underage drinking. The results showed that legal consequences of underage drinking were not common knowledge, and that a welldesigned one-time program can be efficient.
Another study examined the effectiveness of two e-Interventions, AlcoholEdu and The Alcohol eCHECKUP TO GO (e-Chug), in reducing and preventing both alcohol use and alcohol-related consequences for incoming college freshmen students.34 AlcoholEdu is a 3-hour educational program that utilizes multimedia presentations and focuses on three content areas: first, presenting social pressures, injunctive alcohol norms, alcohol advertising, and biopsychosocial consequences of binge drinking; second, providing information about the physiological effects of alcohol; and third, suggesting ways for safer drinking. e-Chug is a brief 20 minutes alcohol e-Intervention, which focuses on three main areas: first, providing students with personalized normative feedback such as using text and illustrations to present the amount of alcohol consumed, estimated annual monetary cost of the alcohol consumed, estimated blood alcohol content, and negative alcohol-related consequences; second, presenting three short videos about standardized drink definitions, blood alcohol content, and the biphasic response curve; and third, containing a list of safer-drinking strategies and a referral list of local and national resources. Participants who received the AlcoholEdu intervention had significantly fewer lower alcohol-related consequences than assessment-only controls, while a trend showed reduced consequences in participants who received e-Chug versus assessment-only. The Internet-based intervention for incoming college freshmen suggested that the program may be useful to schools with limited resources.
Study Implications/Next Steps
These intervention findings may be used to design culturally appropriate and age specific alcohol prevention programs among older teens. The design of the intervention tailored to older teens may include family involvement and discussion or an Internet-based intervention in reducing the likelihood of alcohol use during the start of a teen's first year in college. A key area for further research is to determine whether in-person intervention or e-Intervention would be culturally appropriate among API.
Footnotes
Support for this manuscript made possible through funding from the Hawai‘i SPF-SIG grant, Alcohol and Drug Abuse Division, State Department of Health.
References
- 1.Buchmann AF, Schmid B, Blomeyer D, et al. Impact of age at first drink on vulnerability to alcoholrelated problems: Testing the marker hypothesis in a prospective study of young adults. J Psychiatr Res. 2009 Mar 28; doi: 10.1016/j.jpsychires.2009.02.006. [DOI] [PubMed] [Google Scholar]
- 2.Grant BF, Stinson FS, Harford TC. Age at onset of alcohol use and DSM-IV alcohol abuse and dependence: a 12-year follow-up. J Subst Abuse. 2001;13(4):493–504. doi: 10.1016/s0899-3289(01)00096-7. [DOI] [PubMed] [Google Scholar]
- 3.Hawkins JD, Graham JW, Maguin E, Abbott R, Hill KG, Catalano RF. Exploring the effects of age of alcohol use initiation and psychosocial risk factors on subsequent alcohol misuse. J Stud Alcohol. 1997 May;58(3):280–290. doi: 10.15288/jsa.1997.58.280. [DOI] [PMC free article] [PubMed] [Google Scholar]
- 4.Hingson RW, Heeren T, Winter MR. Age at drinking onset and alcohol dependence: age at onset, duration, and severity. Arch Pediatr Adolesc Med. 2006 Jul;160(7):739–746. doi: 10.1001/archpedi.160.7.739. [DOI] [PubMed] [Google Scholar]
- 5.Pitkanen T, Lyyra AL, Pulkkinen L. Age of onset of drinking and the use of alcohol in adulthood: a follow-up study from age 8–42 for females and males. Addiction. 2005 May;100(5):652–661. doi: 10.1111/j.1360-0443.2005.01053.x. [DOI] [PubMed] [Google Scholar]
- 6.Stueve A, O‘Donnell LN. Early alcohol initiation and subsequent sexual and alcohol risk behaviors among urban youths. Am J Public Health. 2005 May;95(5):887–893. doi: 10.2105/AJPH.2003.026567. [DOI] [PMC free article] [PubMed] [Google Scholar]
- 7.Wells JE, Horwood LJ, Fergusson DM. Drinking patterns in mid-adolescence and psychosocial outcomes in late adolescence and early adulthood. Addiction. 2004 Dec;99(12):1529–1541. doi: 10.1111/j.1360-0443.2004.00918.x. [DOI] [PubMed] [Google Scholar]
- 8.York JL, Welte J, Hirsch J, Hoffman JH, Barnes G. Association of age at first drink with current alcohol drinking variables in a national general population sample. Alcohol Clin Exp Res. 2004 Sep;28(9):1379–1387. doi: 10.1097/01.alc.0000139812.98173.a4. [DOI] [PubMed] [Google Scholar]
- 9.MacKay AP DC. Adolescent Health in the United States, 2007. U.S. Department for Health and Human Services, Centers for Disease Control and Prevention, National Center for Health Statistics; 2007. [October 4, 2009]. Available at: http://www.cdc.gov/nchs/data/misc/adolescent2007.pdf. [Google Scholar]
- 10.US Department of Health and Human Services, author. The Surgeon General‘s Call to Action to Prevent and Reduce Underage Drinking. 2007. [September 22, 2009]. http://www.surgeongeneral.gov/topics/underagedrinking/about.html. [PubMed]
- 11.Centers for Disease Control and Prevention, author. Chronic Disease Indicators. State/Area Profile: United States compared with Hawaii. 2007. [November 10, 2009]. http://apps.nccd.cdc.gov/cdi/SearchResults.aspx?IndicatorIds=6,5,9,35,11,22,64,29,7,8,126&StateIds=46,12&StateNames=United%20States,Hawaii&FromPage=HomePage.
- 12.Centers for Disease Control and Prevention, author. Alcohol and Public Health. Department of Health and Human Services; 2008. [November 11, 2009]. http://www.cdc.gov/alcohol/index.htm. [Google Scholar]
- 13.Hawai‘i State Department of Health, author. Health Status - Leading Causes of Death. A Office of Health Status Monitoring, Vital Statistics Records. 2000. [November 10, 2009]. http://www.healthtrends.org/status_mortality_leading.aspx.
- 14.Centers for Disease Control and Prevention, author. Alcohol-Attributable Deaths Report, Average for United States 2001–2005. 2004. [November 12, 2009]. https://apps.nccd.cdc.gov/ardi/Report.aspx?T=AAM&P=f214cf69-cad7-496face2-2a09b9d6a126&R=804296a0-ac47-41d3-a939-9df26a176186&M=E2769A53-0BFC-453F-9FD7-63C5AA6CE5D7&L=&F=AAMCauseAgeGroupAllNew&D=H.
- 15.Centers for Disease Control and Prevention, author. Total Deaths Data Set, Average for Hawaii 2001–2005. Alcohol and Public Health. 2004. [November 12, 2009]. https://apps.nccd.cdc.gov/ardi/Report.aspx?T=Mortality&M=CC7D4666-6A2D-45CC-9FD1-E7DF9206F11F.
- 16.Barnes J, Bennett C. The Asian Population: 2000: U.S. Census Bureau. 2000. [Google Scholar]
- 17.US Department of Health and Human Services, author. Healthy People 2010. 2nd ed. Washington D.C.: U.S. Government Printing Office; 2000. With Understanding and Improving Health and Objectives for Improving Health. [Google Scholar]
- 18.Centers for Disease Control and Prevention, author. Methodology of the Youth Risk Behavior Survellance System. 2004. [September 24, 2009]. http://www.cdc.gov/mmwr/PDF/rr/rr5312.pdf.
- 19.Hawaii Health Data Warehouse. YRBS Reports. 2010. [February 14, 2010]. http://www.hhdw.org/cms/index.php?page=yrbssreports.
- 20.Saka S. Results of the 2007 Hawai‘i Youth Risk Behavior Surveys and Cross-Year Comparisons. Manoa: Curriculum Research and Development Group at the University of Hawai‘i; 2008. [Google Scholar]
- 21.Centers for Disease Control and Prevention, author. Youth Online: Home Page. 2008. [September 22, 2009]. http://apps.nccd.cdc.gov/yrbss/index.asp.
- 22.Kim RJ, Jackson DS. Outcome evaluation findings of a Hawaiian culture-based adolescent substance abuse treatment program. Psychological Services. 2009;6(1):43–55. [Google Scholar]
- 23.Rundall TG, Bruvold WH. A meta-analysis of school-based smoking and alcohol use prevention programs. Health Educ Q. 1988 Fall;15(3):317–334. doi: 10.1177/109019818801500306. [DOI] [PubMed] [Google Scholar]
- 24.Swahn MH, Donovan JE. Correlates and predictors of violent behavior among adolescent drinkers. J Adolesc Health. 2004 Jun;34(6):480–492. doi: 10.1016/j.jadohealth.2003.08.018. [DOI] [PubMed] [Google Scholar]
- 25.Hanna EZ, Yi HY, Dufour MC, Whitmore CC. The relationship of early-onset regular smoking to alcohol use, depression, illicit drug use, and other risky behaviors during early adolescence: results from the youth supplement to the third national health and nutrition examination survey. J Subst Abuse. 2001;13(3):265–282. doi: 10.1016/s0899-3289(01)00077-3. [DOI] [PubMed] [Google Scholar]
- 26.Hughes SK, Hughes K, Atkinson AM, Bellis MA, Smallthwaite L. Smoking behaviours, access to cigarettes and relationships with alcohol in 15- and 16-year-old schoolchildren. Eur J Public Health. Feb 9; doi: 10.1093/eurpub/ckp234. [DOI] [PubMed] [Google Scholar]
- 27.Jackson KF, LeCroy CW. The influence of race and ethnicity on substance use and negative activity involvement among monoracial and multiracial adolescents of the southwest. J Drug Educ. 2009;39(2):195–210. doi: 10.2190/DE.39.2.f. [DOI] [PubMed] [Google Scholar]
- 28.Ta VM, Chen T. Substance abuse among native Hawaiian women in the United States: a review of current literature and recommendations for future research. J Psychoactive Drugs. 2008 Nov;(Suppl 5):411–422. doi: 10.1080/02791072.2008.10400668. [DOI] [PubMed] [Google Scholar]
- 29.Centers for Disease Control and Prevention, author. Methodology of the Youth Risk Behavior Surveillance System. Morbidity and Mortality Weekly Report. 2004. 53 (RR-12) [PubMed] [Google Scholar]
- 30.US Department of Health and Human Services, author. Mental Health: Culture, Race, and Ethnicity- A Supplement to Mental Health: A Report of the Surgeon General. Rockville: U.S. Department of Health and Human Services. Substance Abuse and Mental Health Services Administration. Center for Mental Health Services; 2001. SMA-01-3613. [Google Scholar]
- 31.Zane N, Yeh M. The Use of Culturally-based Variables in Assessment: Studies on Loss of Face. In: Kurasaki KS, Okazaki S, Sue S, editors. Asian American mental health : assessment theories and methods. New York: Kluwer Academic/Plenum Publishers; 2002. pp. 123–138. [Google Scholar]
- 32.Brener ND, Billy JO, Grady WR. Assessment of factors affecting the validity of self-reported healthrisk behavior among adolescents: evidence from the scientific literature. J Adolesc Health. 2003 Dec;33(6):436–457. doi: 10.1016/s1054-139x(03)00052-1. [DOI] [PubMed] [Google Scholar]
- 33.Glanz K, Maddock JE, Shigaki D, Sorensen CA. Preventing underage drinking: a “roll of the dice”. Addict Behav. 2003 Jan-Feb;28(1):29–38. doi: 10.1016/s0306-4603(01)00212-x. [DOI] [PubMed] [Google Scholar]
- 34.Hustad JT, Barnett NP, Borsari B, Jackson KM. Web-based alcohol prevention for incoming college students: A randomized controlled trial. Addict Behav. 2009 Oct 22; doi: 10.1016/j.addbeh.2009.10.012. [DOI] [PMC free article] [PubMed] [Google Scholar]


