

Abstract
Investigating genetic interactions (epistasis) has proven difficult despite the recent advances of both laboratory methods and statistical developments. With no ‘best’ statistical approach available, combining several analytical methods may be optimal for detecting epistatic interactions. Using a multi-stage analysis that incorporated supervised machine learning and methods of association testing, we investigated epistatic interactions with a well-established genetic factor (PTPN22 1858T) in a complex autoimmune disease (rheumatoid arthritis (RA)). Our analysis consisted of four principal stages: Stage I (data reduction)—identifying candidate chromosomal regions in 292 affected sibling pairs, by predicting PTPN22 concordance using multipoint identity-by-descent probabilities and a supervised machine learning algorithm (Random Forests); Stage II (extension analysis)—testing detailed genetic data within candidate chromosomal regions for epistasis with PTPN22 1858T in 677 cases and 750 controls using logistic regression; Stage III (replication analysis)—confirmation of epistatic interactions in 947 cases and 1756 controls; Stage IV (combined analysis)—a pooled analysis including all 1624 RA cases and 2506 control subjects for final estimates of effect size. A total of seven replicating epistatic interactions were identified. SNP variants within CDH13, MYO3A, CEP72 and near WFDC1 showed significant evidence for interaction with PTPN22, affecting susceptibility to RA.
Keywords: epistasis, rheumatoid arthritis, PTPN22, Random Forests
Introduction
Genome-wide association studies, which provide the ability to simultaneously investigate hundreds of thousands of genetic markers in large numbers of individuals, have successfully led to the discovery of genetic risk factors with modest effects in several complex diseases, including autoimmune diseases.1,2 Nevertheless, it is apparent that current approaches to genetic analysis, which include almost exclusively, marginal associations using a univariate approach, are not able to identify a substantial fraction of the genetic burden. This may reflect the involvement of rare variants, copy number variation, gene × gene interactions, gene × environment interactions and/or epigenetic mechanisms. Currently, there is no consensus regarding appropriate approaches for evaluating these components of complex diseases.
Investigating genetic or gene × gene interactions (also known as ‘epistasis’, where the action of one gene is modified by one or several other genes) has proven difficult, despite recent advances of both laboratory methods and statistical developments. For example, the 15th biennial Genetic Analysis Workshop (GAW15) investigated genetic interactions in rheumatoid arthritis (RA (MIM 180300)) using several data sets. A variety of statistical approaches were used to investigate epistasis in RA in both family and population-based data sets with varying genetic marker density; results varied greatly, showing that robust and comprehensive approaches not restricted by a small sample size or sparse data are necessary.3–8 With no ‘best’ statistical approach available, combining several analytical methods may be optimal for detecting epistatic interactions.9,10 Here, we performed a comprehensive multi-stage genetic investigation with a replication analysis to reveal epistatic relationships, involving the well-established PTPN22 (protein tyrosine phosphatase non-receptor 22; GeneID 26191) risk variant, that alter susceptibility to RA.
RA is a chronic multi-system autoimmune disease, resulting from persistent inflammatory synovitis and subsequent erosion of the joint architecture. It is considered a complex disease with a multi-factorial etiology influenced by both genetic and environmental risk factors. Genetic predisposition to RA is suspected to involve multiple genes with incomplete penetrance, interacting in a variety of biological pathways.11 A large number of earlier studies have investigated the role of genetic factors in RA. The HLA-DRB1 (GeneID 3123) shared epitope (SE; HLA-DRB1 alleles: 0101, 0102, 0401, 0404, 0405, 0408, 0413, 1001, and 1402) and PTPN22 1858T alleles have been consistently associated with greater risk12–14 Similar to HLA-DRB1, PTPN22 is a strong biological candidate as it regulates T-cell receptor signaling and confers risk for multiple autoimmune diseases, though there is limited knowledge regarding the exact etiological mechanism(s).15,16
Previous genome-wide linkage scans in RA identified evidence for additional loci, however uncovering the susceptibility genes within these regions has been difficult.17,18 Recent candidate gene and genome-wide association studies have reported strong evidence for several genes with modest contributions to RA susceptibility, including CTLA4, PADI4, REL, STAT4 and TRAF1-C5, as well as loci within chromosomal regions 6q23, 10p15, 12q13 and 22q13.19–26 Multiplex interactions between genetic and environmental risk factors (gene × gene, gene × environment, gene(n) × environment) have been implicated in RA, however the scope of earlier studies has been restricted primarily to candidate risk factors.14,27–30 To understand the etiologic mechanisms involved in RA, a clear understanding of the intricate genetic architecture underlying susceptibility, including the complete identification of epistatic relationships between genes, particularly those that do not show independent, or marginal, disease associations, is necessary. Using a multi-stage strategy framed within a genome-wide perspective, we identified evidence for novel epistatic risk factors interacting with PTPN22 to influence RA susceptibility.
Results
We investigated epistatic interactions with the PTPN22 1858T risk variant (rs2476601) in RA cases (available through the North American Rheumatoid Arthritis Consortium (NARAC)) and who were predominantly positive for the presence of antibodies to cyclic citrullinated peptide (anti-CCP; Table 1) and healthy controls of European origin using four principal stages: Stage I (data reduction)—identification of relevant chromosomal regions in 292 affected sibling pairs (ASPs) using Random Forests, a supervised machine learning algorithm; Stage II (extension analysis)—testing for epistasis with PTPN22 1858T in 677 cases and 750 controls; Stage III (replication analysis)—confirmation of epistatic interactions in 947 cases and 1756 controls; Stage IV (combined analysis)—a combined analysis including all 1624 RA cases and 2506 control subjects to determine final estimates of effect size (Figure 1).
Table 1.
Clinical and demographic features of the RA family and case–control data sets
| Study population | N | Female:male ratio | Age of onset (years) | PTPN22 1858T carrier (%)a | Shared epitope carrier (%)b | Anti-CCP status (%) |
|---|---|---|---|---|---|---|
| Stage I | ||||||
| RA cases | 530 | 3.3:1 | 39.2 | 29.1% (n = 154) | 83.8% (n = 444) | 90.8% (n = 481) |
| ASPs | 292 | — | — | 83 | 227 | 259 |
| Stage II (NARAC I) | ||||||
| All RA cases | 908 | 2.8:1 | 45.5 (n = 884) | 27.8% (n = 898) | 97.9% (n = 865) | 100% (n = 907) |
| All controls | 1260 | 2.5:1 | NA | 15.6% (n = 1253) | 44.6% (n = 1159) | NA |
| NEc RA cases | 682 | 2.8:1 | 45.7 (n = 670) | 27.6% (n = 677) | 97.7% (n = 641) | 100% (n = 681) |
| NEc controls | 752 | 2.3:1 | NA | 16.8% (n = 750) | 46.7% (n = 752) | NA |
| Stage III (NARAC II) | ||||||
| All RA cases | 952 | 1.2:1d | 47.2 (n = 917) | 27.4% (n = 947) | NA | 100% (n = 921) |
| All controls | 1760 | NA | NA | 17.2% (n = 1756) | NA | NA |
Abbreviations: ASP, affected sibling pairs; NARAC, North American Rheumatoid Arthritis Consortium; RA, rheumatoid arthritis.
Individuals were PTPN22 1858T carriers if they had one or more 1858T alleles. In Stage II, the PTPN22 1858T allele was associated with RA using all individuals (OR = 2.09, 95% CI: 1.69–2.60) and when restricted by Northern European ancestry (OR = 1.89, 95% CI: 1.45–2.46). In Stage III, the PTPN22 1858T allele was associated with RA (OR = 1.81, 95% CI: 1.49–2.20).
Individuals were shared epitope carriers if they had one or more of the following HLA-DRB1 alleles: 0101, 0102, 0401, 0404, 0405, 0408, 0413, 1001 and 1402. However, four-digit typing was not available for all subjects, thus cases with HLA-DRB1*04/01/10 were assumed to be carriers for shared epitope.
Subjects with at least 90% Northern European ancestry.
Lower female:male ratio reflects overrepresentation of male RA cases from the Veterans Affairs Rheumatoid Arthritis Registry.
Figure 1.
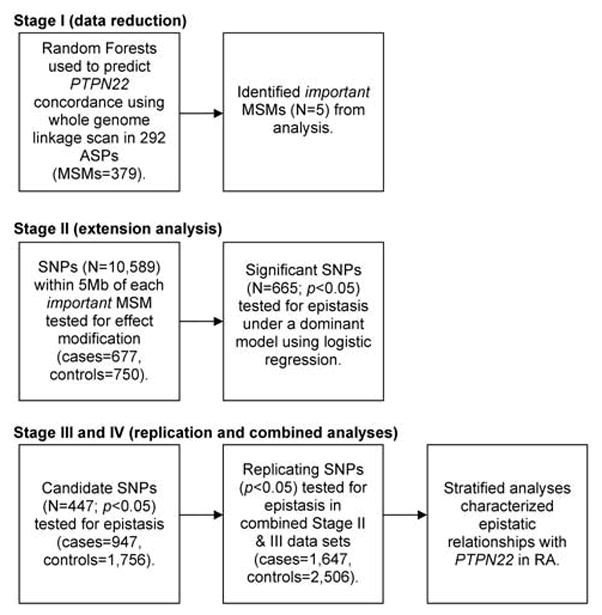
Summary of analytical approach to identify evidence for epistatic relationships with PTPN22 in RA.
Stage I (data reduction)
A non-parametric approach using a supervised machine learning algorithm (Random Forests) and multipoint identity-by-descent (mIBD) probabilities identified promising regions harboring epistatic candidates for PTPN22 in 292 ASPs from 512 multiplex RA families. This case-only analysis investigated mIBD probabilities for 379 microsatellite markers (MSMs) from across the genome (~10 cM coverage), as well as gender and HLA-SE, were used to predict PTPN22 1858T concordance in ASPs using the Random Forests algorithm (see Materials and methods). Random Forests assigns each predictor a variable importance (VI) score, with more important predictors having greater values. On the basis of the distribution of the VI scores, the five top-ranking predictors were considered important predictors of PTPN22 concordance in the ASPs (see Supplementary Figure 1), as there appeared to be a clear distinction between the VI scores for these predictors compared with the remaining predictors. The five important predictors were mIBD probabilities for MSMs in the following chromosomal regions: 4q34, 5p15, 10p11, 14q23 and 16q23 (Table 2).
Table 2.
Top genomic regions identified by the Random Forests analysis in Stage I (292 ASPs) and number of SNPs to be investigated in Stage II (NARAC I: 677 cases, 750 controls)
| Chr | MSM | Band | No. SNPsa |
|---|---|---|---|
| 4 | D4S2431 | 4q34.1 | 1580 |
| 5 | D5S2488 | 5p15.33 | 1167 |
| 10 | D10S1426 | 10p11.23 | 2016 |
| 14 | D14S592 | 14q23.1 | 2006 |
| 16 | D16S402 | 16q23.3 | 3820 |
Abbreviations: ASP, affected sibling pairs; GWA, genome-wide association; MSM, microsatellite marker; NARAC, North American Rheumatoid Arthritis Consortium.
SNP variants were selected if present in the NARAC I GWA data set, satisfied quality control criteria, and were within 5 Mb of an important MSM identified by Random Forests (see Supplementary Figure 1).
Stage II (extension analysis)
We investigated important chromosomal regions through association tests in individuals with at least 90% Northern European ancestry (677 cases; 750 healthy controls) from the collective NARAC I data set (908 cases; 1260 healthy controls) for which dense genome-wide SNP data were available (Table 1). We evaluated our power to detect gene × gene interactions (see Materials and methods) and were sufficiently powered to investigate interactions under a dominant mode of inheritance. The presence of the PTPN22 1858T risk variant was significantly associated with RA in Caucasians when using the full NARAC I data set (odds ratio (OR) = 2.09, 95% CI: 1.69–2.60), as described earlier.22 Similar results were observed when the analysis was restricted to individuals with at least 90% Northern European ancestry (OR = 1.89, 95% CI: 1.45–2.46). A total of 10 589 SNPs within 5 Mb of an important locus satisfied quality control criteria (see Materials and methods; Table 2) and were investigated using the Breslow–Day test for homogeneity. A total of 665 SNPs significantly modified the effect of PTPN22 on susceptibility to RA (P-valueBD<0.05). Under a dominant model, 449 SNPs tested for epistasis (logistic regression) with PTPN22 showed significant (P-valueI<0.05; see Materials and methods) evidence for interaction in the NARAC I data set.
Stage III (replication analysis)
The replication analysis was performed in the NARAC II data set (947 cases and 1756 controls of European ancestry). The presence of the PTPN22 1858T risk variant was also significantly associated with RA in the replication data set as expected (OR =1.81, 95% CI: 1.49–2.20); results for the NARAC II cases have been reported earlier.26,31 Four hundred and forty-seven of the 449 SNPs that showed evidence for epistasis (Stage II) met quality control criteria and were formally tested for epistasis with PTPN22 in the NARAC II data set, under a dominant model. A total of seven epistatic relationships were replicated (P-valueI<0.05; Table 3). Individuals were stratified as carriers or non-carriers for the minor allele of each replicating SNP to characterize the relationship of PTPN22 1858T with RA susceptibility; consistent associations were observed across both Stage II (NARAC I) and Stage III (NARAC II) populations (Table 3).
Table 3.
Replicating results for tests of interaction between PTPN22 and candidate SNPs in two populations of European origins (Stages II and III), and the effect of PTPN22 when stratified by SNP of interest
| Chr | SNP | P-valueBDa | Stage IIb |
Stage IIIc |
||||||
|---|---|---|---|---|---|---|---|---|---|---|
| P-valueI | RORId (95% CI) | SNP carrierse | SNP non-carriersf | P-valueI | RORId (95% CI) | SNP carrierse | SNP non-carriersf | |||
| ORPTPN22(95% CI) | ORPTPN22 (95% CI) | ORPTPN22 (95% CI) | ORPTPN22 (95% CI) | |||||||
| 4 | rs4695888T | 0.041 | 0.016 | 2.02 (1.14–3.60) | 2.26 (1.66–3.06) | 1.11 (0.68–1.81) | 0.038 | 1.59 (1.03–2.45) | 2.04 (1.64–2.54) | 1.29 (0.88–1.87) |
| 5 | rs7726839G | 0.025 | 0.021 | 0.55 (0.33–0.91) | 1.39 (0.97–2.00) | 2.55 (1.77–3.66) | 0.046 | 0.68 (0.46–0.99) | 1.45 (1.09–1.94) | 2.15 (1.67–2.76) |
| 10 | rs12573019A | 0.029 | 0.022 | 1.99 (1.11–3.57) | 3.13 (1.89–5.19) | 1.58 (1.17–2.12) | 0.048 | 1.56 (1.00–2.42) | 2.53 (1.73–3.71) | 1.63 (1.31–2.03) |
| 10 | rs1168587T | 0.019 | 0.018 | 1.96 (1.12–3.44) | 2.30 (1.69–3.13) | 1.17 (0.73–1.87) | 0.037 | 1.55 (1.03–2.35) | 2.07 (1.65–2.60) | 1.33 (0.94–1.89) |
| 16 | rs1895535A | 0.018 | 0.038 | 2.94 (1.06–8.12) | 5.03 (1.89–13.43) | 1.71 (1.31–2.24) | 0.0076 | 2.42 (1.26–4.62) | 4.02 (2.17–7.45) | 1.67 (1.36–2.03) |
| 16 | rs7200573A | 0.026 | 0.021 | 0.54 (0.32–0.91) | 1.42 (1.00–2.02) | 2.61 (1.79–3.81) | 0.0015 | 0.54 (0.37–0.79) | 1.33 (1.01–1.74) | 2.46 (1.89–3.21) |
| 16 | rs11865624C | 0.028 | 0.050 | 0.48 (0.23–1.00) | 1.01 (0.51–2.01) | 2.12 (1.60–2.79) | 0.020 | 0.51 (0.28–0.90) | 1.00 (0.59–1.71) | 1.98 (1.62–2.42) |
Abbreviations: NARAC, North American Rheumatoid Arthritis Consortium; RA, rheumatoid arthritis.
Breslow–Day test was used as a test of effect modification, evaluating the homogeneity of association (OR) between an SNP variant and the risk for RA, across each strata of PTPN22 1858T carrier status in NARAC I data (677 RA cases and 750 controls). Only those SNPs with P-valueBD<0.05 were tested for epistasis.
Using NARAC I data: 677 RA cases and 750 controls.
Using NARAC II data: 947 RA cases and 1756 controls.
The test of epistasis is based on the interaction term (reported ratio of odds ratios (RORI) and 95% CI) between the dominant genetic model of PTPN22 1858T (CT/TT versus CC) and the dominant genetic model for the SNP variant.
Using RA cases and controls who carried the minor allele of the SNP variant of interest.
Using RA cases and controls who did not carry the minor allele of the SNP variant of interest.
Stage IV (combined analysis)
To determine final estimates of epistasis, replicated findings (N =7) were investigated in the combined analysis of the data sets from Stage II (NARAC I) and III (NARAC II), and included 1624 RA cases and 2506 healthy controls; minor allele frequencies for these SNPs did not differ between data sets showing no evidence for heterogeneity (data not shown) (Table 4). The effect of PTPN22 was significantly increased among individuals who were carriers of the minor allele for four SNP variants versus non-carriers, including: an intronic CDH13 variant (rs1895535 AA/AG: OR =3.95, 95% CI: 2.39–6.55, P = 1.0 ×10⁻⁷; rs1895535 GG: OR =1.69, 95% CI: 1.44–1.98, P<1 ×10⁻⁸); an intronic MYO3A variant (rs12573019 AA/AG: OR =2.78, 95% CI: 2.05–3.76, P<1 ×10⁻⁸; rs12573019 GG: OR = 1.60, 95% CI: 1.34–1.90; P =1.7 ×10⁻⁷); and two SNPs with no known function (rs4695888 CT/TT: OR = 2.10, 95% CI: 1.76–2.51, P<1 ×10⁻⁸; rs4695888 CC: OR =1.22, 95% CI: 0.91–1.65, P =0.18; and rs1168587 CT/TT: OR =2.13, 95% CI: 1.78–2.56, P<1 ×10⁻⁸; rs1168587 CC: OR =1.29, 95% CI: 0.98–1.70, P = 0.07). The effect of PTPN22 was reduced in carriers of three SNP variants versus non-carriers, including an intronic CDH13 variant (rs7200573 AA/AC: OR =1.37, 95% CI: 1.11–1.70, P =0.0034; rs7200573 CC: OR =2.47, 95% CI: 1.99–3.06, P<1 ×10⁻⁸); a variant 7 kb upstream WFDC1 (rs11865624 CC/CT: OR =1.01, 95% CI: 0.66–1.55, P = 0.95; rs11865624 TT: OR =2.01, 95% CI: 1.71–2.37, P = 1 ×10⁻⁸); and an intronic CEP72 variant (rs7726839 AG/GG: OR =1.46, 95% CI: 1.16–1.82, P = 0.0011; rs7726839 GG: OR =2.22, 95% CI: 1.81–2.73, P< 1 ×10⁻⁸) (Table 4).
Table 4.
Results for tests for interaction between PTPN22 and replicating SNPs in the combined data set, and results for the effect of PTPN22 1858T when stratified by SNP variants of interest under a dominant model (Stage IV)a
| Chr | SNP | MAFb | Stage IV
|
SNP carrierd |
SNP non-carriere |
Gene | |||
|---|---|---|---|---|---|---|---|---|---|
| RORIc (95% CI) | P-valueI | OR (95% CI) | P-value | OR (95% CI) | P-value | ||||
| 4 | rs4695888T | 0.50 | 1.71 (1.22–2.43) | 0.0021 | 2.10 (1.76–2.51) | <1 ×10⁻⁸ | 1.22 (0.91–1.65) | 0.184 | |
| 5 | rs7726839G | 0.26 | 0.65 (0.48–0.89) | 0.0061 | 1.46 (1.16–1.82) | 0.0011 | 2.22 (1.81–2.73) | <1 ×10⁻⁸ | CEP72 |
| 10 | rs12573019A | 0.13 | 1.74 (1.23–2.47) | 0.0019 | 2.78 (2.05–3.76) | <1 ×10⁻⁸ | 1.60 (1.34–1.90) | 1.7 ×10⁻⁷ | MYO3A |
| 10 | rs1168587T | 0.43 | 1.66 (1.19–2.31) | 0.0028 | 2.13 (1.78–2.56) | <1 ×10⁻⁸ | 1.29 (0.98–1.70) | 0.073 | |
| 16 | rs1895535A | 0.06 | 2.34 (1.38–3.97) | 0.0016 | 3.95 (2.39–6.55) | 1.0 × 10⁻⁷ | 1.69 (1.44–1.98) | <1 ×10⁻⁸ | CDH13 |
| 16 | rs7200573A | 0.29 | 0.56 (0.41–0.75) | 0.00015 | 1.37 (1.11–1.70) | 0.0034 | 2.47 (1.99–3.06) | <1 ×10⁻⁸ | CDH13 |
| 16 | rs11865624C | 0.07 | 0.50 (0.32–0.79) | 0.0031 | 1.01 (0.66–1.55) | 0.946 | 2.01 (1.71–2.37) | <1 ×10⁻⁸ | 5′ WFDC1 |
Abbreviations: NARAC, North American Rheumatoid Arthritis Consortium; RA, rheumatoid arthritis.
Using the combined data from NARAC I and NARAC II: 1647 RA cases and 2506 controls.
Minor allele frequencies (MAF) were determined using data from controls.
The test of epistasis is based on the interaction term (reported ratio of odds ratios (RORI) and 95% CI) between the dominant genetic model of PTPN22 1858T (CT/TT versus CC) and the dominant genetic model for the SNP variant.
Using RA cases and controls who carried the minor allele of the SNP variant of interest.
Using RA cases and controls who did not carry the minor allele of the SNP variant of interest.
Discussion
We investigated a role for epistasis in RA, a complex autoimmune disease, between PTPN22 and other variants across the genome using large, well-characterized study populations with detailed clinical and genetic information. A multi-stage analysis, with extension and replication, that combined robust non-parametric and parametric methods was used. We report evidence for novel epistatic interactions with PTPN22 in RA for variants within CDH13 (GeneID 1012), MYO3A (GeneID 53904), CEP72 (GeneID 55722) and near WFDC1 (GeneID 58189). Interestingly, when RA cases were compared with controls, none of the final SNP variants showed significant associations with RA (P<0.05; data not shown); that is, marginal effects in the absence of PTPN22 were not present for any SNP.
PTPN22 is the second strongest known genetic risk factor for RA, and confers risk in several other autoimmune diseases.15,16 Located on chromosome 1p13.3–13.1, PTPN22 encodes a non-receptor classical class I tyrosine protein, lymphoid tyrosine phosphatase, which negatively regulates the T-cell receptor signaling by dephosphorylating several molecules (that is Src family kinases) immediately downstream of the T-cell receptor.32,33 The 1858T risk variant replaces the amino acid at position 620 from an arginine to a tryptophan, resulting in a gain of function mutation that increases the capacity of lymphoid tyrosine phosphatase to negatively regulate T-cell receptor signaling.34 There is also evidence suggesting that the 1858T risk variant impairs B-cell receptor signaling and subsequent proliferation.35–37 Given the importance of PTPN22 in RA and autoimmunity, the current evidence for statistical interactions, which appear to modify RA risk conferred by variation within PTPN22, sheds new light on potential biological mechanisms for future genetic and molecular investigations. Indeed, epistatic relationships observed in this study may also be relevant to other autoimmune diseases.
We identified and replicated seven epistatic interactions with PTPN22 under a dominant genetic model. In this analysis CDH13, on chromosome 16, showed the strongest epistatic relationship with PTPN22 in RA. Two CDH13 SNP variants ~350 kb apart (rs7200573 and rs1895535) showed significant evidence for interaction with PTPN22. For rs7200573, ~14 kb from exon 8, PTPN22 conferred increased risk of RA in both carriers and non-carriers of rs7200573A; however PTPN22 risk was significantly (P-valueI = 0.00015) less in carriers (OR =1.37) relative to non-carriers (OR =2.47). Interestingly, rs1895535, ~22 kb from exon 5, showed the opposite association for PTPN22 and RA risk; PTPN22 risk was significantly (P-valueI = 0.0016) greater in rs1895535A carriers (OR = 3.95) relative to non-carriers (OR =1.69). This variation in association suggests that these risk variants exist on separate haplotypes; r2 between the two SNPs was <0.1. Unfortunately, SNP variants within exons 5 and 8 of CDH13 have not been identified, and in available CEPH HapMap data (http://hapmap.org), the linkage disequilibrium between the CDH13 epistatic risk variants and other SNP variants near the respective exons is also low (r2<0.1). There was also evidence supporting epistasis for an intronic MYO3A SNP variant (rs12573019), an intronic CEP72 SNP variant (rs7726839) and an SNP variant 7 kb upstream of WFDC1 (rs11865624), on chromosomes 10, 5 and 16, respectively. PTPN22-associated risk for RA was significantly increased in carriers of the MYO3A minor allele, whereas PTPN22 risk was significantly increased in non-carriers of the CEP72 and WFDC1 minor alleles. An investigation of the underlying haplotype block structure for the epistatic risk variants in CEPH suggests that the identified variants may be tagging functional variants within their respective genes. For example, the MYO3A variant, between exons 9 and 10 (~2.2 kb range), occurs within a large 150 kb haplotype block spanning 22 exons; the CEP72 risk variant, located in the first intron, exists within a 38 kb haplotype block that extends through the entire gene; and the risk variant near WFDC1 has modest linkage disequilibrium (r2 =0.2–0.3) with several SNP variants within the 5′ untranslated region and first intron of WFDC1.
Detailed functional data are not available for these epistatic candidates; however, there is sufficient evidence to suggest a plausible biological relationship between these loci and RA. For example, CDH13 (cadherin 13; T-cadherin (truncated); H-cadherin (heart)) encodes a unique cadherin lacking transmembrane and cytosolic domains necessary for homophilic adhesive activity of classical cadherins.38 T-cadherin is likely involved in signal transduction and not cell–cell adhesion, as it concentrates in lipid raft domains of the plasma membrane, affects cellular migration, angiogenesis, survival under oxidative stress and contributes to the invasive potential of various cancers.39–44 Interestingly, CDH13 has also been associated with attention-deficit/hyperactivity disorder, blood pressure and adult height.45–47
Additionally, MYO3A (myosin IIIA) encodes a unique myosin motor protein that contains an N-terminal kinase domain and is primarily expressed within the retina and inner ear of vertebrates.48 Mutations within the motor domain of MYO3A results in non-syndromic hearing loss DFNB30.49 Both sensorineural and conductive hearing loss have increased prevalence in RA patients.50–52 Furthermore, MYO3A influences sterocillia shape and length, and is capable of inducing filopodial actin protrusions in culture cells, and thus may have an unknown function in immune cell locomotion similar to MYO2A.53,54
CEP72 (centrosomal protein 72 kb) encodes a centro-mere protein that is critical for chromosomal alignment and proper tension generation between sister chromatids during mitosis.55 Interestingly, anti-centromere antibodies are primarily observed in patients with CREST syndrome, but have also been observed in other autoimmune diseases.56–59
Another candidate identified here, WFDC1 (whey acidic protein four-disulphide core domain 1), encodes ps20 and has a highly conserved core domain.60 WFDC1/ps20 is a multi-functional protein that facilitates endothelial cell motility and angiogenesis, inhibits cell proliferation and promotes cellular senescence.60–62 CD4 T cells normally express ps20 after restimulation and IL2 expansion.63 ps20 also increases CD4 T-cell permissiveness to HIV spread through CD54 integrin expression, and identifies a subset of CD4 memory T cells at an early differentiation stage (CD45RO +/CD28 +/CD57−).63 Despite the lack of detailed experimental data, there is plausible statistical and biological evidence to support further investigation of these candidates. Our results underscore important lessons derived from recent genome-wide association studies, including findings that most replicated associations do not involve previous candidate genes, suggesting new biological hypotheses, and that many have implicated non-protein coding regions.64
In this analysis, we investigated epistatic interactions with PTPN22 in RA using a multi-stage approach that combined robust non-parametric and parametric methods. There are several clear advantages to our methodology: (1) Random Forests is a model-free approach, robust to uninformative predictors and outliers and attaches a measure of importance to each predictor. The VI reported by Random Forests incorporates additional information compared to a univariate test for a predictor, as it reflects both the individual effect and the possible effect through multiplex interactions. In this analysis, we applied Random Forests to an ASP data set that was sufficiently powered to detect marginal genetic associations with OR≤0.5 and ≥2.0 for a dominant model (data not shown). (2) We used conventional logistic regression models to test for epistasis assuming multiplicative interaction, which are readily interpretable. (3) We included a replication analysis to confirm epistatic interactions. In addition, we used well-defined study populations with detailed clinical information. The principal limitation in this analysis is our interpretation of the Random Forests results in Stage I. First, there is no clear standard for identifying an important variable; we based our selection on the empirical distribution of the VI scores and subjectively determined that the there was a clear distinction in the VI for the five top-ranking predictors versus all others (see Supplementary Figure 1). Second, the VI potentially includes the effect of multiplex interactions between the predictors, as each variable selected at a node is essentially important conditional on the variable selected at the prior node; we did not explore multiplex genetic interactions in this analysis (that is three-way or other higher order interactions), which may explain why epistatic interactions were detected in four of the five important regions. Furthermore, the imposition of a dominant genetic model for epistatic candidates might not have been the appropriate assumption to follow up the Random Forests findings.
The HLA-DRB1 SE is a critical genetic component of RA in Northern European Caucasians, conferring approximately 30–50% of the genetic risk, which suggests an important role for antigen presentation and subsequent T-cell activation in RA pathogenesis; recent experimental data suggests that the SE triggers pro-oxidant signaling and an innate immune response.65–68 Given the significance of HLA-DRB1 in RA, we specifically included HLA-DRB1 and a dense set of MSMs across chromosome 6p21, which provided extensive coverage of the major histocompatibility complex region, as predictors in Stage I of the analysis. Interestingly, Random Forests did not identify any chromosome 6p21 marker, including the HLA-DRB1 locus, as an important predictor of PTPN22 carrier status in the ASP investigation in Stage I. Results did not change when SE status, specifically, was considered in ASPs (data not shown); therefore, we did not further investigate the relationship between HLA-DRB1 and PTPN22. Our results are in strong agreement with several recent studies,69–71 but in contrast with others.14,72 We do acknowledge that a large proportion of the ASPs were positive for HLA-SE. Additionally, the RA cases in Stages II and III were anti-CCP positive, the phenotypic subgroup for which the classical HLA-DRB1 association has been exclusively established.73
In summary, results from this study show the genetic contribution to RA risk is more complex than originally considered. Here, we identified novel candidate genes (CDH13, MYO3A, CEP72, WFDC1) that modify the effect of PTPN22-associated risk for RA, and provide an important framework for future studies of gene × gene interactions. Genetic studies in complex disease must include application of multi-analytical strategies. Efforts to explore higher order interactions are needed and will require very large sample sizes and clearly defined phenotypes.
Materials and methods
Informed consent was obtained from all participants and approvals from local institutional review boards were secured at each recruitment site before enrollment. All RA cases satisfied the American College of Rheumatology (ACR) 1987 classification criteria for RA.74
Study population
Stage I
A total of 292 ASPs from 512 multiplex RA families recruited by the NARAC were used as described earlier (Table 1).12 Briefly, families were eligible if ≥ two siblings satisfied the ACR 1987 criteria for RA,74 ≥ one sibling had erosions on hand radiographs and ≥ one sibling had disease onset between the ages of 18 and 60 years. Families were excluded from participation if other diseases associated with similar articular symptoms were present. Greater than 90% of RA cases were positive for the presence of anti-CCP antibody, an antibody that is highly specific to RA;75 82.1% were positive for rheumatoid factor (data not shown).
Stage II
A collective data set of 908 RA cases was used in the extension analysis, which included 464 unrelated probands from the NARAC ASP families (described above; of which 127 probands overlapped with Stage I), 168 RA cases from the National Data Bank for Rheumatic Diseases, 162 RA cases from the National Inception Cohort of Rheumatoid Arthritis and 114 RA cases from the Study of New Onset Rheumatoid Arthritis and 1260 healthy control subjects from the New York Health Project, as described earlier (Table 1).22,76–79 All RA cases were positive for the presence of anti-CCP antibody; 85.9% were positive for rheumatoid factor (data not shown). The study was then restricted to subjects with at least 90% Northern European ancestry (see Laboratory Procedures) to avoid bias because of population stratification (N =682 RA cases, 752 controls). Similarly, all RA cases in this group were positive for anti-CCP; 85.0% were positive for rheumatoid factor (data not shown). Subjects were also excluded if genotype data for SNP rs2476601 (PTPN22 1858T) was missing. The final data set for extension analysis comprised 677 RA cases and 750 healthy controls (Table 1).
Stage III
The NARAC II data set used in the replication analysis consists of 952 RA cases, which included 175 RA probands from the NARAC family studies, 332 RA cases from the Veterans Affairs Rheumatoid Arthritis Registry, 160 RA cases from the Studies of the Etiologies of Rheumatoid Arthritis cohort, 105 RA probands as members of the Multiple Autoimmune Disease Genetics Consortium, 86 RA patients from the UCSF Rheumatoid Arthritis Genetics Project and 94 RA patients from the Early Rheumatoid Arthritis Treatment Evaluation Registry and 1760 control subjects, as described earlier (Table 1).12,22,26,31,80–82 Patients for whom anti-CCP data were available were all anti-CCP positive (data was not available for 31 Veterans Affairs Rheumatoid Arthritis Registry subjects). Control data were taken from publicly available control data sets in the Illumina iControl database (Illumina, San Diego, CA, USA; http://www.illumina.com/iControlDB) and the neurodevelopmental control group obtained from the NIH Laboratory of Neurogenetics (http://neurogenetics.nia.nih.gov/paperdata/public/). The control genotypes were selected from the entire set of European American genotypes available in these resources based on the following data filters: (1) >90% complete genotyping data; (2) >90% European continental ancestry. The European continental ancestry was determined using ancestry informative markers as described earlier.83 Subjects were also excluded if genotype data for SNP rs2476601 (PTPN22 1858T) was missing. The final data set for the replication analysis comprised 947 RA cases and 1756 healthy controls (Table 1). There was no overlap between individuals in the replication data set, and those used in both Stage I and Stage II analyses.
Laboratory procedures
Stage I
RA ASPs were genotyped for PTPN22 1858T (rs2476601), the HLA-DRB1 locus and 379 MSMs from the Marshfield Set 8A Combo List (http://research.marshfieldclinic.org/genetics/GeneticResearch/screeningsets.asp) with additional MSMs in specific chromosomal regions (that is the HLA complex) as described earlier.12 The MSMs provided approximately 10 cM genome-wide coverage on average.
Stage II
The NARAC I subjects were genotyped for 545 080 SNPs at the Feinstein Institute for Medical Research. The NARAC I RA case samples and 601 control samples were genotyped with the Infinium HumanHap550 v1.0 (Illumina), 411 controls on Human-Hap550 v3.0 and 248 controls on Infinium Human-Hap300 and HumanHap240S arrays.22 Genotypes were collected for samples across the three Illumina platforms and plate membership was assessed by the top 10 principal components (EIGENSTRAT); no systematic differences were observed.22 Subjects were excluded if more than 5% of genotypes were missing, had non-European ancestry, had evidence of relatedness or had evidence of possible DNA contamination.22 Subjects were evaluated for Northern European ancestry by applying the software program STRUCTURE to an ancestry informative set of 704 SNPs.84,85
Stage III
The NARAC II subjects were genotyped using 373 400 SNPs on the Illumina HapMap370 BeadChip at the Feinstein Institute for Medical Research, as described earlier.26 Subjects with more than 5% missing genotype data or showing evidence of non-European ancestry were excluded. In addition, samples showing evidence of relatedness with other samples in the study population, or possible DNA contamination were also excluded. Of the SNP variants identified in Stage II (see Statistical analysis), a total of 219 SNP variants were imputed in the NARAC II data set using maximum likelihood imputation and applying the greedy algorithm as implemented in MACH v1.0.16.86 Five Markov Chain iterations were set to obtain map estimates, which were used as conditions for finding the most likely genotype. The NARAC I healthy controls were used as the reference population.
Statistical analysis
Stage I
A graphical summary of the analytical approach for this study, including all steps, statistical methods and significance criteria is provided in Figure 1. The first stage of analysis used Random Forests, a supervised machine learning algorithm that grows recursively partitioned trees without pruning.87 Each tree is independently grown on a bootstrapped sample of observations, and at each node in the tree, the predictor that best discriminates the outcome is selected from a random subset of predictors. Classification accuracy of the forest is assessed for observations not included in the bootstrapped sample by comparing the predicted versus the actual outcome across all trees. Finally, the value of each predictor is randomly permuted across all trees, and a single VI score for each predictor is determined by the change in classification accuracy (misclassification). The VI scores can be used to identify important predictors that most contribute to outcome classification without model specification, and are robust to uninformative predictors and outliers.
Our Random Forests analysis explored the specific hypothesis that ASPs may share other genetic regions relevant to the biological mechanism(s) through which their shared PTPN22 status confers risk for RA; therefore we used mIBD probabilities for 379 MSMs to predict PTPN22 concordance in ASPs using Random Forests v5.1 (http://www.stat.berkeley.edu/~breiman/RandomForests/cc_software.htm). ASPs were categorized as positively or negatively concordant for PTPN22 1858T carrier status (both siblings having at least one variant (N = 83 pairs), or neither sibling having a variant (N =209 pairs)). All MSMs were in Hardy–Weinberg equilibrium in unrelated individuals and had inheritance consistency within families,12 and mIBD probabilities for each MSM were generated using GENEHUNTER v2.1.88 On the basis of the distribution of the VI scores (see Supplementary Figure 1), five important (top-ranking) predictors from the Random Forests analysis were chosen for further study (Table 2).
Stage II
All SNPs within 5 Mb of an important locus were selected for investigation in the NARAC I case–control data set (N =11 207 SNPs). SNPs were excluded if they did not meet set criteria for Hardy–Weinberg equilibrium (P>1 ×10⁻⁴), genotype call rates (>90% completeness) or minor allele frequency (>0.01). A final subset of SNPs used for this stage of analysis (N =10 589 SNPs) had an average call rate of 99.2% (Table 2).
Power to detect gene × gene interactions with PTPN22 in Stage II was investigated, using dominant and recessive inheritance modes. We assumed a two-sided type 1 error of 5% (α = 0.05), and a frequency and effect estimate for PTPN22 1858T of 9.0% and OR =1.8 based on published estimates. Power to detect ratio of odds ratio (RORI) ranging from 0.1 to 3.0 was examined. Our analyses revealed that there was sufficient power (~70–99%) to detect gene × gene interactions with RORI ≤0.5 and ≥2.0 for almost all dominant models considered, and for recessive models where minor allele frequency>35% in Stage II (data not shown). Therefore, we restricted our investigation to dominant genetic models, and all analyses were performed and results interpreted in accordance with these established criteria.
Identified SNPs were evaluated for effect modification of PTPN22 risk in NARAC I cases and controls using the Breslow–Day test for homogeneity implemented in PLINK v1.06.89 Significant SNPs (P-valueBD<0.05) were selected as candidates for epistasis with PTPN22, and were formally tested for epistasis using logistic regression models in Stata v9.2 (StataCorp. LP, College Station, TX, USA). The test for epistasis was based on the coefficient of the interaction term (where P-value of the interaction term (RORI) reflects the difference in the likelihood between the full model and a reduced model containing only main effects); interactions showing a significance level P-valueI<0.05 were considered significant.
Stage III
The SNPs that provided evidence for epistatic interaction with PTPN22 in Stage II were further investigated. Power to detect gene × gene interactions between PTPN22 and each final candidate SNP was investigated for the replication (NARAC II) data set using previously defined parameters. Our analyses revealed that power was sufficient (~70–99%) in Stage III to detect gene × gene interactions with RORI ≤0.6 and ≥1.6 for almost all dominant models considered. Candidate SNPs that satisfied quality control criteria mentioned earlier were formally tested for epistasis using logistic regression models in Stata v9.2. Interactions showing a significance level P-valueI<0.05 were considered significant.
Stage IV
A combined analysis including all 1624 RA cases and 2506 control subjects gave final estimates of effect size for replicating interactions. Allelic frequencies for all SNPs pursued in the fourth stage were first tested for heterogeneity (Stata v9.2) in each case and control group separately before combining. Only those showing homogeneity across groups were included. SNP stratified analyses (minor allele carrier versus non-carrier subjects (dominant genetic model)) were used to further characterize the epistatic relationships for PTPN22 using logistic regression (Stata v9.2).
Supplementary Material
Acknowledgments
We are very grateful for the contributions made by the study participants and we thank Ben Goldstein for analytical discussions. PKG is supported by grant from the National Institute of Health (NO1-AR-2-2263) and the Eileen Ludwig Greenland Center for Rheumatoid Arthritis (RO1 AR44422). LAC is supported by the National Institute of Health (K24 AR02175). These studies were carried out in part at the General Clinical Research Center, Moffitt Hospital, University of California at San Francisco, with funds provided by the National Center for Research Resources, US Public Health Service (5 MO1 RR-00079). The UCSF Rheumatoid Arthritis Genetics Project collection was supported by the US Public Health Service (P60 AR 20684). The SERA cohort is supported by the National Institute of Health (R01 AR051394).
Footnotes
Conflict of interest
The authors declare no conflict of interest.
Supplementary Information accompanies the paper on Genes and Immunity website (http://www.nature.com/gene)
References
- 1.McCarthy MI, Abecasis GR, Cardon LR, Goldstein DB, Little J, Ioannidis JP, et al. Genome-wide association studies for complex traits: consensus, uncertainty and challenges. Nat Rev Genet. 2008;9:356–369. doi: 10.1038/nrg2344. [DOI] [PubMed] [Google Scholar]
- 2.Gregersen PK, Olsson L. Recent advances in the genetics of autoimmune disease. Annu Rev Immunol. 2009;27:363–391. doi: 10.1146/annurev.immunol.021908.132653. [DOI] [PMC free article] [PubMed] [Google Scholar]
- 3.Bell JT. A two-dimensional genome scan for rheumatoid arthritis susceptibility loci. BMC Proc. 2007;1(Suppl 1):S63. doi: 10.1186/1753-6561-1-s1-s63. [DOI] [PMC free article] [PubMed] [Google Scholar]
- 4.Mei L, Li X, Yang K, Cui J, Fang B, Guo X, et al. Evaluating gene × gene and gene × smoking interaction in rheumatoid arthritis using candidate genes in GAW15. BMC Proc. 2007;1(Suppl 1):S17. doi: 10.1186/1753-6561-1-s1-s17. [DOI] [PMC free article] [PubMed] [Google Scholar]
- 5.Glaser B, Nikolov I, Chubb D, Hamshere ML, Segurado R, Moskvina V, et al. Analyses of single marker and pairwise effects of candidate loci for rheumatoid arthritis using logistic regression and random forests. BMC Proc. 2007;1(Suppl 1):S54. doi: 10.1186/1753-6561-1-s1-s54. [DOI] [PMC free article] [PubMed] [Google Scholar]
- 6.Ma L, Dvorkin D, Garbe JR, Da Y. Genome-wide analysis of single-locus and epistasis single-nucleotide polymorphism effects on anti-cyclic citrullinated peptide as a measure of rheumatoid arthritis. BMC Proc. 2007;1(Suppl 1):S127. doi: 10.1186/1753-6561-1-s1-s127. [DOI] [PMC free article] [PubMed] [Google Scholar]
- 7.Ritchie MD, Bartlett J, Bush WS, Edwards TL, Motsinger AA, Torstenson ES. Exploring epistasis in candidate genes for rheumatoid arthritis. BMC Proc. 2007;1(Suppl 1):S70. doi: 10.1186/1753-6561-1-s1-s70. [DOI] [PMC free article] [PubMed] [Google Scholar]
- 8.Ding Y, Cong L, Ionita-Laza I, Lo SH, Zheng T. Constructing gene association networks for rheumatoid arthritis using the backward genotype-trait association (BGTA) algorithm. BMC Proc. 2007;1(Suppl 1):S13. doi: 10.1186/1753-6561-1-s1-s13. [DOI] [PMC free article] [PubMed] [Google Scholar]
- 9.Musani SK, Shriner D, Liu N, Feng R, Coffey CS, Yi N, et al. Detection of gene × gene interactions in genome-wide association studies of human population data. Hum Hered. 2007;63:67–84. doi: 10.1159/000099179. [DOI] [PubMed] [Google Scholar]
- 10.Cordell HJ. Genome-wide association studies: detecting gene-gene interactions that underlie human diseases. Nat Rev Genet. 2009;10:392–404. doi: 10.1038/nrg2579. [DOI] [PMC free article] [PubMed] [Google Scholar]
- 11.Gregersen PK, Behrens TW. Genetics of autoimmune diseases—disorders of immune homeostasis. Nat Rev Genet. 2006;7:917–928. doi: 10.1038/nrg1944. [DOI] [PubMed] [Google Scholar]
- 12.Jawaheer D, Seldin MF, Amos CI, Chen WV, Shigeta R, Etzel C, et al. Screening the genome for rheumatoid arthritis susceptibility genes: a replication study and combined analysis of 512 multicase families. Arthritis Rheum. 2003;48:906–916. doi: 10.1002/art.10989. [DOI] [PubMed] [Google Scholar]
- 13.Begovich AB, Carlton VE, Honigberg LA, Schrodi SJ, Chokkalingam AP, Alexander HC, et al. A missense single-nucleotide polymorphism in a gene encoding a protein tyrosine phosphatase (PTPN22) is associated with rheumatoid arthritis. Am J Hum Genet. 2004;75:330–337. doi: 10.1086/422827. [DOI] [PMC free article] [PubMed] [Google Scholar]
- 14.Kallberg H, Padyukov L, Plenge RM, Ronnelid J, Gregersen PK, van der Helmvan Mil AH, et al. Gene-gene and gene-environment interactions involving HLA-DRB1, PTPN22, and smoking in two subsets of rheumatoid arthritis. Am J Hum Genet. 2007;80:867–875. doi: 10.1086/516736. [DOI] [PMC free article] [PubMed] [Google Scholar]
- 15.Gregersen PK, Lee HS, Batliwalla F, Begovich AB. PTPN22: setting thresholds for autoimmunity. Semin Immunol. 2006;18:214–223. doi: 10.1016/j.smim.2006.03.009. [DOI] [PubMed] [Google Scholar]
- 16.Vang T, Miletic AV, Arimura Y, Tautz L, Rickert RC, Mustelin T. Protein tyrosine phosphatases in autoimmunity. Annu Rev Immunol. 2008;26:29–55. doi: 10.1146/annurev.immunol.26.021607.090418. [DOI] [PubMed] [Google Scholar]
- 17.Jawaheer D, Seldin MF, Amos CI, Chen WV, Shigeta R, Monteiro J, et al. A genomewide screen in multiplex rheumatoid arthritis families suggests genetic overlap with other auto-immune diseases. Am J Hum Genet. 2001;68:927–936. doi: 10.1086/319518. [DOI] [PMC free article] [PubMed] [Google Scholar]
- 18.Amos CI, Chen WV, Lee A, Li W, Kern M, Lundsten R, et al. High-density SNP analysis of 642 Caucasian families with rheumatoid arthritis identifies two new linkage regions on 11p12 and 2q33. Genes Immun. 2006;7:277–286. doi: 10.1038/sj.gene.6364295. [DOI] [PubMed] [Google Scholar]
- 19.Rodriguez MR, Nunez-Roldan A, Aguilar F, Valenzuela A, Garcia A, Gonzalez-Escribano MF. Association of the CTLA4 3′ untranslated region polymorphism with the susceptibility to rheumatoid arthritis. Hum Immunol. 2002;63:76–81. doi: 10.1016/s0198-8859(01)00358-5. [DOI] [PubMed] [Google Scholar]
- 20.Suzuki A, Yamada R, Chang X, Tokuhiro S, Sawada T, Suzuki M, et al. Functional haplotypes of PADI4, encoding citrullinating enzyme peptidylarginine deiminase 4, are associated with rheumatoid arthritis. Nat Genet. 2003;34:395–402. doi: 10.1038/ng1206. [DOI] [PubMed] [Google Scholar]
- 21.Remmers EF, Plenge RM, Lee AT, Graham RR, Hom G, Behrens TW, et al. STAT4 and the risk of rheumatoid arthritis and systemic lupus erythematosus. N Engl J Med. 2007;357:977–986. doi: 10.1056/NEJMoa073003. [DOI] [PMC free article] [PubMed] [Google Scholar]
- 22.Plenge RM, Seielstad M, Padyukov L, Lee AT, Remmers EF, Ding B, et al. TRAF1-C5 as a risk locus for rheumatoid arthritis—a genomewide study. N Engl J Med. 2007;357:1199–1209. doi: 10.1056/NEJMoa073491. [DOI] [PMC free article] [PubMed] [Google Scholar]
- 23.Thomson W, Barton A, Ke X, Eyre S, Hinks A, Bowes J, et al. Rheumatoid arthritis association at 6q23. Nat Genet. 2007;39:1431–1433. doi: 10.1038/ng.2007.32. [DOI] [PMC free article] [PubMed] [Google Scholar]
- 24.Barton A, Thomson W, Ke X, Eyre S, Hinks A, Bowes J, et al. Rheumatoid arthritis susceptibility loci at chromosomes 10p15, 12q13 and 22q13. Nat Genet. 2008;40:1156–1159. doi: 10.1038/ng.218. [DOI] [PMC free article] [PubMed] [Google Scholar]
- 25.Barton A, Thomson W, Ke X, Eyre S, Hinks A, Bowes J, et al. Re-evaluation of putative rheumatoid arthritis susceptibility genes in the post-genome wide association study era and hypothesis of a key pathway underlying susceptibility. Hum Mol Genet. 2008;17:2274–2279. doi: 10.1093/hmg/ddn128. [DOI] [PMC free article] [PubMed] [Google Scholar]
- 26.Gregersen PK, Amos CI, Lee AT, Lu Y, Remmers EF, Kastner DL, et al. REL, encoding a member of the NF-kappaB family of transcription factors, is a newly defined risk locus for rheumatoid arthritis. Nat Genet. 2009;41:820–823. doi: 10.1038/ng.395. [DOI] [PMC free article] [PubMed] [Google Scholar]
- 27.John S, Amos C, Shephard N, Chen W, Butterworth A, Etzel C, et al. Linkage analysis of rheumatoid arthritis in US and UK families reveals interactions between HLA-DRB1 and loci on chromosomes 6q and 16p. Arthritis Rheum. 2006;54:1482–1490. doi: 10.1002/art.21794. [DOI] [PubMed] [Google Scholar]
- 28.Newman WG, Zhang Q, Liu X, Walker E, Ternan H, Owen J, et al. Rheumatoid arthritis association with the FCRL3 -169C polymorphism is restricted to PTPN22 1858T-homozygous individuals in a Canadian population. Arthritis Rheum. 2006;54:3820–3827. doi: 10.1002/art.22270. [DOI] [PubMed] [Google Scholar]
- 29.Julia A, Moore J, Miquel L, Alegre C, Barcelo P, Ritchie M, et al. Identification of a two-loci epistatic interaction associated with susceptibility to rheumatoid arthritis through reverse engineering and multifactor dimensionality reduction. Genomics. 2007;90:6–13. doi: 10.1016/j.ygeno.2007.03.011. [DOI] [PubMed] [Google Scholar]
- 30.Klareskog L, Stolt P, Lundberg K, Kallberg H, Bengtsson C, Grunewald J, et al. A new model for an etiology of rheumatoid arthritis: smoking may trigger HLA-DR (shared epitope)-restricted immune reactions to autoantigens modified by citrullination. Arthritis Rheum. 2006;54:38–46. doi: 10.1002/art.21575. [DOI] [PubMed] [Google Scholar]
- 31.Criswell LA, Pfeiffer KA, Lum RF, Gonzales B, Novitzke J, Kern M, et al. Analysis of families in the multiple autoimmune disease genetics consortium (MADGC) collection: the PTPN22 620W allele associated with multiple autoimmune phenotypes. Am J Hum Genet. 2005;76:561–571. doi: 10.1086/429096. [DOI] [PMC free article] [PubMed] [Google Scholar]
- 32.Hill RJ, Zozulya S, Lu YL, Ward K, Gishizky M, Jallal B. The lymphoid protein tyrosine phosphatase Lyp interacts with the adaptor molecule Grb2 and functions as a negative regulator of T-cell activation. Exp Hematol. 2002;30:237–244. doi: 10.1016/s0301-472x(01)00794-9. [DOI] [PubMed] [Google Scholar]
- 33.Wu J, Katrekar A, Honigberg LA, Smith AM, Conn MT, Tang J, et al. Identification of substrates of human protein-tyrosine phosphatase PTPN22. J Biol Chem. 2006;281:11002–11010. doi: 10.1074/jbc.M600498200. [DOI] [PubMed] [Google Scholar]
- 34.Vang T, Congia M, Macis MD, Musumeci L, Orru V, Zavattari P, et al. Autoimmune-associated lymphoid tyrosine phosphatase is a gain-of-function variant. Nat Genet. 2005;37:1317–1319. doi: 10.1038/ng1673. [DOI] [PubMed] [Google Scholar]
- 35.Rieck M, Arechiga A, Onengut-Gumuscu S, Greenbaum C, Concannon P, Buckner JH. Genetic variation in PTPN22 corresponds to altered function of T and B lymphocytes. J Immunol. 2007;179:4704–4710. doi: 10.4049/jimmunol.179.7.4704. [DOI] [PubMed] [Google Scholar]
- 36.Arechiga AF, Habib T, He Y, Zhang X, Zhang ZY, Funk A, et al. Cutting edge: the PTPN22 allelic variant associated with autoimmunity impairs B cell signaling. J Immunol. 2009;182:3343–3347. doi: 10.4049/jimmunol.0713370. [DOI] [PMC free article] [PubMed] [Google Scholar]
- 37.Zikherman J, Hermiston M, Steiner D, Hasegawa K, Chan A, Weiss A. PTPN22 deficiency cooperates with the CD45 E613R allele to break tolerance on a non-autoimmune background. J Immunol. 2009;182:4093–4106. doi: 10.4049/jimmunol.0803317. [DOI] [PMC free article] [PubMed] [Google Scholar]
- 38.Dames SA, Bang E, Haussinger D, Ahrens T, Engel J, Grzesiek S. Insights into the low adhesive capacity of human T-cadherin from the NMR structure of Its N-terminal extra-cellular domain. J Biol Chem. 2008;283:23485–23495. doi: 10.1074/jbc.M708335200. [DOI] [PubMed] [Google Scholar]
- 39.Philippova MP, Bochkov VN, Stambolsky DV, Tkachuk VA, Resink TJ. T-cadherin and signal-transducing molecules co-localize in caveolin-rich membrane domains of vascular smooth muscle cells. FEBS Lett. 1998;429:207–210. doi: 10.1016/s0014-5793(98)00598-5. [DOI] [PubMed] [Google Scholar]
- 40.Philippova M, Ivanov D, Allenspach R, Takuwa Y, Erne P, Resink T. RhoA and Rac mediate endothelial cell polarization and detachment induced by T-cadherin. FASEB J. 2005;19:588–590. doi: 10.1096/fj.04-2430fje. [DOI] [PubMed] [Google Scholar]
- 41.Joshi MB, Philippova M, Ivanov D, Allenspach R, Erne P, Resink TJ. T-cadherin protects endothelial cells from oxidative stress-induced apoptosis. FASEB J. 2005;19:1737–1739. doi: 10.1096/fj.05-3834fje. [DOI] [PubMed] [Google Scholar]
- 42.Philippova M, Banfi A, Ivanov D, Gianni-Barrera R, Allen-spach R, Erne P, et al. Atypical GPI-anchored T-cadherin stimulates angiogenesis in vitro and in vivo. Arterioscler Thromb Vasc Biol. 2006;26:2222–2230. doi: 10.1161/01.ATV.0000238356.20565.92. [DOI] [PubMed] [Google Scholar]
- 43.Kuphal S, Martyn AC, Pedley J, Crowther LM, Bonazzi VF, Parsons PG, et al. H-cadherin expression reduces invasion of malignant melanoma. Pigment Cell Melanoma Res. 2009;22:296–306. doi: 10.1111/j.1755-148X.2009.00568.x. [DOI] [PubMed] [Google Scholar]
- 44.Adachi Y, Takeuchi T, Nagayama T, Ohtsuki Y, Furihata M. Zeb1-mediated T-cadherin repression increases the invasive potential of gallbladder cancer. FEBS Lett. 2009;583:430–436. doi: 10.1016/j.febslet.2008.12.042. [DOI] [PubMed] [Google Scholar]
- 45.Franke B, Neale BM, Faraone SV. Genome-wide association studies in ADHD. Hum Genet. 2009;126:13–50. doi: 10.1007/s00439-009-0663-4. [DOI] [PMC free article] [PubMed] [Google Scholar]
- 46.Org E, Eyheramendy S, Juhanson P, Gieger C, Lichtner P, Klopp N, et al. Genome-wide scan identifies CDH13 as a novel susceptibility locus contributing to blood pressure determination in two European populations. Hum Mol Genet. 2009;18:2288–2296. doi: 10.1093/hmg/ddp135. [DOI] [PMC free article] [PubMed] [Google Scholar]
- 47.Axenovich TI, Zorkoltseva IV, Belonogova NM, Struchalin MV, Kirichenko AV, Kayser M, et al. Linkage analysis of adult height in a large pedigree from a Dutch genetically isolated population. Hum Genet. 2009;126:457–471. doi: 10.1007/s00439-009-0686-x. [DOI] [PubMed] [Google Scholar]
- 48.Dose AC, Hillman DW, Wong C, Sohlberg L, Lin-Jones J, Burnside B. Myo3A, one of two class III myosin genes expressed in vertebrate retina, is localized to the calycal processes of rod and cone photoreceptors and is expressed in the sacculus. Mol Biol Cell. 2003;14:1058–1073. doi: 10.1091/mbc.E02-06-0317. [DOI] [PMC free article] [PubMed] [Google Scholar]
- 49.Walsh T, Walsh V, Vreugde S, Hertzano R, Shahin H, Haika S, et al. From flies’ eyes to our ears: mutations in a human class III myosin cause progressive nonsyndromic hearing loss DFNB30. Proc Natl Acad Sci USA. 2002;99:7518–7523. doi: 10.1073/pnas.102091699. [DOI] [PMC free article] [PubMed] [Google Scholar]
- 50.Elwany S, el Garf A, Kamel T. Hearing and middle ear function in rheumatoid arthritis. J Rheumatol. 1986;13:878–881. [PubMed] [Google Scholar]
- 51.Ozcan M, Karakus MF, Gunduz OH, Tuncel U, Sahin H. Hearing loss and middle ear involvement in rheumatoid arthritis. Rheumatol Int. 2002;22:16–19. doi: 10.1007/s00296-002-0185-z. [DOI] [PubMed] [Google Scholar]
- 52.Murdin L, Patel S, Walmsley J, Yeoh LH. Hearing difficulties are common in patients with rheumatoid arthritis. Clin Rheumatol. 2008;27:637–640. doi: 10.1007/s10067-007-0802-z. [DOI] [PubMed] [Google Scholar]
- 53.Schneider ME, Dose AC, Salles FT, Chang W, Erickson FL, Burnside B, et al. A new compartment at stereocilia tips defined by spatial and temporal patterns of myosin IIIa expression. J Neurosci. 2006;26:10243–10252. doi: 10.1523/JNEUROSCI.2812-06.2006. [DOI] [PMC free article] [PubMed] [Google Scholar]
- 54.Jacobelli J, Bennett FC, Pandurangi P, Tooley AJ, Krummel MF. Myosin-IIA and ICAM-1 regulate the interchange between two distinct modes of T cell migration. J Immunol. 2009;182:2041–2050. doi: 10.4049/jimmunol.0803267. [DOI] [PubMed] [Google Scholar]
- 55.Oshimori N, Li X, Ohsugi M, Yamamoto T. Cep72 regulates the localization of key centrosomal proteins and proper bipolar spindle formation. EMBO J. 2009;28:2066–2076. doi: 10.1038/emboj.2009.161. [DOI] [PMC free article] [PubMed] [Google Scholar]
- 56.Miyawaki S, Asanuma H, Nishiyama S, Yoshinaga Y. Clinical and serological heterogeneity in patients with anticentromere antibodies. J Rheumatol. 2005;32:1488–1494. [PubMed] [Google Scholar]
- 57.Walker JG, Fritzler MJ. Update on autoantibodies in systemic sclerosis. Curr Opin Rheumatol. 2007;19:580–591. doi: 10.1097/BOR.0b013e3282e7d8f9. [DOI] [PubMed] [Google Scholar]
- 58.Wu R, Shovman O, Zhang Y, Gilburd B, Zandman-Goddard G, Shoenfeld Y. Increased prevalence of anti-third generation cyclic citrullinated peptide antibodies in patients with rheumatoid arthritis and CREST syndrome. Clin Rev Allergy Immunol. 2007;32:47–56. doi: 10.1007/BF02686081. [DOI] [PubMed] [Google Scholar]
- 59.Salliot C, Gottenberg JE, Bengoufa D, Desmoulins F, Miceli-Richard C, Mariette X. Anticentromere antibodies identify patients with Sjogren’s syndrome and autoimmune overlap syndrome. J Rheumatol. 2007;34:2253–2258. [PubMed] [Google Scholar]
- 60.Larsen M, Ressler SJ, Gerdes MJ, Lu B, Byron M, Lawrence JB, et al. The WFDC1 gene encoding ps20 localizes to 16q24, a region of LOH in multiple cancers. Mamm Genome. 2000;11:767–773. doi: 10.1007/s003350010135. [DOI] [PubMed] [Google Scholar]
- 61.McAlhany SJ, Ressler SJ, Larsen M, Tuxhorn JA, Yang F, Dang TD, et al. Promotion of angiogenesis by ps20 in the differential reactive stroma prostate cancer xenograft model. Cancer Res. 2003;63:5859–5865. [PubMed] [Google Scholar]
- 62.Madar S, Brosh R, Buganim Y, Ezra O, Goldstein I, Solomon H, et al. Modulated expression of WFDC1 during carcinogenesis and cellular senescence. Carcinogenesis. 2009;30:20–27. doi: 10.1093/carcin/bgn232. [DOI] [PMC free article] [PubMed] [Google Scholar]
- 63.Alvarez R, Reading J, King DF, Hayes M, Easterbrook P, Farzaneh F, et al. WFDC1/ps20 is a novel innate immunomodulatory signature protein of human immunodeficiency virus (HIV)-permissive CD4+ CD45RO+ memory T cells that promotes infection by upregulating CD54 integrin expression and is elevated in HIV type 1 infection. J Virol. 2008;82:471–486. doi: 10.1128/JVI.00939-07. [DOI] [PMC free article] [PubMed] [Google Scholar]
- 64.Altshuler D, Daly MJ, Lander ES. Genetic mapping in human disease. Science. 2008;322:881–888. doi: 10.1126/science.1156409. [DOI] [PMC free article] [PubMed] [Google Scholar]
- 65.MacGregor AJ, Snieder H, Rigby AS, Koskenvuo M, Kaprio J, Aho K, et al. Characterizing the quantitative genetic contribution to rheumatoid arthritis using data from twins. Arthritis Rheum. 2000;43:30–37. doi: 10.1002/1529-0131(200001)43:1<30::AID-ANR5>3.0.CO;2-B. [DOI] [PubMed] [Google Scholar]
- 66.Jawaheer D, Li W, Graham RR, Chen W, Damle A, Xiao X, et al. Dissecting the genetic complexity of the association between human leukocyte antigens and rheumatoid arthritis. Am J Hum Genet. 2002;71:585–594. doi: 10.1086/342407. [DOI] [PMC free article] [PubMed] [Google Scholar]
- 67.Ling S, Li Z, Borschukova O, Xiao L, Pumpens P, Holoshitz J. The rheumatoid arthritis shared epitope increases cellular susceptibility to oxidative stress by antagonizing an adenosine-mediated anti-oxidative pathway. Arthritis Res Ther. 2007;9:R5. doi: 10.1186/ar2111. [DOI] [PMC free article] [PubMed] [Google Scholar]
- 68.Ling S, Pi X, Holoshitz J. The rheumatoid arthritis shared epitope triggers innate immune signaling via cell surface calreticulin. J Immunol. 2007;179:6359–6367. doi: 10.4049/jimmunol.179.9.6359. [DOI] [PubMed] [Google Scholar]
- 69.Lee AT, Li W, Liew A, Bombardier C, Weisman M, Massarotti EM, et al. The PTPN22 R620W polymorphism associates with RF positive rheumatoid arthritis in a dose-dependent manner but not with HLA-SE status. Genes Immun. 2005;6:129–133. doi: 10.1038/sj.gene.6364159. [DOI] [PubMed] [Google Scholar]
- 70.Harrison P, Pointon JJ, Farrar C, Brown MA, Wordsworth BP. Effects of PTPN22 C1858 T polymorphism on susceptibility and clinical characteristics of British Caucasian rheumatoid arthritis patients. Rheumatology (Oxford) 2006;45:1009–1011. doi: 10.1093/rheumatology/kei250. [DOI] [PubMed] [Google Scholar]
- 71.Costenbader KH, Chang SC, De Vivo I, Plenge R, Karlson EW. Genetic polymorphisms in PTPN22, PADI-4, and CTLA-4 and risk for rheumatoid arthritis in two longitudinal cohort studies: evidence of gene-environment interactions with heavy cigarette smoking. Arthritis Res Ther. 2008;10:R52. doi: 10.1186/ar2421. [DOI] [PMC free article] [PubMed] [Google Scholar]
- 72.Kokkonen H, Johansson M, Innala L, Jidell E, Rantapaa-Dahlqvist S. The PTPN22 1858C/T polymorphism is associated with anti-cyclic citrullinated peptide antibody-positive early rheumatoid arthritis in northern Sweden. Arthritis Res Ther. 2007;9:R56. doi: 10.1186/ar2214. [DOI] [PMC free article] [PubMed] [Google Scholar]
- 73.Ding B, Padyukov L, Lundstrom E, Seielstad M, Plenge RM, Oksenberg JR, et al. Different patterns of associations with anti-citrullinated protein antibody-positive and anti-citrullinated protein antibody-negative rheumatoid arthritis in the extended major histocompatibility complex region. Arthritis Rheum. 2009;60:30–38. doi: 10.1002/art.24135. [DOI] [PMC free article] [PubMed] [Google Scholar]
- 74.Arnett FC, Edworthy SM, Bloch DA, McShane DJ, Fries JF, Cooper NS, et al. The American Rheumatism Association 1987 revised criteria for the classification of rheumatoid arthritis. Arthritis Rheum. 1988;31:315–324. doi: 10.1002/art.1780310302. [DOI] [PubMed] [Google Scholar]
- 75.Schellekens GA, Visser H, de Jong BA, van den Hoogen FH, Hazes JM, Breedveld FC, et al. The diagnostic properties of rheumatoid arthritis antibodies recognizing a cyclic citrullinated peptide. Arthritis Rheum. 2000;43:155–163. doi: 10.1002/1529-0131(200001)43:1<155::AID-ANR20>3.0.CO;2-3. [DOI] [PubMed] [Google Scholar]
- 76.Wolfe F, Michaud K, Gefeller O, Choi HK. Predicting mortality in patients with rheumatoid arthritis. Arthritis Rheum. 2003;48:1530–1542. doi: 10.1002/art.11024. [DOI] [PubMed] [Google Scholar]
- 77.Fries JF, Wolfe F, Apple R, Erlich H, Bugawan T, Holmes T, et al. HLA-DRB1 genotype associations in 793 white patients from a rheumatoid arthritis inception cohort: frequency, severity, and treatment bias. Arthritis Rheum. 2002;46:2320–2329. doi: 10.1002/art.10485. [DOI] [PubMed] [Google Scholar]
- 78.Weisman B, Bombardier C, Massarotti E. Analysis at one year of an inception cohort of early rheumatoid arthritis: the SONORA study. Arthritis Rheum. 2003;48:S119. [Google Scholar]
- 79.Mitchell MK, Gregersen PK, Johnson S, Parsons R, Vlahov D. The New York Cancer Project: rationale, organization, design, and baseline characteristics. J Urban Health. 2004;81:301–310. doi: 10.1093/jurban/jth116. [DOI] [PMC free article] [PubMed] [Google Scholar]
- 80.Sokka T, Pincus T. An Early Rheumatoid Arthritis Treatment Evaluation Registry (ERATER) in the United States. Clin Exp Rheumatol. 2005;23(5 Suppl 39):S178–S181. [PubMed] [Google Scholar]
- 81.Mikuls TR, Kazi S, Cipher D, Hooker R, Kerr GS, Richards JS, et al. The association of race and ethnicity with disease expression in male US veterans with rheumatoid arthritis. J Rheumatol. 2007;34:1480–1484. [PubMed] [Google Scholar]
- 82.Kolfenbach JR, Deane KD, Derber LA, O’Donnell C, Weisman MH, Buckner JH, et al. A prospective approach to investigating the natural history of pre-clinical rheumatoid arthritis (RA) using first-degree relatives of probands with RA. Arthritis Care Res. 2009;61:1735–1742. doi: 10.1002/art.24833. [DOI] [PMC free article] [PubMed] [Google Scholar]
- 83.Kosoy R, Nassir R, Tian C, White PA, Butler LM, Silva G, et al. Ancestry informative marker sets for determining continental origin and admixture proportions in common populations in America. Hum Mutat. 2008;30:69–78. doi: 10.1002/humu.20822. [DOI] [PMC free article] [PubMed] [Google Scholar]
- 84.Pritchard JK, Stephens M, Rosenberg NA, Donnelly P. Association mapping in structured populations. Am J Hum Genet. 2000;67:170–181. doi: 10.1086/302959. [DOI] [PMC free article] [PubMed] [Google Scholar]
- 85.Seldin MF, Shigeta R, Villoslada P, Selmi C, Tuomilehto J, Silva G, et al. European population substructure: clustering of northern and southern populations. PLoS Genet. 2006;2:e143. doi: 10.1371/journal.pgen.0020143. [DOI] [PMC free article] [PubMed] [Google Scholar]
- 86.Li Y, Abecasis G. Mach 1.0: rapid haplotype reconstruction and missing genotype inference. Am J Hum Genet. 2006;S79:2290. [Google Scholar]
- 87.Breiman L. Random Forests. Mach Learn. 2001;45:5–32. [Google Scholar]
- 88.Markianos K, Daly MJ, Kruglyak L. Efficient multipoint linkage analysis through reduction of inheritance space. Am J Hum Genet. 2001;68:963–977. doi: 10.1086/319507. [DOI] [PMC free article] [PubMed] [Google Scholar]
- 89.Purcell S, Neale B, Todd-Brown K, Thomas L, Ferreira MA, Bender D, et al. PLINK: a tool set for whole-genome association and population-based linkage analyses. Am J Hum Genet. 2007;81:559–575. doi: 10.1086/519795. [DOI] [PMC free article] [PubMed] [Google Scholar]
Associated Data
This section collects any data citations, data availability statements, or supplementary materials included in this article.