

Abstract
Heart disease is the leading health problem of industrialized countries. The development of gene therapies tailored towards the heart has grown exponentially over the past decade. Murine models of heart diseases have played a pivotal role in testing novel cardiac gene therapy approaches. Unfortunately, the small body size and rapid heart rate of mice present a great challenge to heart function evaluation. Here we outline the commonly used cardiac phenotyping methods of treadmill exercise regimen, full 12-lead electrocardiographic assay and left ventricular catheterization hemodynamic assay. Application of these protocols will allow critical testing of gene therapy efficacy in mouse models of heart diseases.
Keywords: Heart, Electrocardiography, Treadmill, Left ventricular catheterization, Heart disease, Cardiomyopathy, PV loop, Cardiac hemodynamics
1. Introduction
Heart disease is the leading health problem of industrialized countries. Cardiomyopathy is also a common complication of muscular dystrophies (1). Increased attentiveness toward cardiac dysfunction has accelerated the design of gene therapies specifically tailored for the heart (2, 3). Mouse models play a critical role in the development of cardiac gene therapy (4, 5). However, the small size and rapid heart rate of the mouse have created a daunting challenge for evaluation of cardiac function (6).
The development of appropriate anesthetic regimens has played a pivotal role in murine heart function examination (7). Numerous anesthetics have been tested in mice with significant variations in heart rate and blood pressure (Table 1). When compared to conscious telemetry, isoflurane and a triple anesthetic regimen of morphine, etomidate, and urethane have produced the least alterations in hemodynamics (10, 16). Isoflurane is increasingly becoming the anesthetic of choice because it is readily available and easy to titrate. Further, isoflurane provides rapid induction and recovery (17).
Table 1. Effect of anesthesia on cardiovascular function in mice.
| Anesthesia/regimen | HR | MAP | SBP | References |
|---|---|---|---|---|
| Conscious telemetry | 573 ± 14a | 106 ± 5 | – | (8) |
| Conscious telemetry | 569 ± 9a | 113 ± 1 | – | (9) |
| Urethane + etomidate + morphine | 607 ± 42 | 98 ± 12 | 118 ± 14 | (10) |
| Avertin (Tribromoethanol) | 518 ± 18 | 79 ± 1 | – | (11) |
| Ketamine + xylazine | 390 ± 15 | 105 ± 5 | 115 ± 7 | (12) |
| Pentobarbital sodium | 448 ± 20 | 82 ± 3 | – | (13) |
| Isoflurane | 581 ± 23 | – | 94 ± 2 | (14) |
| Isoflurane | 580 ± 25 | 81 ± 2 | – | (15) |
HR heart rate; MAP mean arterial pressure; SBP systolic blood pressure
24 h averaged heart rate
Technological advances have revolutionized cardiac phenotyping methods (18). Traditionally, heart function is evaluated by treadmill endurance assay and echocardiography (19, 20). New apparatus and computer software have been developed to study murine cardiac electrical activity and hemodynamics by electrocardiography (ECG) and left ventricular catheterization, respectively (16, 21). Here, we provide detailed methods for evaluating mouse treadmill endurance, ECG, and closed-chest left ventricular hemodynamics.
2. Materials
2.1. Treadmill Performance Regimen
Exe-3/6 open treadmill (Columbus Instruments, Columbus, OH, USA).
Timer.
2.2. 12-Lead ECG Assay
PowerLab 4/S data acquisition system (AD Instruments, Colorado Springs, CO, USA).
Single channel Bioamplifier model ML132 with subdermal needle electrodes (AD Instruments).
ECG lead selector (AD Instruments).
Chart software v5.5.6 (or higher) with ECG extension module (AD Instruments) (see Note 1).
Isoflurane portable anesthesia system (Summit Medical Equipment, Bend, OR, USA).
Isoflurane (VetOne, Median, ID, USA).
Oxygen tank containing 100% oxygen (Airgas National, Charlotte, NC, USA).
Thermophore heating pad (Medwing, Columbia, SC, USA).
Heating lamp (Tensor Lighting Company, Boston, MA, USA).
Vicks digital thermometer (Kaz, Hudson, NY, USA).
Thermolyne 589 rectal digital pyrometer (Barnstead International, Dubuque, IA, USA).
Straight serrated fine tip forceps (World Precision Instruments, Sarasota, FL, USA).
2.3. Closed-Chest Left Ventricular Catheterization Hemodynamic Assay
Millar MPVS-400 (Millar Instruments, Houston, TX, USA).
Millar ultraminiature pressure–volume (PV) catheter model SPR-839 (Millar Instruments).
Millar cuvette block (Millar Instruments).
Chart software v5.5.6 (AD Instruments).
Isoflurane portable anesthesia system (Summit Medical Equipment).
Isoflurane (VetOne).
Oxygen tank containing 100% oxygen (Airgas National).
Thermophore heating pad (Medwing).
Heating lamp (Tensor Lighting Company).
Vicks digital thermometer (Kaz).
Thermolyne 589 rectal digital pyrometer (Barnstead International).
Hair clippers (Wahl, Sterling, IL, USA)
Stereo microscope (Nikon, Melville, NY, USA).
Minivent mouse ventilation system type 845 (Hugo Sachs Elektronik, Hugstetten, Germany).
Tracheotomy cannula, 1.3 mm outer diameter (Harvard Apparatus, Holliston, MA, USA).
Surgical instruments: microsurgical spring scissors, straight serrated fine tip forceps, Dumont type or other fine tip straight and angled forceps, Kilner curved fine sharp point scissors, hemostats (World Precision Instruments), and Guthrie double hook retractor (Fine Science Tools, Foster City, CA, USA).
Bread silk suture # 4-0 (SofSilk USSC Sutures, Norwalk, CT, USA).
25 μL 33G gas-tight Hamilton syringe and needle (Hamilton Company, Reno, NV, USA).
PE 10 polyethylene tubing (Clay Adams Division of Becton Dickinson and Company, Parsippany NJ, USA).
30% hypertonic saline (Abbott Laboratories, North Chicago, IL, USA).
0.9% isotonic saline (Abbott Laboratories).
27G ½ in. and 30G ½ in. needles (Becton-Dickinson Medical Supply, Franklin Lakes, NJ, USA).
Cotton-tipped wooden applicators (Fisher Scientific, Pittsburgh, PA, USA).
Heparin multidose vial (Baxter Healthcare Corporation, Deerfield, IL, USA).
Dobutamine (Sigma, St. Louis, MO, USA).
30G ½ cc insulin syringes (Becton-Dickinson Medical Supply).
PVAN data analysis software (Millar Instruments).
3. Methods
For all animal experiments, get approval from the Institute's Animal Care and Use Committee and follow NIH guidelines.
3.1. Treadmill Performance Regimen
Five-day training/treadmill acclimation (see Note 2). On day 1, place mouse on unmoving flat treadmill for 2 min. Place mouse on unmoving 7° inclined treadmill for 5 min (see Note 3). Next, run mouse at 5 m/min on 7° inclined treadmill for 15 min. Run mouse at 10 m/min for 5 min. On day 2, place mouse on unmoving flat treadmill for 2 min. Run mouse on 7° treadmill at 5 m/min for 5 min. Run mouse on 7° treadmill at 10 m/min for 15 min. Run mouse on 7° treadmill at 12 m/min for 5 min. On day 3, place mouse on unmoving flat treadmill for 2 min. Run mouse on 7° treadmill at 5 m/min for 5 min. Run mouse on 7° treadmill at 10 m/min for 15 min. Run mouse on 7° treadmill at 12 m/min for 10 min. On day 4, place mouse on unmoving flat treadmill for 2 min. Run mouse on 7° treadmill at 5 m/min for 5 min. Run mouse on 7° treadmill at 10 m/min for 20 min. Run mouse on 7° treadmill at 12 m/min for 5 min. Run mouse on 7° treadmill at 15 m/min for 5 min. On day 5, place mouse on unmoving flat treadmill for 2 min. Run mouse on 7° treadmill at 5 m/min for 5 min. Run mouse on 7° treadmill at 10 m/min for 20 min. Run mouse on 7° treadmill at 12 m/min for 5 min. Run mouse on 7° treadmill at 15 m/min for 5 min.
Experimental assessment of treadmill performance on day 6. Place mouse on unmoving flat treadmill for 2 min. Run mouse on 7° treadmill at 5 m/min for 5 min. Increase speed by 1 m/min every 5 min (see Note 4). The maximal running capacity for each mouse is defined as the point where the mouse stays on the shocker for 10 s without attempting to reenter the treadmill. To calculate the total running distance, multiply the time spent at each speed setting by the speed of the treadmill and then add all of these distances together.
3.2. 12-Lead ECG Assay
Mouse anesthesia. Place the mouse into a new, empty cage alone for 5 min prior to anesthetizing (see Note 5). Gently transfer the mouse into a prewarmed induction chamber and anesthetize with 3% isoflurane at an oxygen flow rate of 2 L/min for 2.5 min. Promptly remove the mouse from the induction chamber. Place the mouse onto a prewarmed recording table with snout inserted into nose cone. Provide maintenance anesthesia of 1–1.5% isoflurane at an oxygen flow rate of 0.5–0.6 l/min (see Note 6). Secure mouse limbs to the recording table using tape placed over the paws. Leave one lower limb unsecured for monitoring the depth of anesthesia with toe pinch. Lubricate the rectal temperature probe with surgical lubricant and gently insert 2–3 mm into the rectum. Maintain mouse body temperature between 37 and 38°C during the procedure.
ECG needle electrode placement. Insert the sockets of the needle electrodes onto the pins in the ECG lead selector cable. Place the needles subdermally into their corresponding positions on the mouse. To place needles, gently lift the mouse skin with serrated forceps and insert the needle into the resulting skin tent. Limb leads should be placed parallel to the limb running distal to proximal. The chest electrode should always be inserted parallel to the sternum running in the direction of the head to the toe. For the V1 position, the needle should be ∼1–2 mm to the right of the sternum. For the V2 position, the needle should be placed ∼1–2 mm to the left of the sternum. V3 should be placed ∼1–2 mm medially to the left midclavicular line. V4 should be placed at the left midclavicular line and slight further caudally. V5 should be located at the anterior axillary line slightly further caudally than V4. V6 should be placed at the midaxillary line slightly further caudally to V5.
ECG Recording. Record a 1-min-long rhythm strip from the lead II position once the mouse temperature has stabilized between 37 and 38°C. Then, sequentially record each limb lead tracing for about 15–20 s. Then, sequentially record the chest lead tracings for about 15–20 s by moving the needle electrode to each placement listed above. Finally, record a second 1-min rhythm strip from the lead II position (see Note 7).
Mouse recovery. Immediately turn the maintenance isoflurane to 0% after the last lead is recorded. Allow the mouse to breath 100% oxygen at 0.5–0.6 L/min while it awakens. Carefully remove all electrodes, the rectal probe, and tape restraints. Once the mouse is awake and able to right itself, gently return it to the empty cage. Monitor the mouse carefully for the next 15 min before returning it to the original cage (see Note 8).
ECG analysis. Merge each lead tracing into a single signal averaged ECG (SAECG) by utilizing the block averaging function. Select the Mouse preset conditions and the Mitchell definition for corrected QT interval (QTc). After software analysis, review each of the SAECG to ensure that all the markings are placed appropriately (see Note 9).
3.3. Closed-Chest Left Ventricular Catheterization Hemodynamic Assay (See Note 10)
Mouse anesthesia. Place the mouse into a new, empty cage alone for 5 min prior to anesthetizing (see Note 5) (Fig. 1). Gently transfer the mouse into a prewarmed induction chamber and anesthetize with 3% isoflurane at an oxygen flow rate of 2 L/min for 2.5 min. Promptly remove the mouse from the induction chamber. Shave the neck and chest with clippers. Place the mouse onto a prewarmed recording table with snout inserted into the nose cone (see Note 6). Provide maintenance anesthesia of 1–1.5% isoflurane at oxygen flow rate of 0.5–0.6 L/min. Secure mouse limbs to the recording table using tape placed over the paws. Leave one lower limb unsecured to allow monitoring the depth of anesthesia with toe pinch. Lubricate the rectal temperature probe with surgical lubricant and gently insert 2–3 mm into the rectum. Maintain mouse body temperature between 37 and 38°C during entire procedure.
Tracheotomy and mouse ventilation. Make a skin incision at the anterior neck and separate the parotid glands and subcutaneous tissue overlying the trachea using blunt dissection. Under a stereo microscope, expose the trachea by cutting away the cricothyroid muscles. Make an incision in the trachea just above the cricoid cartilage (swollen region just under the cricothyroid muscle) using a 20G needle bent at a 90° angle. Enlarge the incision using microsurgical spring scissors. Remove the mouse snout from the nose cone. Place a looped suture around the teeth and secure above the head to stretch the mouse neck and create traction on the trachea. Cannulate the trachea using a 1.3 mm OD tracheotomy tube. Tie a suture around the trachea and the tracheotomy tube to hold in place. Connect the anesthesia supply tube from the nose cone to the intake tubing on the mouse ventilator and set the oxygen flow rate to 0.2–0.3 L/min. Ventilate the mouse with a tidal volume of 8–10 μL/g bodyweight at a respiratory rate of ∼200 respirations per minute (22) (Fig. 2a).
Isolation of internal carotid artery. Locate the right carotid sheath running along the posteriolateral region of the right side of the trachea. Dissect away the right carotid sheath with blunt dissection. Separate the larger pulsating internal carotid artery from the internal jugular vein and vagus nerve. The vagus nerve should be carefully separated and left intact to prevent altering the autonomic innervation of the heart. Place looped sutures at the distal and proximal ends of the internal carotid artery and secure them with hemostats. Stretch and occlude the artery by pulling on the hemostats. Place a third looped suture between the outer sutures and leave it loosely tied (Fig. 2a).
Cannulation of internal carotid artery. Presoak the 1.4 F Millar PV catheter in 37°C normal saline for a few minutes. Open the Chart software to enable visualization of the pressure tracing while inserting the PV catheter. Stretch the carotid artery using the proximal and distal sutures to occlude blood flow. Grasp the end of the PV catheter with serrated straight fine-toothed forceps which have the tips covered with PE 10 tubing. Incise the carotid artery with a 27G needle which has the tip bent at a 90 angle. While holding the 27G needle in the carotid artery, give gentle upward traction on the needle to open the incision and advance the PV catheter into the carotid artery underneath the 27G needle. Gently tie the middle suture around the carotid artery and the PV catheter. Release traction on the suture occluding the proximal end of the carotid artery. Advance the catheter further into the carotid artery until the proximal suture is above the volume electrodes on the PV catheter. Tie the proximal and middle sutures around the carotid artery and the catheter. The knots should be tight enough to prevent blood from leaking around the catheter, but loose enough to allow the catheter to slide within the artery (Fig. 2b).
Advancement of the PV catheter into the left ventricle. Carefully advance the PV catheter from the carotid artery into the aorta. Use the pressure tracing from the Chart software window to guide advancement. Confirm aortic location of the PV catheter by visualizing the pressure tracing oscillating with the dichrotic notch evident. Negotiate the PV catheter through the aortic valve with gentle in and out advancement. A drop in the diastolic pressure to near zero with the systolic pressure unchanged confirms the correct placement of the PV catheter in the left ventricle. Once inside the left ventricle, adjust the depth and angle until the best change in relative volume units (RVU) is obtained (see Note 11).
Baseline data collection. After signal stabilization, record baseline PV loops at the steady state.
Locate inferior vena cava (IVC). Make a small subxiphoid incision and open up the peritoneum. Mobilize the liver away from the diaphragm by cutting the falciform ligament between the diaphragm and superior edge of the liver. Carefully spread the liver and diaphragm with a cotton-tipped applicator to visualize the IVC along the posterior abdominal wall to the right of the spinal column.
Transiently occlude the IVC. While visualizing the pressure– volume tracings in the Chart window, occlude the IVC with a cotton-tipped application for ∼2 s. The pressure and volume tracings should exhibit a uniform 20–30% decrease during the occlusion.
Intraperitoneal dobutamine injection. Prepare 1 μg/μL solution of dobutamine in normal saline. Inject 5 μg/g body weight of dobutamine via intraperitoneal injection.
Monitor dobutamine response. At 5 min postdobutamine injection, record PV loops.
Hypertonic saline calibration. Carefully expose the right external jugular vein by bluntly dissecting the surface of the right neck along the midclavicular line (Fig. 2a). Cannulate the vein with a 30G needle attached to a 25 μL Hamilton syringe with PE 10 tubing (Fig. 2b). Quickly and evenly inject 5 μL of 30% hypertonic saline into the right external jugular vein while visualizing the PV tracings in the Chart window. During injection, the pressure tracing should remain unchanged, while the volume tracing exhibits a uniform rise (Fig. 3).
Blood cuvette calibration. At the end of PV recording, remove ∼200 μL of blood from the mouse by either direct cardiac puncture or large vein sampling using a heparinized syringe. Fill each well in the Millar-supplied cuvette with heparinized blood and partially submerge the cuvette in a 37°C water bath. Place the PV catheter into each well and record the resulting RVU. Using a Microsoft Excel graph, plot the measured RVU for each well on the x-axis against the known well volumes on the y-axis (see Note 12). Determine the slope and y-intercept for the line.
After finishing these calibrations and other experimental manipulations, euthanize the mouse and save your Chart file for future analysis (see Note 13).
Determination of offset voltage (Vp). Select the region of the hypertonic saline injection beginning with the first volume loop before injection to the maximum volume achieved during saline injection (Fig. 3b). Import this data into PVAN by clicking on the heart icon in the Chart window. Click on the steady state/saline icon and enter the slope and y-intercept values determined from the blood cuvette calibration. Perform the saline calibration analysis to construct a linear regression graph (Fig. 3d). Save the Vp, offset voltage, value for use in determining the actual volume of the left ventricle.
Baseline and dobutamine stress analysis. Select the corresponding loops to be analyzed and click on the heart icon in the Chart window. Select steady state/saline icon and enter the slope, y-intercept, and Vp from cuvette calibration and offset voltage determination. Select hemodynamics to complete the data analysis and view the left ventricular functional results. These data may be exported to Microsoft excel by saving the data file.
Preload reduction IVC occlusion analysis. Select the IVC occlusion loops to be analyzed beginning with the first loop before occlusion started and ending at the point where the pressure tracing is 20–30% decreased from baseline (Fig. 4a, b). Click on the heart icon in the Chart window and select occlusion. Enter the slope, y-intercept, and offset voltage for the mouse as determined above. Click on the contractility icon to determine the end-systolic pressure volume reserve (ESPVR) and end-diastolic pressure volume reserve (EDPVR) (Fig. 4c). Determine the preload recruitable stroke work by clicking on the icon to compare the stroke work to the maximum volume (Fig. 4d).
Fig. 1.

Schematic diagram of closed-chest left ventricular catheterization. In the closed-chest approach, the PV catheter is introduced into the right internal carotid artery and advanced through the aortic valve into the left ventricle. The right external jugular vein is cannulated to allow delivery of fluids and hypertonic saline for volume calibration.
Fig. 2.

Surgical isolation of trachea, carotid artery, and external jugular vein during left ventricular catheterization assay. (a) A photograph of the mouse neck under a stereoscopic dissection microscope following internal carotid artery isolation. Arrowhead, the internal carotid artery; arrow, the external jugular vein; asterisk, trachea. (b) A photograph of the mouse neck under a stereoscopic dissection microscope after PV catheter insertion and external jugular vein cannulation. Arrowhead, the PV catheter in the internal carotid artery; arrow, the 30G needle cannulating the external jugular vein; asterisk, trachea.
Fig. 3.
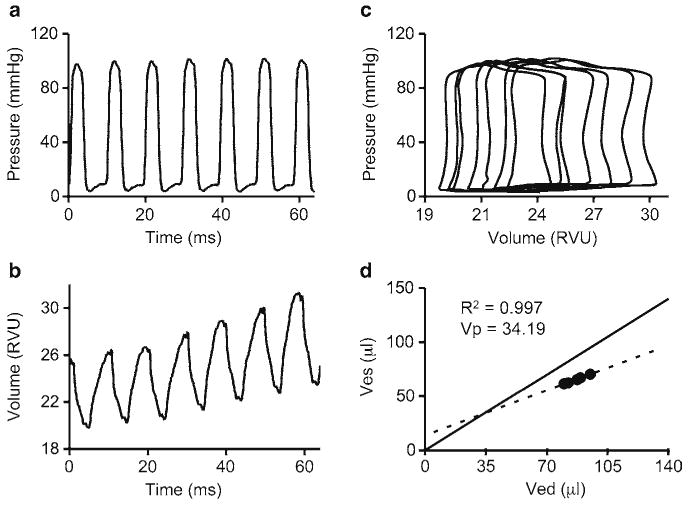
A representative example of hypertonic saline calibration during left ventricular catheterization. (a) Pressure tracing during hypertonic saline calibration. (b) Volume tracing during hypertonic saline calibration. (c) PV loops from hypertonic saline calibration. RVU relative volume units. (d) Linear regression graph for determination of the offset voltage. In this particular example, Ves=0.59 × Ved+13.90. Ved end-diastolic volume; Ves end-systolic volume; V p offset voltage.
Fig. 4.

A representative example of preload reduction via IVC occlusion during left ventricular catheterization. (a) Pressure tracing during IVC occlusion. (b) Volume tracing during IVC occlusion. (c) PV loops from IVC occlusion. The top dotted line can be used to determine ESPVR: Pes. In this example, ESPVR: Pes=4.18 × Ves+11.95. The bottom dotted line can be used to determine EDPVR: Ped. In this example, EDPVR: Ped=0.26 × Ved+2.23. EDPVR end-diastolic pressure volume reserve; ESPVR end-systolic pressure volume reserve; Ped end-diastolic pressure; Pes end-systolic pressure; Ved end-diastolic volume; Ves end-systolic volume. (d) Preload recruitable stroke work (SW) graph from IVC occlusion. In this example, SW=89.63 × Ved−5.90. Vmax, maximum volume.
Acknowledgments
This work is supported by grants from the National Institutes of Health HL-91883 and the Muscular Dystrophy Association (DD). We thank Mr. Nate Marschalk and Dr. Dejia Li for helpful discussion on treadmill function assay.
Footnotes
Chart software version 5 requires a PC capable of running Windows 2000 or higher or Mac running Mac OS × 10.1 or higher. Chart software versions 6 and 7 require either Windows XP SP2 or Mac OS × 10.4 or higher.
Treadmill endurance testing requires 6 consecutive days of treadmill running. Prior to the experimental testing of cardiovascular treadmill endurance on day 6, mice must be subjected to 5 days of increasing treadmill exposure to train them for treadmill running.
To make a positive 7° inclined treadmill, set the crank at zero and place the incline rod into the hole on the distal end of the treadmill. Then, insert the pin into the first hole on the rod with the treadmill raised above the hole and lower the treadmill onto the pin.
A ruler or other flat instrument may be used to help mouse stay in the proper orientation on the running lanes and help mouse off the shocking grid. A more demanding protocol can be used for young adult mice (16).
Moving the mouse to a new empty cage prior to study ensures an equal activity level for all mice prior to study.
Mouse heart rate is strongly dependent on temperature and the mouse should be kept warm during all phases of the procedure. Induction chamber and operating tables should be monitored with a thermometer to ensure the temperature is kept between 36 and 38°C.
While switching between different leads, the recording of the ECG tracing should be switched to the monitoring mode. This will aid in differentiating between different leads during analysis and remove any noise from the tracings during switching. Certain heating pads may cause electrical interference during recording and should be switched off during recording.
Mice with muscle disease require extra care during anesthesia because of poor respiratory function. Isoflurane should be carefully titrated to prevent respiratory depression and maintain a respiratory rate above 80 per minute.
To thoroughly evaluate heart electrical activity, we recommend performing 12-lead ECG assay. Depending on the model used, one may notice abnormal changes in certain leads only. In the case of mdx mouse model of Duchenne muscular dystrophy, most of the characteristic changes are found in lead II except for the Q amp. We usually get Q amp data from lead I recording (16, 23). For additional information on ECG tracing analysis, please refer to AD Instrument's ECG Analysis Guide.
The left ventricular catheterization of mice has been described using both a closed-chest internal carotid approach and an open-chest apical stab approach (23, 24). We describe the closed-chest approach. This approach yields more physiologic hemodynamics than the open-chest approach (25). Further, the closed-chest approach can be performed without ventilation. However, if you are working with mouse models of muscular dystrophy, we recommend utilization of a ventilator during left ventricular hemodynamic study because respiratory function is often impaired in these models.
Negotiation of the PV catheter into the left ventricle requires gentle in and out movement of the catheter especially when negotiating the aortic valve. Ideal placement of the PV catheter in the left ventricle may require adjusting the angle and rotation of the catheter.
Included with the Millar cuvette are the known volumes for each well to be used for extrapolating the left ventricular volume from the RVUs.
PV loop analysis is best performed off-line once the experiment has been completed.
References
- 1.McNally EM, MacLeod H. Therapy Insight: cardiovascular complications associated with muscular dystrophies. Nat Clin Pract Cardiovasc Med. 2005;2:301–308. doi: 10.1038/ncpcardio0213. [DOI] [PubMed] [Google Scholar]
- 2.Yue Y, Li Z, Harper SQ, Davisson RL, Chamberlain JS, Duan D. Microdystrophin gene therapy of cardiomyopathy restores dystrophin-glycoprotein complex and improves sarcolemma integrity in the Mdx mouse heart. Circulation. 2003;108:1626–1632. doi: 10.1161/01.CIR.0000089371.11664.27. [DOI] [PMC free article] [PubMed] [Google Scholar]
- 3.Li J, Wang D, Qian S, Chen Z, Zhu T, Xiao X. Efficient and long-term intracardiac gene transfer in [delta]-sarcoglycan-deficiency hamster by adeno-associated virus-2 vectors. Gene Ther. 2003;10:1807–1813. doi: 10.1038/sj.gt.3302078. [DOI] [PubMed] [Google Scholar]
- 4.Duan D. Challenges and opportunities in dystrophin-deficient cardiomyopathy gene therapy. Hum Mol Genet. 2006;15:R253–R261. doi: 10.1093/hmg/ddl180. [DOI] [PMC free article] [PubMed] [Google Scholar]
- 5.Allamand V, Campbell KP. Animal models for muscular dystrophy: valuable tools for the development of therapies. Hum Mol Genet. 2000;9:2459–2467. doi: 10.1093/hmg/9.16.2459. [DOI] [PubMed] [Google Scholar]
- 6.Kass DA, Hare JM, Georgakopoulos D. Murine cardiac function : a cautionary tail. Circ Res. 1998;82:519–522. doi: 10.1161/01.res.82.4.519. [DOI] [PubMed] [Google Scholar]
- 7.Janssen BJA, De Celle T, Debets JJM, Brouns AE, Callahan MF, Smith TL. Effects of anesthetics on systemic hemodynamics in mice. Am J Physiol Heart Circ Physiol. 2004;287:H1618–H1624. doi: 10.1152/ajpheart.01192.2003. [DOI] [PubMed] [Google Scholar]
- 8.Butz GM, Davisson RL. Long-term telemetric measurement of cardiovascular parameters in awake mice: a physiological genomics tool. Physiol Genomics. 2001;5:89–97. doi: 10.1152/physiolgenomics.2001.5.2.89. [DOI] [PubMed] [Google Scholar]
- 9.Carlson SH, Wyss JM. Long-term telemetric recording of arterial pressure and heart rate in mice fed basal and high NaCl diets. Hypertension. 2000;35:E1–E5. doi: 10.1161/01.hyp.35.2.e1. [DOI] [PubMed] [Google Scholar]
- 10.Segers P, Georgakopoulos D, Afanasyeva M, Champion HC, Judge DP, Millar HD, et al. Conductance catheter-based assessment of arterial input impedance, arterial function, and ventricular-vascular interaction in mice. Am J Physiol Heart Circ Physiol. 2005;288:H1157–H1164. doi: 10.1152/ajpheart.00414.2004. [DOI] [PubMed] [Google Scholar]
- 11.Lin M, Liu R, Gozal D, Wead WB, Chapleau MW, Wurster R, et al. Chronic intermittent hypoxia impairs barore-flex control of heart rate but enhances heart rate responses to vagal efferent stimulation in anesthetized mice. Am J Physiol Heart Circ Physiol. 2007;293:H997–H1006. doi: 10.1152/ajpheart.01124.2006. [DOI] [PubMed] [Google Scholar]
- 12.Pacher P, Liaudet L, Bai P, Mabley JG, Kaminski PM, Virag L, et al. Potent metalloporphyrin peroxynitrite decomposition catalyst protects against the development of doxorubicin-induced cardiac dysfunction. Circulation. 2003;107:896–904. doi: 10.1161/01.cir.0000048192.52098.dd. [DOI] [PubMed] [Google Scholar]
- 13.Pacher P, Batkai S, Kunos G. Haemodynamic profile and responsiveness to anandamide of TRPV1 receptor knock-out mice. J Physiol. 2004;558:647–657. doi: 10.1113/jphysiol.2004.064824. [DOI] [PMC free article] [PubMed] [Google Scholar]
- 14.Shioura KM, Geenen DL, Goldspink PH. Sex-related changes in cardiac function following myocardial infarction in mice. Am J Physiol Regul Integr Comp Physiol. 2008;295:R528–534. doi: 10.1152/ajpregu.90342.2008. [DOI] [PMC free article] [PubMed] [Google Scholar]
- 15.Zuurbier CJ, Emons VM, Ince C. Hemodynamics of anesthetized ventilated mouse models: aspects of anesthetics, fluid support, and strain. Am J Physiol Heart Circ Physiol. 2002;282:H2099–H2105. doi: 10.1152/ajpheart.01002.2001. [DOI] [PubMed] [Google Scholar]
- 16.Bostick B, Yue Y, Long C, Marschalk N, Fine DM, Chen J, et al. Cardiac expression of a mini-dystrophin that normalizes skeletal muscle force only partially restores heart function in aged Mdx mice. Mol Ther. 2009;17:253–261. doi: 10.1038/mt.2008.264. [DOI] [PMC free article] [PubMed] [Google Scholar]
- 17.Pacher P, Nagayama T, Mukhopadhyay P, Batkai S, Kass DA. Measurement of cardiac function using pressure-volume conductance catheter technique in mice and rats. Nat Protocols. 2008;3:1422–1434. doi: 10.1038/nprot.2008.138. [DOI] [PMC free article] [PubMed] [Google Scholar]
- 18.Hoit BD. Murine physiology: measuring the phenotype. J Mol Cell Cardiol. 2004;37:377–387. doi: 10.1016/j.yjmcc.2004.04.005. [DOI] [PubMed] [Google Scholar]
- 19.Fewell JG, Osinska H, Klevitsky R, Ng W, Sfyris G, Bahrehmand F, et al. A treadmill exercise regimen for identifying cardiovascular phenotypes in transgenic mice. Am J Physiol Heart Circ Physiol. 1997;273:H1595–H1605. doi: 10.1152/ajpheart.1997.273.3.H1595. [DOI] [PubMed] [Google Scholar]
- 20.Lerman I, Harrison BC, Freeman K, Hewett TE, Allen DL, Robbins J, et al. Genetic variability in forced and voluntary endurance exercise performance in seven inbred mouse strains. J Appl Physiol. 2002;92:2245–2255. doi: 10.1152/japplphysiol.01045.2001. [DOI] [PubMed] [Google Scholar]
- 21.Branco D, Wolf C, Sherwood M, Hammer P, Kang P, Berul C. Cardiac electrophysiological characteristics of the mdx 5cv mouse model of Duchenne muscular dystrophy. J Interv Card Electr. 2007;20:1–7. doi: 10.1007/s10840-007-9168-z. [DOI] [PubMed] [Google Scholar]
- 22.Schwarte LA, Zuurbier CJ, Ince C. Mechanical ventilation of mice. Basic Res Cardiol. 2000;95:510–520. doi: 10.1007/s003950070029. [DOI] [PMC free article] [PubMed] [Google Scholar]
- 23.Bostick B, Yue Y, Long C, Duan D. Prevention of dystrophin-deficient cardiomyopathy in twenty-one-month-old carrier mice by mosaic dystrophin expression or complementary dystrophin/utrophin expression. Circ Res. 2008;102:121–130. doi: 10.1161/CIRCRESAHA.107.162982. [DOI] [PubMed] [Google Scholar]
- 24.Georgakopoulos D, Mitzner WA, Chen CH, Byrne BJ, Millar HD, Hare JM, et al. In vivo murine left ventricular pressure-volume relations by miniaturized conductance micromanometry. Am J Physiol Heart Circ Physiol. 1998;274:H1416–1422. doi: 10.1152/ajpheart.1998.274.4.H1416. [DOI] [PubMed] [Google Scholar]
- 25.Hoit BD, Ball N, Walsh RA. Invasive hemodynamics and force-frequency relationships in open- versus closed-chest mice. Am J Physiol Heart Circ Physiol. 1997;273:H2528–H2533. doi: 10.1152/ajpheart.1997.273.5.H2528. [DOI] [PubMed] [Google Scholar]