

Abstract
We demonstrate a high performance microfabricated FACS system with highly integrated microfluidics, optics, acoustics, and electronics. Single cell manipulation at a high speed is made possible by the fast response time (~0.1 ms) of the integrated PZT actuator and the nozzle structure at the sorting junction. A Teflon AF-coated optofluidic waveguide along the microfluidic channel guides the illumination light, enabling multi-spot detection, while a novel space-time coding technology enhances the detection sensitivity of the μFACS system. The real-time control loop system is implemented using a field-programmable-gate-array (FPGA) for automated and accurate sorting. The μFACS achieves a high purification enrichment factor: up to ~230 fold for both polystyrene microbeads and suspended human mammalian cells (K562) at a high throughput (>1000 cells s−1). The sorting mechanism is independent of cell properties such as size, density, and shape, thus the presented system can be applied to sort out any pure sub-populations. This new lab-on-a-chip FACS system, therefore, holds promise to revolutionize microfluidic cytometers to meet cost, size, and performance goals.
1. Introduction
The flow cytometer is an essential bio-analysis tool for characterizing the physical and biochemical properties of biological samples (such as cells) in a highly quantitative manner by optically interrogating cells of interest suspended in fluid.1 Besides its application in basic biomedical research, the technology has become an important diagnostic tool to monitor the progression of hematological diseases (e.g. leukemia).2 One specific type of flow cytometer, referred to as a fluorescence-activated cell sorter (FACS), has become essential as biomedical researchers and clinicians become more and more interested in purifying and analyzing rare cells such as stem cells,3,4 circulating tumor cells,5 and rare bacteria species that mostly cannot be cultured in bio-laboratories.6 FACS performs single-cell level separations in accordance with the acquired data from optical interrogation, thus enriching the purity of biospecimens.
Commercial benchtop FACS systems, however, are still bulky and costly, so they are mostly located in centralized facilities shared by many researchers. Joint ownership by various bio-research or clinical laboratories reduces availability and ease of use. Traditional systems are often open, thus infectious samples need to be treated with extreme caution, because droplet-based sorting mechanisms generate biohazardous aerosols.7 Contamination of the environment and the sample becomes a major issue for such FACS. Moreover, they require a relatively large volume of sample and reagent for analysis, further increasing the total cost and making some applications difficult or impossible. All of these factors limit the full utilization of the FACS system in various biomedical research and clinical applications despite its utility and powerful capabilities for many applications.
In order to overcome those limitations, alternative microfluidic lab-on-a-chip platforms have been studied by many researchers over the last decade.8 The lab-on-a-chip platform makes possible inexpensive, disposable, and portable devices in which many aspects, such as optics or acoustics, are highly integrated on a single chip to work synergistically. The closed, small-volume platforms would allow safe handling of rare (i.e. precious) cells and infectious biospecimens to be safe from potential cross-contamination or cell loss. Moreover, a lab-on-a-chip platform has rapid analysis time with reduced sample/reagent usage, lowering the cost and making such devices attractive for point-of-care applications.9
Significant progress has been made towards developing microfabricated FACS (μFACS). Numerous microfluidic cell sorting devices have been explored based on various principles, including dielectrophoresis,10 magnetophoresis,11 optical gradient forces,12 and hydrodynamic flow switching,13,14 among others. Of those mechanisms, however, few approaches have been proven to meet the requirements for real-life biological or clinical applications, namely (1) high throughput, (2) adequate detection sensitivity, and (3) acceptable sorting accuracy. The high screening throughput (about 1000 cells s−1 or even higher) is required as screening of a large number of cells (more than 1 million cells) is essential in order to identify rare cells (less than 0.01%) in a population or to extract meaningful clinical data out of a small volume of samples for real applications. Many μFACS systems suffer from low throughput (lower than 100 cells s−1) due to the lack of a fast actuation mechanism or a high speed real-time control system.12,13 High detection sensitivity is an essential feature to detect low intensity fluorescence signals from small biomolecules, such as bacteria, and to clearly identify samples of interest. High signal-to-noise ratios allow for simpler and more accurate threshold determination for driving the on-chip piezoelectric actuator, and prevent false/inaccurate sorting, thus enhancing sorting purity. An automated control system is critical to accurate sorting for creating an enriched sample of biospecimens of interest.
In this work, we demonstrate a μFACS system with several unique technical merits, including:
High throughput (>1000 cells s−1)
Single cell manipulation capabilities
Low voltage (10 V p-p), low power (~1 mW) cell sorting
Sorting performance independent of cell’s properties
High sensitivity through real-time signal amplification
High speed real-time electronic control system
The device operates by integrating microfluidics, optics, and acoustics in conjunction with an innovative space-time coding technology and a real-time control system. The universal μFACS can separate any targeted biological samples flowing through the channel regardless of their physical or chemical properties such as size, shape, or dielectric properties. The integrated piezoelectric lead-zirconate-titanate (PZT) actuator hydrodynamically manipulates sub-nanolitre volumes of fluid in which a single cell is suspended. The integrated PZT actuator has a much faster response time (~0.1 ms) than any off-chip control valve.13,14 Such a fast response time minimizes the flow disturbance after isolating targeted cells, allowing single cell manipulation. Besides its fast response time, the PZT actuator is mounted directly on the fluidic chamber, enabling low power (<1 mW) and low voltage (<10 V peak-to-peak) operation. This integration helps make the sorting system portable, cost-efficient, and disposable for applications like point-of-care diagnostics.
The detection sensitivity of the system is enhanced by the space-time coding technology to be elucidated in section 2.5. The technique of space-time coding requires the following hardware and software components: (1) Teflon AF coated optofluidic waveguides, (2) a finite-impulse-response (FIR) matched filter algorithm, and (3) specially designed spatial filters that modulate the input fluorescent signals of the biological samples. The optofluidic waveguide created by coating amorphous Teflon to the channel wall confines light to the microfluidic channels that contain the samples. Since the excitation laser light and the cells have the same path of travel, the design produces high excitation efficiency, and most important of all, supports optical detection at multiple locations without suffering from power splitting loss. Multi-point detection of the same cell is key to the space-time coding technology. Spatial filters with specifically designed slits modulate the emitted fluorescent signals before they reach the detector, and an FIR matched filter algorithm selectively amplifies only the signals while suppressing system noise, thus enhancing the signal-to-noise ratio.
An embedded, closed-loop field-programmable-gate-array (FPGA) control system was developed in order to control the sorting in a real-time, automated fashion. The real-time operating system detects incoming signals, makes a sorting decision, and triggers the PZT actuator at the proper time with a timing jitter under 10 μs. This precise timing control avoids sample loss (i.e. missing rare cells) and sorting mistakes (i.e. accidentally sort the non-targeted cells), resulting in high purity enrichment.
We successfully sorted fluorescent 10 μm polystyrene beads out of a mixed solution of fluorescent 10 μm beads and non-fluorescent 5 μm beads with an initial mixture ratio of ~1 : 150. Fluorescent 10 μm beads (i.e. the samples of interest) were purified with an enrichment factor of nearly 200-fold at a high throughput of ~1500 beads s−1. Using the same system, human erythroleukemic cells were purified with an enrichment factor of 230-fold at a high throughput of about 1000 cells s−1.
2. Materials and methods
2.1 Piezoelectric cell sorting mechanism
The polydimethylsiloxane (PDMS) based μFACS device has a 250 μm wide main microfluidic channel followed by a sorting junction (100 μm long) and three sorting channels (80 μm wide each) as shown in Fig. 1(a).
Fig. 1.
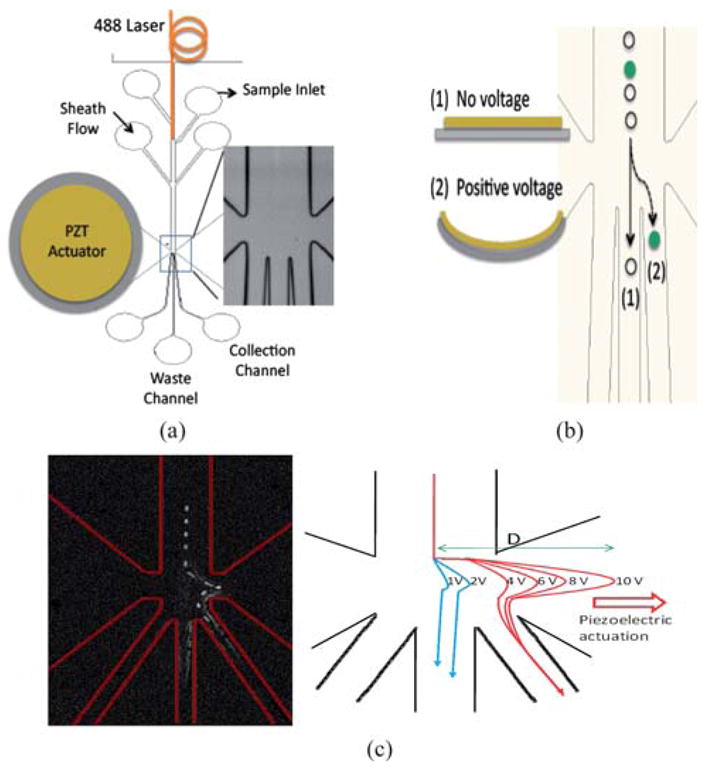
(a) Device structure. The 250 μm wide main fluidic channel is split into three sub-channels. The center channel is for collecting waste, while the left and the right channels are for collecting samples. The illumination light (488 nm laser) is delivered to the device by the optical fiber and guided by the Teflon AF coated optofluidic waveguide. The PZT actuator is integrated on the device. In the square is the sorting junction of the device made of PDMS. (b) As the PZT actuator bends down, the cell of interest is pushed to the right sorting channel, while the non-targeted cell travels directly to the center waste channel without triggering the PZT. (c) Flow pattern observation. Left: Trace of a fluorescent bead sorted to the right channel by superimposing photos taken every 0.3 ms using a high-speed CMOS camera. Right: The bead trajectory plot for the bead under different voltage magnitudes to the PZT actuator. This helps set the threshold voltage for sufficient deflection.
The center channel is for collecting unwanted cells and the left and the right channels are for collecting the targeted cells. The integrated piezoelectric actuator on the sorting chamber has a lead-zirconate-titanate (PZT)-stainless steel bimorphous structure, and it bends upward or downward according to the polarity of the applied voltage. If no cell of interest is registered, the PZT does not bend, and cells pass through the center waste channel (Fig. 1(b)). When the fluorescent light from target cells is registered by the upstream photodetector, the integrated piezoelectric actuator bends according to the voltage pulse applied by the real-time control system and deflects the fluid stream to one of the sorting channels as shown in Fig. 1(c). The exact volume of fluid displacement by the PZT actuator can be precisely controlled by the amplitude of the applied voltage. The bending of the PZT actuator induces a transverse displacement of fluid, typically on the order of sub-nanolitres per each stroke, in less than 0.1 ms. Such a fast actuation speed minimizes the fluid disturbance after firing so that the sorting system exhibits single cell manipulation capabilities with a high throughput.
2.2 Teflon AF coated optofluidic waveguide
The novel light guiding architecture, where the excitation laser light shares the same physical path with the analytes in the fluidic channel, is created by coating amorphous Teflon (Teflon AF 1600; Dupont, USA) onto the microfluidic wall.15 Teflon AF is a fluoropolymer with a refractive index (n = 1.31) lower than that of water (1.33). While most fluoropolymers are opaque or translucent, Teflon AF is optically transparent to UV and visible light.16 Teflon AF is soluble to specific fluoroinert solvents (FC-75; 3M, USA), and a thin film can be formed by spin-coating, spraying or dipping processes. The Teflon AF coating layer forms the low refractive index cladding layer of the optofluidic waveguide, while the aqueous solution inside forms the sample-carrying waveguide core. The 488 nm wavelength laser excitation light (40 mW) is delivered through bare optical fiber (50/125; Thorlabs, USA) inserted into the microfluidic channel as shown in Fig. 1 and 2. The confinement of the light to the microfluidic channel carrying the samples increases the light intensity impinging on the cell and, at the same time, keeps the light intensity low enough to avoid photo bleaching. Light is guided inside the fluidic channel even after the channel is split into three sorting channels after the sorting junction.17 This waveguide architecture greatly simplifies light routing while minimizing propagation losses and enabling multi-point fluorescence detection.
Fig. 2.
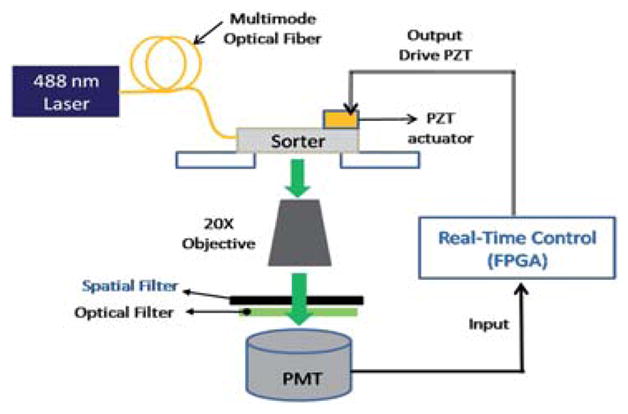
Schematic of the optical detection and control/sorting system setup. Specially designed spatial filters (masks) are placed at the image plane to modulate incoming fluorescence signals before those signals are registered by the PMT.
Besides its light guiding capability, the Teflon AF coated optofluidic waveguide also prevents cells from sticking to the channel walls, which would cause clogging of the fluidic channel, because Teflon AF has low surface energy like other Teflon materials. With reduced clogging, the system can run for a long period of time, allowing the sorting of very rare samples. For instance, in the mammalian cell sorting experiment, the μFACS system ran longer than 2 h under high throughput (>1000 cells s−1) without significant cell clogging issues. It demonstrates that the system can monitor more than a few million cells per hour for rare events.
2.3 Design and fabrication of the μFACS chip
The μFACS device is fabricated using the widely used poly-dimethylsiloxane (PDMS) replica molding technique. The high aspect ratio of the channel (>1 : 10) at the sorting region requires a robust and very vertical mold structure. To meet these requirements, the Si mold masters are fabricated by the cryogenic reactive ion etching (RIE) process.18 Microfluidic channels and chambers are photolithographically defined using S-1805 positive photoresist (Shipley, USA), and then a 50 nm layer of nickel is evaporated onto the Si to serve as an etch mask during the following dry-etching process. The Si mold master (~100 μm deep) is etched at cryogenic temperatures (<−115 °C) using ICP-assisted reactive ion etching (ICP RIE; Plasmalab 100, Oxford Instruments). A plasma ignited from a mixture of O2 and SF6 gases at 12 mTorr performs the etching and sidewall passivation, resulting in smooth and vertical channel walls.19 Etching rates are usually on the order of 90 μm h−1. After the RIE process, the nickel mask is removed with nickel etchant. The Si mold master is silanized by vapor deposition of tri-chlorosilane (TCI Inc, USA) to facilitate PDMS demolding. PDMS (Sylgard 184; Dow Corning, USA) mixed in the standard 10 : 1 ratio of base to curing agent is cast onto the mold master, degassed and cured thermally at 65 °C for 4 h. After demolding the patterned PDMS, holes for tubing connections and the actuation chamber are punched using various sized biopsy punches. The patterned PDMS substrate and another plain PDMS substrate are surface-activated by UV-Ozone treatment (JeLight, USA) for permanent bonding. The two PDMS device portions are then bonded covalently together to form closed microfluidic channels.
To achieve a uniform coating layer, a 6% Teflon AF solution (Teflon AF 1600; DuPont Corp, USA) is first diluted to 2% using a fluoroinert solvent (FC-75; 3M, USA) and then injected into the microfluidic channels from the inlet while the channel outlets are exposed to a slight negative pressure (P = −10 kPa) for 20 min. The balance between the vacuum pressure and the adhesion of Teflon AF solution to the PDMS channel surface determines the thickness of the Teflon AF cladding layer. The device is then heated to 155 °C for 20 min to evaporate the fluoroinert solvent, leaving Teflon AF layer behind. A final heating of 15 °C above the glass transition temperature of Teflon AF (i.e. 160 °C) produces a smooth, optical quality Teflon AF layer.15
The stainless steel side of the PZT actuator is polished with 1 μm alumina particles (Buehler inc., USA) until a mirror-like surface is obtained. After polishing, the surface is cleaned and then UV-Ozone treated to facilitate direct bonding to a chamber of the PDMS device. The bonding process of stainless steel surface and PDMS is completed after 4 h in an 85 °C oven. The strong bond between the polished stainless steel and PDMS chamber keeps fluid from leaking even under the relatively high flow velocity (e.g. 10 cm s−1), and it guarantees excellent actuation power coupling between the actuator and the fluid.
As a final step of device fabrication, multimode bare optical fiber (SMF125; Thorlabs Inc., USA) is cleaved and inserted into the channel to deliver the excitation light to the optofluidic waveguide.
2.4. Sample preparation
To characterize the performance of the integrated μFACS, 10 μm fluorescent polystyrene beads (Bangs Laboratory Inc., USA) are mixed with non-fluorescent 5 μm beads at an initial mixture ratio of 0.0067 (as determined by a commercial FACS machine –FACScan; BD, USA) and a concentration of 1 × 10⁷ beads ml−1.
To validate the sorting capability for biological applications, a mixture of stained and non-stained K562 cells (human erythroleukemic cell line) was used. The fluorescent cells were prepared by incubation in 2 μM carboxyfluorescein diacetate succinimidyl ester (CFSE) in PBS/BSA at 37 °C for 15 min. After washing, the cells were incubated at 37 °C for another 15 min. Following a second washing step, the stained cells are mixed with non-stained cells at an initial mixture of 0.0081 (determined by the commercial FACS) and a concentration of ~1.1 × 10⁷ cells ml−1. Before introduction to the μFACS device, the cells are filtered through a 40-μm cell strainer (BD Bioscience, USA) to remove large cell clumps. FACS fluid (BD Bioscience, USA) was used as sheath fluid for both aforementioned samples.
2.5 Automated sorting control system and signal processing
In order to achieve high throughput and high sample enrichment, the sort decision needs to be made with precise timing and at a high speed. High detection sensitivity is key to the success in sorting target cells and decreasing the chance of false sorting. We have developed a high-sensitivity automated sorting system by employing the techniques of integrated optics, new device architecture, and signal processing. In particular, the novel fluorescence-detection strategy referred to as ‘space-time coding technology’ is invented, as illustrated in Fig. 2 and 3.
Fig. 3.
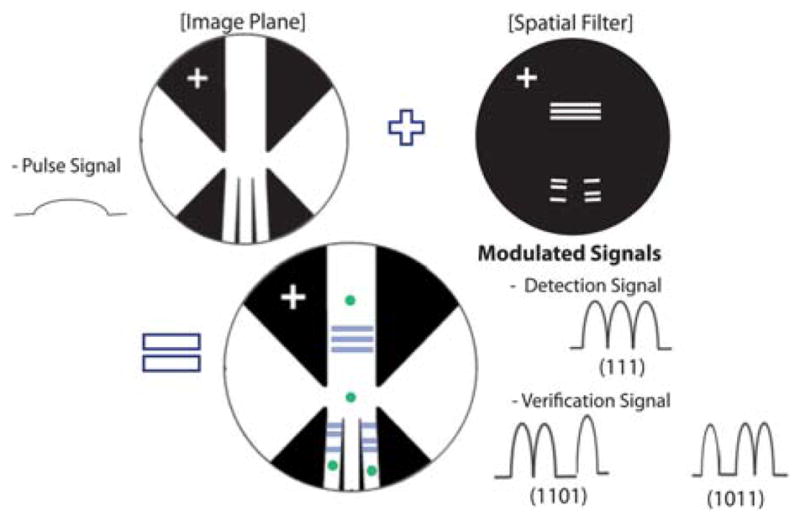
Spatial filters (masks) are specially designed and placed at the magnified image of the device feature. The input fluorescence pulse signal from stained cells is modulated by different spatial filters before being registered by the PMT, yielding different waveforms of photocurrents in time domain, corresponding to different locations of the cells as they travel through the microfluidics channel, such as (111), (1101) or (1011). This space-time coding technology reduces the size and the cost of the system by using only one PMT to differentiate 3 signals or even more.
Fig. 2 shows the schematic of the overall μFACS system, which is much simpler and smaller than a bench top system since most optics and cell sorting hardware have been integrated with the microfluidic lab-on-a-chip device. The laser-induced fluorescence from the stained cells is collected by a 20X microscope objective lens with NA = 0.40 (Leica, Germany). As the cell (bead) travels at a speed across the optical interrogation zone defined by three narrow slits made of a mask (Fig. 3), the fluorescent signals of the cell (bead) detected by the photomultiplier tube (PMT; PMM02, Thorlabs Inc., USA) display a waveform of three distinct peaks. The spacing between the peaks is equal to the space between the slits on the mask divided by the travel speed of the cell (bead) and the magnification factor (=20 for 20X objective). In this manner, we have transformed the slit patterns on the mask into a time-domain signal of similar waveform, the space-time coding technique. As illustrated in Fig. 3, different branches of the channels may have different slit patterns, resulting in different digital waveforms of the fluorescent signals detected by the same PMT. Using the space-time-coding technique, we can keep track of the travel path of each cell (bead), a unique and very important feature for cell sorting without adding the size or cost of the signal. The output signal from the PMT is imported into the electronic control system for real-time processing. The control system is programmed with an external driver (CompactRIO, Nantional Instruments Inc., USA) that has an embedded field programmable gate array (FPGA) chip.
In our current system, patterned slits are used to (1) code signals from the upstream detection zone and the downstream verification zone and (2) to temporally encode the signals so the signal-to-noise ratio can be enhanced by digital signal processing. Since the waveform of the signal is predetermined by the slit patterns on the mask, digital matched filters can be applied to amplify the signal and suppress the noise. The signal processing algorithm can be implemented with finite-impulse-response (FIR) filters in real time.
In our current system, the slits downstream from the sorting junction are designed to produce a digital pattern of (1011), distinguished from the (111) pattern in the detection area upstream of the sorting junction. After each cell is deflected to one of the sorting channels, the ‘verification’ signal (1011) should be detected to confirm the success of the sorting event. This single source, multi-point detection is possible because the excitation light is guided along the optofluidic waveguide even after the channel is split, thus fluorescence will still be excited and detected after the cells are sorted. The verification signal can be exploited to calibrate sorting parameters, such as the magnitude of the voltage applied to the PZT actuator, or necessary time delay to actuate the PZT for sorting.
Real-time signal processing flow is illustrated in Fig. 4(a). First, spike noise from the PMT due to the thermoelectric effect (i.e. dark current) and cosmic rays are removed. Signals are selectively amplified based on the finite impulse response (FIR) filtering algorithm to amplify only the signals that have the same frequency spectrum as the spectrum of the designed FIR filter, while noise of different frequencies is suppressed.
Fig. 4.

(a) The FPGA implemented real-time process control unit consists of two sub-sections: the detection section and the control section. The timing jitter of the system is less than 10 μs, enabling the real-time control. The match filter is a critical component that enhances the signal to noise ratio significantly. (b) Comparison of the (111) coded raw signal with 3 small peaks with the amplified signal by applying the FIR match filter algorithm.
Fig. 4(b) shows the amplified signal with the FIR match filter algorithm. We have reported in our previous publication that the FIR filter can enhance the signal-to-noise ratio (SNR) by 18 dB in real time, thus improving sensitivity and detection efficiency significantly.20 Any input signal above a user-defined threshold value implies the presence of a cell targeted for sorting. A delay counter in the control section can specify the elapsed time for the cell of interest to travel from the detection region to the sorting junction, and a pre-defined voltage signal is employed to drive the PZT actuator at the correct time to deflect the cell into the sorting channel. The timing jitter is measured to be less than 10 μs. The timing jitter is significantly shorter than the travel time of the cell from the upstream detection spot to the sorting junction, minimizing the chance of a false sort.
2.6 Purity analysis
Once the sorted mixture is collected, it is immediately transferred to a commercial FACS (FACScan, BD Biosciences) for purity analysis. To determine proper gating, a portion of the initial mixture is analyzed prior to sorted mixture. Gating by forward scattering (FSC) signals is used to determine total sample population. With the same gating, fluorescein histograms (FITC) of both the initial and the sorted mixtures are analyzed to determine the respective mixture ratios and, therefore, the enrichment factor.
3. Results and discussion
3.1 Separation of two different microspheres
A mixture of 10 μm fluorescent beads and 5 μm non-fluorescent beads with an initial mixture ratio of 1 : 160 is introduced to the μFACS device with sample flow and sheath flow rates of 5 μL min−1 and 50 μL min−1, respectively. This flow generates an average bead velocity of around 5 cm s−1 characterized using a high-speed camera. Utilizing the aforementioned space-time coding technique, sorting parameters to drive the PZT actuator can be optimized in the first few minutes of experiment, resulting in significant savings in sample volume. As shown in Fig. 3, the modulated detection signal has a three-lobed waveform, and one can estimate the velocity of each cell from the time interval between the lobes and the shape of the lobe by deconvolving the waveform from the shape of the slits. For instance, in Fig. 5, the estimated cell speed is 6 cm s−1, and the timing to trigger the PZT is determined based on the estimated velocity. The optimization process would result in the appearance of sorting signals (e.g. 1011 modulation) after detection signals (e.g. 111 modulation), as this indicates that targeted particles are being detected and sorted successfully. The intensity of the verification signal is lower than that of the detection signal because the excitation light intensity has been divided into three branches, and the (1011) slit design has a slightly different spatial frequency. The intensity fluctuation observed in the verification signal is due to the loss of flow confinement, as the 2-D flow focusing is broken after the sorting junction.
Fig. 5.
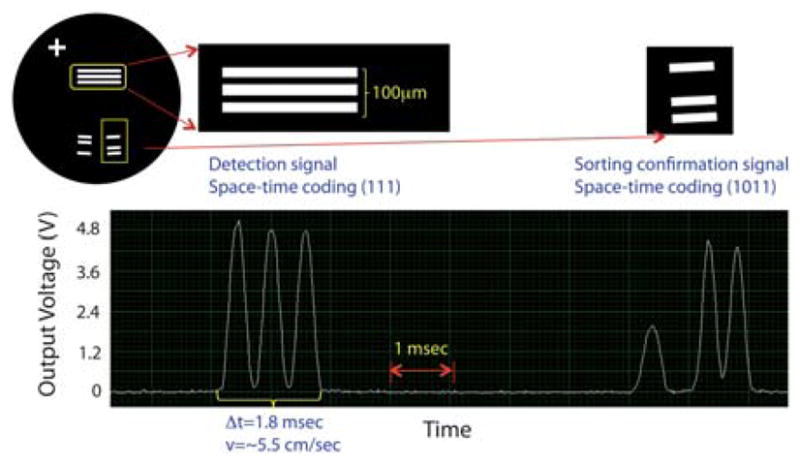
Example of space-time coding signals out of 10 μm fluorescent polystyrene beads. The first signal coded as (111) represents the detected fluorescence when the bead passes the detection zone(e.g. three transparent slits). After sorting, the second signal coded as (1011) that is ~5 ms trailing the detection signal indicates that the bead has been correctly switched into the sorting channel, confirming the successful sorting event. Note that the first signal allows one to estimate the velocity of the bead roughly, helping determine the right delay time for the exact triggering of the PZT actuator. Here, the bead travels with a velocity of around 5.5 cm s−1.
After continuous automated sorting for ~30 min with the optimized sorting parameters, the sorting result shows a ~200-fold enrichment at a throughput of 1500 beads s−1 (Fig. 6(a), (b)). The result from run to run is very consistent under the same flow conditions and sample preparation. The output mixture ratio between the 10 μm fluorescent beads and the 5 μm non-fluorescent beads is about 1.3 : 1 after sorting while the initial ratio is 1 : 160. The output mixture ratio implies that some unwanted 5 μm beads are sorted accidentally even though the 10 μm beads are significantly purified. This occurs because the velocity of the beads is not constant due to the lack of 3D (vertical direction) flow confinement. This causes an error in defining the proper timing for triggering the actuator, occasionally deflecting the unwanted beads into the target channel. Given the velocity of the beads (5–7 cm s−1) and the initial concentration (~107 beads ml−1), the average distance between two beads is about 50–80 μm, which implies the possibility of accidentally sorting two cells in one actuation since the nozzle opening at the sorting junction is 100 μm wide.
Fig. 6.

(a) The scattering plots show the result of sorting fluorescent 10 μm beads from non-fluorescent 5 μm beads. (b) The population ratio of the initial bead mixture is 0.67 : 100. After sorting for 30 min, the mixed ratio becomes 1.3 : 1, yielding an enrichment factor of around 200. (c) Before sorting (left), most of cells are non-fluorescent as the mixed ratio of fluorescent cells to non-fluorescent cells is 1 : 150. After sorting, the histogram (right) shows that the population of the sample (i.e. fluorescent cells) is purified with an enrichment factor of 230.
3.2 Mammalian cell sorting
Feasibility of the integrated micro-sorter for biological applications is demonstrated using human erythroleukemic (K562) cells. Under similar flow conditions, sample concentration, and initial mixture ratios, flow cytometric analysis shows an enrichment factor of ~230 fold (Fig. 6(c)), which is the highest value ever demonstrated in μFACS systems. Based on the sample flow rate (6 μl min−1) and cell concentration (1.1 × 10⁷ cells ml−1), a throughput of ~1000 cells s−1 is achieved. Even though the sample concentration is relatively high compared to conventional flow cytometric analysis (~106–107 cells ml−1), no significant cell stiction is observed due to the chemically inert Teflon AF coating. Cell clogging, which is common among μFACS systems, can greatly compromise sorting purity as well as the ability to collect sufficient targeted cells because the device becomes unusable as the clogged cells block the fluid flow. Owing to its minimized clogging, the proposed system can sustain continuous operation for long periods of time (>2 h). This is essential for sorting of rare cells such as stem cells and circulating tumor cells. By continuous operation at >1000 cells s−1, the micro-sorter can readily be applied to sort rare cells.
In conventional FACS, loss of cell viability is a concern due to the high hydrodynamic forces involved in the acceleration, droplet formation, and the deceleration as cells enter the collection tubes, etc.21 A trypan blue exclusion test was performed to evaluate viability for unsorted cells and sorted cells by the PZT actuation. No significant loss of cell viability due to the PZT actuation relative to unsorted populations was observed (less than 3%), which proves the PZT actuation mechanism does not cause serious damage to cells as sorted cells are deflected with the fluid.
3.3 Comparison to commercial FACS
To compare the sorting performance of the integrated μFACS with one of the highest performance bench-top FACS, (MoFlo; DakoCytomation Inc., San Diego, CA), nearly identical experimental conditions (sample concentration, initial mixture ratio, and throughput) are intentionally utilized using the bead sample (i.e. mixture of 10 μm fluorescent and 5 μm non-fluorescent beads). The result is shown in Table 1. While the MoFlow outperforms the integrated μFACS in terms of sample enriching capability, the gap is not too large considering the sophistication, size, and price (~$500k) of the MoFlo system.
Table 1.
Comparison to the commercial FACS - MoFlo
| Instrument | Throughput | Initial Mixture Ratio | Final Mixture Ratio | Enrichment |
|---|---|---|---|---|
| Integrated μFACS (Beads) | 1500 (beads s−1) | 0.0067 | 1.34 | 200 fold |
| Integrated μFACS (Mammalian Cells) | 1000 (cells s−1) | 0.0081 | 1.86 | 230 fold |
| MoFlo (Beads) | 2000 (beads s−1) | 0.0098 | 9.02 | 920 fold |
The μFACS system could significantly bridge this gap in sample enrichment by incorporating the capabilities of scattering parameter measurement, three-dimensional flow confinement, and the use of a narrower nozzle structure. Since the current system performs sorting based only on fluorescence, the addition of a scattering parameter can enhance purity by aborting sorting decisions whenever cells are traveling too close together. With 3-D flow confinement and a narrower nozzle structure, the effect of velocity variation in the vertical direction can be minimized, further preventing two beads from being sorted together due to the close distance between them. For future work, incorporation of the FSC parameter can be achieved by integrating on-chip waveguide-lens structure22,23 that allows in-plane optical excitation and collection. A number of 3-D confinement architectures, such as those employing the microfluidic drifting technique24 or chevron structures25 are compatible with the current system and can be readily integrated with the new device structure for increasing purity while maintaining high throughput operation.
3.4 Cost and size reduction
Low cost and portability are desirable features of microfluidics-based FACS. The μFACS device presented in this paper shows potential for significant (10 to 100 times) cost and size reduction while producing good performance. The on-chip PZT actuator and PDMS monolithic structure contribute to the dramatic size and cost reduction and enhanced functionality. The lost sensitivity due to the limit of on-chip optics compared to the bulk optics in bench top systems can be more than compensated by the space-time coding technique elucidated in this paper. All these make the lab-on-a-chip μFACS system attractive to point-of-care clinics and diagnostics in developing countries.
Conclusion
We have demonstrated a lab-on-a-chip cell sorter with an integrated piezoelectric actuator and fluidic optical waveguide to achieve high sensitivity and multi-point detection. As excitation always occurs, fluorescence can be detected at multiple points. A real-time signal processing and control system to allow closed-loop sorting is implemented in FPGA. The device operates under low power (less than 1 mW) and allows for a high throughput (~1500 cells s−1) as the flow stream responds to the piezoelectric actuator at high frequency. These attractive and unique features hold promise for a high-performance, low cost, and portable lab-on-a-chip μFACS system.
Sorting by this method does not depend on any properties of cells, as it operates by manipulating small volumes of fluid containing cells, thus allowing any kind of biological samples to be sorted and purified. The Teflon AF coating layer allows the sorting of biological samples by eliminating the issue of cell stiction and permeation through PDMS that many other μFACS systems suffer from. This system’s ability to manipulate single particles also allows one to sort samples at a high throughput and to achieve high purity. In fact, if a cascade structure is implemented for the 2nd round of sorting, enrichment of up to ~1M-fold or even higher should be possible.
Acknowledgments
This work was supported by NIH grants. We acknowledge the technical support of the staff of the Nano3 (Nanoscience, Nanoengineering, and Nanomedicine) in Calit2 in University of California at San Diego (UCSD). We thank Dr Ian Iian for providing K562 cells, Jerry Norwich for his help on running FACScan, and Judy Nordberg and Peggy O’Keefe in VA hospital for running MoFlo.
References
- 1.Shapiro H, Leif R. Practical flow cytometry. 2003 [Google Scholar]
- 2.Jennings C, Foon K. Cancer Invest. 1997;15:384. doi: 10.3109/07357909709039744. [DOI] [PubMed] [Google Scholar]
- 3.Li C, Heidt D, Dalerba P, Burant C, Zhang L, Adsay V, Wicha M, Clarke M, Simeone D. Cancer Res. 2007;67:1030. doi: 10.1158/0008-5472.CAN-06-2030. [DOI] [PubMed] [Google Scholar]
- 4.Shizuru J, Negrin R, Weissman I. Annu Rev Med. 2005;56:509. doi: 10.1146/annurev.med.54.101601.152334. [DOI] [PubMed] [Google Scholar]
- 5.Gross H, Verwer B, Houck D, Hoffman R, Recktenwald D. Natl Acad Sci U S A Proc. 1995;92:537. doi: 10.1073/pnas.92.2.537. [DOI] [PMC free article] [PubMed] [Google Scholar]
- 6.Wu Z, Willing B, Bjerketorp J, Jansson J, Hjort K. Lab Chip. 2009;9:1193. doi: 10.1039/b817611f. [DOI] [PubMed] [Google Scholar]
- 7.Schmid I, Lambert C, Ambrozak D, Marti G, Moss D, Perfetto S. A Cytometry. 2007;7:414. doi: 10.1002/cyto.a.20390. [DOI] [PubMed] [Google Scholar]
- 8.Godin J, Chen C, Cho S, Qiao W, Tsai F, Lo Y. J Biophotonics. 2008;1:355. doi: 10.1002/jbio.200810018. [DOI] [PMC free article] [PubMed] [Google Scholar]
- 9.Haeberle S, Zengerle R. Lab Chip. 2007;7:1094. doi: 10.1039/b706364b. [DOI] [PubMed] [Google Scholar]
- 10.Voldman J, Gray M, Toner M, Schmidt M. Anal Chem. 2002;74:3984. doi: 10.1021/ac0256235. [DOI] [PubMed] [Google Scholar]
- 11.Pamme N, Wilhelm C. Lab Chip. 2006;6:974. doi: 10.1039/b604542a. [DOI] [PubMed] [Google Scholar]
- 12.Wang M, Tu E, Raymond D, Yang J, Zhang H, Hagen N, Dees B, Mercer E, Forster A, Kariv I. Nat Biotechnol. 2005;23:83. doi: 10.1038/nbt1050. [DOI] [PubMed] [Google Scholar]
- 13.Wolff A, Perch-Nielsen I, Larsen U, Friis P, Goranovic G, Poulsen C, Kutter J, Telleman P. Lab Chip. 2003;3:22. doi: 10.1039/b209333b. [DOI] [PubMed] [Google Scholar]
- 14.Bang H, Chung C, Kim J, Kim S, Chung S, Park J, Lee W, Yun H, Lee J, Cho K. Microsyst Technol. 2006;12:746. [Google Scholar]
- 15.Cho SH, Godin J, Lo Y-H. IEEE Photonics Technol Lett. 2009;21:1057. doi: 10.1109/LPT.2009.2022276. [DOI] [PMC free article] [PubMed] [Google Scholar]
- 16.Lowry J, Mendlowitz J, Subramanian N. Proc SPIE. 1991;1330:142. [Google Scholar]
- 17.Godin J, Cho S, Lo YH. Proceedings OptoElectronics and Communications Conference 14th. 2009;1 doi: 10.1109/OECC.2009.5218317. [DOI] [PMC free article] [PubMed] [Google Scholar]
- 18.de Boer M, Gardeniers J, Jansen H, Smulders E, Gilde M, Roelofs G, Sasserath J, Elwenspoek M. J Microelectromech Syst. 2002;11:385. [Google Scholar]
- 19.Godin J, Lo Y-H. Conference on Lasers and Electro-Optics; 2009. [DOI] [PMC free article] [PubMed] [Google Scholar]
- 20.Chen CH, Cho SH, Tsai F, Erten A, Lo YH. Biomed Microdevices. 2009;11:1223. doi: 10.1007/s10544-009-9341-5. [DOI] [PMC free article] [PubMed] [Google Scholar]
- 21.Seidl J, Knuechel R, Kunz-Schughart LA. Cytometry. 1999;36:102. doi: 10.1002/(sici)1097-0320(19990601)36:2<102::aid-cyto3>3.3.co;2-4. [DOI] [PubMed] [Google Scholar]
- 22.Godin J, Lien V, Lo Y-H. Appl Phys Lett. 2006;89:061106. [Google Scholar]
- 23.Lien V, Berdichevsky Y, Lo YH. IEEE Photonics Technol Lett. 2004;16:1525. [Google Scholar]
- 24.Mao X, Lin S, Dong C, Huang T. Lab Chip. 2009;9:1583. doi: 10.1039/b820138b. [DOI] [PubMed] [Google Scholar]
- 25.Golden J, Kim J, Erickson J, Hilliard L, Howell P, Anderson G, Nasir M, Ligler F. Lab Chip. 2009;9:1942. doi: 10.1039/b822442k. [DOI] [PMC free article] [PubMed] [Google Scholar]