

Abstract
The phosphorylated form of histone H2A.X (γ-H2AX) is a well documented early, sensitive, and selective marker of DNA double-strand breaks (DSBs). Previously, we found that excessive glutamatergic activity increased γ-H2AX in neurons in vitro. Here, we evaluated γ-H2AX formation in the adult rat brain following neuronal excitation evoked by seizure activity in vivo. We found that brief, repeated electroconvulsive shock (ECS)-induced seizures (three individual seizures within 60 min) did not trigger an increase γ-H2AX immunostaining. In contrast, a cluster of 5–7 individual seizures evoked by kainic acid (KA) rapidly (within 30 min) induced γ-H2AX in multiple neuronal populations in hippocampus and entorhinal cortex. This duration of seizure activity is well below threshold for induction of neuronal cell death, indicating that the γ-H2AX increase occurs in response to sublethal insults. Moreover, an increase in γ-H2AX was seen in dentate granule cells, which are resistant to cell death caused by KA-evoked seizures. With as little as a 5 min duration of status epilepticus (SE), γ-H2AX increased in CA1, CA3, and entorhinal cortex to a greater extent than that observed after the clusters of individual seizures, with still greater increases after 120 min of SE. Our findings provide the first direct demonstration that DNA DSB damage occurs in vivo in the brain following seizures. Furthermore, we found that the γ-H2AX increase caused by 120 min of SE was prevented by neuroprotective preconditioning with ECS-evoked seizures. This demonstrates that DNA DSB damage is an especially sensitive indicator of neuronal endangerment and that it is responsive to neuroprotective intervention.
Introduction
Phosphorylated histone H2A.X (termed γ-H2AX) is a well established sensitive and quantitative marker of DNA double-strand breaks in non-neuronal cells (for review, see Fernandez-Capetillo et al., 2004; Bonner et al., 2008) and in immature neurons after exposure to ionizing radiation or pesticides (Kim et al., 2004; Nowak et al., 2006; Yang et al., 2009). With a 100-fold greater sensitivity compared to other assays such as the neutral comet assay, pulsed-field gel electrophoresis, and TUNEL, γ-H2AX immunostaining has become the “gold standard” for detecting double-strand break (DSB) damage under threshold conditions of injury (Bonner et al., 2008). In cultured non-neuronal cells, H2A.X phosphorylation occurs within minutes of ionizing radiation, with several thousand γ-H2AX molecules appearing in DNA regions located around each DSB lesion, forming “foci” (Rogakou et al., 1998, 1999). The appearance of these foci depends upon DNA DSB damage and is not found in the absence of such damage. Thus, this marker affords high sensitivity with little chance of false positives. It may also provide a sensitive and rapid index of DSBs in neurons in response to cell endangerment, as indicated by the rapid increases in γ-H2AX in neurons following in vitro stimulation of ionotropic glutamate receptors (Crowe et al., 2006), but this has yet to be demonstrated in vivo.
Most notably, Crowe et al. (2006) found that γ-H2AX increases occurred much earlier than the first signs of cell death and appeared in neurons that survived. In fact, fewer than 20% of neurons died under threshold stimulation conditions for evoking γ-H2AX foci induction in nearly all neurons. This suggests that DNA DSB damage is a good sentry for neuronal endangerment, not only as an early predictor of death but as an indicator of nonlethal neuronal harm. However, this relationship remains to be tested in an in vivo model of excitotoxicity, because there has been no demonstration of DSBs occurring in the brain in the aftermath of prolonged neural stimulation in vivo.
We investigated the possibility that recurrent stimulation of neuronal circuits resulting from experimentally evoked seizures could trigger γ-H2AX induction in the affected neuronal populations in vivo. Furthermore, given that the stimulation conditions that induced γ-H2AX in vitro were well below the lethal threshold (Crowe et al., 2006), we tested the hypothesis that nonlethal seizure durations will cause DSB damage in neurons in vulnerable brain regions. We examined γ-H2AX in hippocampus and entorhinal cortex of rats experiencing seizures of varying durations following treatment with kainic acid (KA). Previous studies demonstrated that durations of >30 min of continuous seizures or status epilepticus (SE) are required to cause substantial neuronal loss, as detected by conventional markers of the terminal stages of neurodegeneration (TUNEL and DNA laddering) (Kondratyev and Gale, 2001, their Fig. 1). Thus, durations of SE shorter than 30 min were of particular interest in the present study.
Figure 1.

Association between EEG and behavioral activity following diazepam administration. Diazepam (30 mg/kg, i.p.) was given at the time indicated by the arrow following 60 min of SE induced by KA (12.5 mg/kg). The traces are from two channels recorded from a representative animal implanted with epidural electrodes. The first trace was taken during SE, the second trace was taken 5 min following diazepam treatment, the third trace was taken 13 min following diazepam treatment, and the last trace was taken 5 min after additional 10 mg/kg diazepam was given.
In addition, we determined whether DSB damage is sensitive to neuroprotective intervention by evaluating γ-H2AX induction in animals exposed to seizure preconditioning treatment. This intervention was based on our previous observation that pre-exposure of rats to repeated daily electroconvulsive shock (ECS)-induced seizures protected against neuronal death caused by several hours of severe SE (Kondratyev et al., 2001).
Materials and Methods
Animals and treatment groups.
Adult Sprague Dawley male rats weighing 180–200 g were used (7–8 weeks old). Rats were maintained three per cage in a temperature-controlled room (21°C) with a 12 h light cycle. Food and water were provided ad libitum. Animals were allowed to acclimate to the treatment room for 30 min before starting ECS or administering KA. Seizures (i.e., ECS or KA-induced) were induced between 6:00 A.M. and 8:00 A.M. for all experiments. All experimental protocols were in compliance with Association for Assessment and Accreditation of Laboratory Animal Care standards and approved by the Georgetown University (Washington, DC) Animal Care and Use Committee.
ECS-treated animals.
Rats were randomly assigned to acute, chronic, or sham ECS groups and given ECS treatment sessions for 1 d (acute) or daily for 7 d (chronic). Minimal ECS was applied via corneal electrodes (200 ms, 22–28 mA) using a Wahlquist apparatus to induce minimal limbic motor seizures (facial and forelimb clonus) lasting 5–10 s (Kondratyev et al., 2001; Gwinn et al., 2002; Conti et al., 2009). Each ECS session consisted of 3 ECS treatments within 1 h. Each treatment was separated by 30 min and elicited one limbic motor seizure. Behavior was monitored and recorded during each ECS session and for 30 min following the last ECS treatment each day. Rats that did not display limbic motor seizures were excluded as nonresponders. Animals in which ECS evoked tonic extensor seizures were also excluded from experiments. Control (sham) animals received the same handling and contact with the electrodes, but no current was passed. All animals were weighed each day of the experiment, and rats that lost >10% of their body weight or that appeared unhealthy (e.g., having impaired motor control, diarrhea, etc.) during any point of the experiment were excluded from analyses. Less than 5% of all animals were excluded for the aforementioned reasons. Following chronic ECS treatment for 7 d, sham ECS and chronic ECS groups were randomly subdivided into chronic ECS-only, KA-treated, and vehicle-treated subgroups on day 8. ECS-only animals were killed 30 min or 24 h after the last ECS session.
Kainic acid-treated animals.
KA-treated animals were divided (randomly) into groups undergoing 30 min of intermittent seizures that resulted in 5–7 individual seizures or 5, 15, 30, or 120 min of SE (continuous seizures). Individual seizures or SE were induced by KA (0.625 mg/ml in 0.9% sterile saline; Ocean Products) injected intraperitoneally. For individual seizures, KA was administered at a dose of 12.5 mg/kg and seizures were terminated with diazepam (as described in Seizure termination) 30 min after the first behavioral manifestation of seizure activity (seizure score of 0.5 or higher, see Seizure scoring), which is before onset of SE (the latency to onset of SE is >60 min). For SE, KA was administered at a dose between 12.5 and 13.5 mg/kg, titrated as necessary for each group of animals to ensure that SE developed within 120 min of injection and continued for the durations indicated in Results until terminated with diazepam. Control (vehicle-treated) animals received an equivalent volume of 0.9% sterile saline (i.p.). Behavior was monitored continuously following KA administration, and behavioral manifestations of seizure activity were scored and recorded. SE was characterized by the following criteria: (1) stereotypies and automatisms involving the face and limbs, with whisker twitching constituting the mildest symptom; (2) recurrent limbic motor seizures that included facial and forelimb clonus of varying severity, typically accompanied by rearing and falling; (3) complete absence of normal behaviors such as grooming, sleeping, and locomotor exploration. The most critical feature of defining SE as distinct from individual seizures is the continuous nature of the abnormal state uninterrupted by normal activity. Typically, EEG recording is effective for documenting this state; however, we did not want to introduce the confounding factors of tissue damage and inflammation caused by surgically implanted EEG electrodes. Accordingly, we used highly sensitive behavioral indicators to monitor the extent to which the seizure state was continuous or discontinuous. In previous experiments, we have found a consistent relationship between the cessation of EEG abnormalities and the presence of behaviors such as full grooming. Conversely, the absence of the appearance of normal behaviors is an indicator of continued EEG seizure activity even without obvious signs of convulsive movements. Thus, the presence or absence of full body grooming, locomotor exploration (without stereotypies or automatisms), or sleeping was critical for discriminating between animals that were considered to exhibit SE and those that did not. In many instances, the behavioral manifestations of the seizure state oscillated between severe clonic/myoclonic manifestations (facial and forelimb clonus with rearing and falling or score 5 on Racine scale; see Seizure scoring) and less dramatic physical signs such as whisker, eye, and ear twitching.
For evaluating the effect of ECS preconditioning, KA-treated animals underwent 120 min of SE. The animals were killed immediately after termination of seizure activity.
Seizure termination.
Seizures were terminated after the durations indicated in Results with diazepam (30 mg/kg, i.p.; Hospira). Additional doses (10 mg/kg) were given as needed to ensure complete suppression of seizure activity (this was not necessary in animals in which SE was terminated after seizure durations of 30 min or less). Complete suppression of seizure activity was defined as a return of normal behaviors (grooming, locomotor exploration, and/or sleeping) and the absence of all signs of behavioral seizure activity (clonic and myoclonic movements of the face, limbs or trunk, stereotypies, head bobbing, whisker twitching, masticatory movements, and other automatisms). We have previously conducted studies with EEG recordings in which we established that in diazepam-treated rats, signs of mild facial twitching, especially involving the whiskers, are indicative of maintenance or resumption of electrographic seizure activity (and that, conversely, their absence is correlated with an absence of EEG seizure discharge) (Fig. 1 illustrates the relationship between behavioral and EEG activity following diazepam). Vehicle-treated animals also received diazepam (30 mg/kg, i.p.) at time points following saline injection equivalent to that of KA-treated animals. A subgroup of vehicle-treated animals did not receive diazepam as a control for effects of this anticonvulsant. All animals exhibited score 5 seizures, both during the initial period of individual seizure episodes and during the period of SE.
Seizure scoring.
Seizures were behaviorally scored using a 6-point scoring system similar to that originally described by (Racine, 1972) for amygdala-kindled seizures. Scorers verified their ability to provide consistent and accurate scores by comparing their scoring in pilot studies to EEG readings. Score 0.5 referred to facial clonus, appearing as rhythmic whisker and/or eye “twitching”, excessive mastication often accompanied by foaming at the mouth, and/or head bobbing. Score 1 was similar to score 0.5, but also included forelimb clonus in one forelimb. If clonus in both forelimbs was observed, a score 2 was recorded. Scores 3, 4, or 5 are considered to represent bilaterally propagated seizures (Gale, 1990). Score 3 refers to clonus in both forelimbs simultaneously (usually accompanied by mouth and facial clonus) lasting longer than 5 s. Score 4 includes rearing in addition to forelimb clonus. If the animal fell over while in the rearing stance, a score 5 was given (Gale, 1990). Two types of seizure activity were excluded: explosive clonic seizures, often appearing as “bouncing” and/or frantic, aimless running, and tonic convulsions. For the animals used in this study, the first behavioral manifestation of seizure activity was observed ∼17 min after KA injection (mean ± SD = 17.2 ± 6.2 min), and the onset of SE occurred, on average, 99 min following KA administration (mean ± SD = 99.0 ± 34.1 min).
Perfusion and tissue isolation.
Immediately following seizure cessation, animals were transcardially perfused with 0.9% saline followed by ice-cold 4% paraformaldehyde (PFA) in 0.1 m phosphate buffer. Brains were postfixed overnight in 4% PFA in 0.1 m phosphate buffer. Following postfixation, brains were rinsed in sterile saline and cryoprotected overnight in 10% sucrose and then in 20% sucrose until the tissue sunk to the bottom of the tubes. Individual brains were embedded in OCT compound on dry ice and frozen for 30 min before transferring to the cryostat. Brains were then cryosectioned into 10 μm thick coronal sections containing the brain areas of interest (i.e., hippocampus and entorhinal cortex) (Fig. 2) and mounted on Superfrost slides. Slides were stored at −20°C until further processing.
Figure 2.

The areas of the brain used for analysis. A, Hippocampus. Within the hippocampus, the following subfields were examined: a, CA1; b, CA3; and c, dentate gyrus (DG). B, Entorhinal cortex. Within the entorhinal cortex, neurons in layer II were examined. Coronal sections were obtained as described in Materials and Methods. The following coordinates (Paxinos and Watson, 2007) were used for obtaining the sections containing the areas used for analysis (marked as dashed rectangles): for the hippocampus, from −3.96 to −4.36 mm relative to bregma; for the entorhinal cortex, from −5.20 to −5.52 mm relative to bregma.
Immunohistochemistry.
Slides containing sections corresponding to the brain areas of interest (i.e., hippocampus and entorhinal cortex) (Fig. 2) were thawed at room temperature and slices were circled on the slide with an Immunopen (Vector Laboratories). Slices were incubated for 10 min in 4% PFA and then thoroughly washed in 1× PBS containing 100 mm glycine (Schwarz/MannBiotech) and again in 1× PBS for 30 min. For heat-mediated antigen retrieval, slides were placed in 1× sodium citrate buffer, pH 6.0 (Zymed Laboratories), heated to 95°C, and pulse-heated for 20 min in the citrate buffer in the microwave (kept at 95°C but not allowed to come to a rolling boil to maintain tissue integrity). Slides were allowed to cool for 20 min inside the microwave and then for 30 min at room temperature. Slides were washed 3 times in 1× PBS for 15 min each wash and then incubated for 1.5 h in blocking solution [5% normal goat serum (Sigma), 1% bovine serum albumin (IgG and protease-free; Sigma), 0.1% Triton-X, and 0.05% Tween 20 in 1× PBS] at room temperature. Slices were then incubated overnight at 4°C with the following primary antibodies in 1× PBS containing 5% normal goat serum and 1% BSA (IgG and protease-free): mouse anti-phospho H2A.X (1:300; Millipore Biotechnology), rabbit anti-Mre11 (1:75; Calbiochem), rabbit anti-neuron-specific enolase (NSE, 1:300) [specific marker of mature neurons (Grasso et al., 1977; Ding et al., 2000)]. The following day, slides were incubated another 30 min at 37°C. Slides were washed in 1× PBS and incubated in secondary antibodies diluted in 5% normal goat serum in 1× PBS for 1 h at 37°C. Secondary antibodies were Alexa Fluor 488 goat anti-mouse (1:500; Invitrogen) and Alexa Fluor 568 goat anti-rabbit (1:500; Invitrogen). Slides were washed in 1× PBS and then in double-distilled H2O. Glass coverslips (Corning, Fisher Scientific) were mounted using Vector Hardset mounting media with DAPI.
Image acquisition and γ-H2AX analysis.
Images within the areas of interest (CA1, CA3, dentate gyrus of the hippocampus, and layer II of the entorhinal cortex) (Fig. 2) were visualized and captured using an Olympus IX-70 FluoView laser confocal scanning microscope with a 60× oil immersion lens and 2× optical magnification. The laser intensity and gain were optimized and kept constant among all experimental groups. Images were captured sequentially for each fluorescent label to minimize bleed-through between the channels. Background was subtracted out using MetaMorph software. Foci were analyzed using Scion NIH Image software. The optical density threshold for foci detection was determined by visual inspection and kept constant for all groups. Two randomly chosen visual fields of each brain region were analyzed per animal. Nuclei were identified with DAPI staining, and foci were counted in neurons (NSE-positive cells) in which the entire nucleus was visible and free of apoptotic/abnormal features. A minimum of 50 neuronal nuclei were analyzed in each brain region per animal. Neurons having apoptotic/abnormal morphology were excluded from the analyses. Cells exhibiting pan-nuclear staining (intense, complete coverage of the nucleus with γ-H2AX staining) were also excluded from the analysis, as it has been demonstrated that this type of staining represents dying cells (Rogakou et al., 2000; Huang et al., 2004; Solier et al., 2009). Both the average number of foci per nucleus and the foci density (the sum of the pixels per nucleus occupied by foci) were calculated. These two measures are comparable. However, as found previously (Crowe et al., 2006), due to the confound of overlapping/touching foci a more linear dose–response curve is obtained when analyzing foci density, as compared to the number of foci. Thus, data are expressed as foci density unless indicated otherwise in Results [percentage of mean saline-injected animals (controls) ± SEM]. Foci were quantified in the hippocampal CA1, CA3, and dentate gyrus subfields and the entorhinal cortex. Given consistent and similar patterns of seizure-evoked γ-H2AX in CA1 and CA3 hippocampal regions, in several instances (see Results) data are shown only for CA1 neuronal populations.
Colocalization of Mre11 and γ-H2AX.
The colocalization between Mre11 and γ-H2AX provides supplementary evidence of DSB damage and is a reliable indicator for mobilization of DSB repair mechanisms when detected using confocal laser microscopy (Paull et al., 2000; Mirzoeva and Petrini, 2001). The analysis of colocalization was strictly qualitative; the cell was identified as positive or negative for colocalization. The minimum threshold for identifying a cell as positive was the presence of three distinct γ-H2AX foci that colocalized with clear and distinct Mre11 foci. It should be noted that the absence of positivity cannot be interpreted unequivocally due to overlapping γ-H2AX foci in some cells, the diffuse staining pattern obtained with the Mre11 antibody, and the rapid nature of the DSB detection/repair processes resulting in transient colocalization immediately following injury (Mirzoeva and Petrini, 2001). Thus, while positivity is a useful indicator of colocalization (and mobilization of DSB repair), it would be misleading to attempt to express this parameter as a ratio of cells not reaching the threshold for positivity. We have previously verified that the extent of optical colocalization of Mre11 and γ-H2AX used in this study was consistent with true colocalization of these proteins, as revealed by FRET analysis (Crowe and Kondratyev, 2010). Images were captured as detailed above for the analysis of γ-H2AX foci. Background was subtracted out, and the channels (green and red images) were merged in MetaMorph.
Statistical analysis.
For comparisons among or between treatment groups (e.g., unpaired t test or ANOVA), a log normal transformation was done on all data to minimize differences in variances among groups and normalize the data so that parametric analyses could be used for statistical analyses. Following transformation, either a one-way ANOVA was used for comparison among three or more groups followed by post hoc Tukey's test, or an unpaired t test was used for comparison between two groups (i.e., between a particular seizure duration and control in a specific brain region) as indicated in the Results. Significance was set at p < 0.05 for all tests. Correlations analyses were conducted on nontransformed data using Spearman's rho. Significance was set at p < 0.01 (one-tailed).
Results
γ-H2AX in neuronal populations from seizure-naive animals: baseline expression of γ-H2AX
In view of previous reports documenting the presence of low levels of γ-H2AX foci in cultured normal neurons from untreated animals (Crowe et al., 2006), we first examined the baseline expression of γ-H2AX in two groups of control animals: (1) those injected with saline in place of KA; and (2) those handled the same way as the ECS-treated animals, but not given ECS (sham ECS animals). The data from these two control groups were pooled for analyzing the control baseline expression of γ-H2AX. In these animals, the majority of the examined neurons (>80%) had <5 γ-H2AX foci per cell, and fewer than 5% had >10 foci (N = 6 animals, 15–30 cells per brain region per animal) (Fig. 3A). Neurons in the hippocampal CA1, CA3, and dentate gyrus subfields and in the entorhinal cortex appeared to have equivalent numbers of foci (Fig. 3A); this study, however, was insufficiently powered to pick up significant differences in baseline foci number (foci in control animals) among brain regions based on their low incidence. Of the neurons having elevated foci (>10 foci), most had normal nuclear morphology as evidenced by DAPI staining (>99%) (Fig. 3B). A majority of the large, discrete γ-H2AX foci occurring in control animal neurons colocalized with Mre11 (Fig. 3C).
Figure 3.

γ-H2AX and Mre11 immunoreactivity in rat brains from seizure naive animals (controls). A, Confocal images of γ-H2AX immunoreactivity in the hippocampal CA1 pyramidal cell layers and dentate granule cell layer and in the entorhinal cortex of an adult rat brain. Nuclei were identified using DAPI staining (left) and circled on images of γ-H2AX immunoreactivity (right). Small, black dots of varying sizes are γ-H2AX foci. NSE immunostaining (data not shown) confirmed that γ-H2AX formation occurred in neurons. Scale bars, 20 μm. B, Normal nuclear morphology in neuron from the hippocampal CA1 pyramidal cell layer that had relatively elevated focus levels (>10 foci). C, γ-H2AX and Mre11 colocalization (yellow dots in the right panel labeled “Merge”) in a neuron from the CA1 pyramidal cell layer. Nuclei were identified using DAPI staining and circled on images of γ-H2AX and Mre11 immunoreactivity.
γ-H2AX following brief seizures: absence of induction of γ-H2AX
To determine whether γ-H2AX would be increased following repeated brief seizures, we examined γ-H2AX in animals experiencing three ECS-induced seizures during a 60 min period. Each seizure had a duration of <30 s. These brief, repeated ECS-induced seizures cause neuronal excitation without evoking cellular indicators of injury, even upon several days of exposure (Kondratyev et al., 2001; Masco et al., 1999). In the hippocampus (CA1 and dentate) and the entorhinal cortex, neither acute (1 d) ECS (Table 1) nor chronic (7 d) ECS treatment (Table 2) evoked significant increases in γ-H2AX foci in NSE-positive cells, as compared to sham ECS-treated animals (p > 0.1).
Table 1.
γ-H2AX foci number and density in NSE-positive cells following acute ECS seizures
| Region | Mean foci number ± SEM |
Mean foci density ± SEM |
||
|---|---|---|---|---|
| Control | ECS | Control | ECS | |
| CA1 | 1.00 ± 0.37 | 0.69 ± 0.16 | 19.21 ± 9.42 | 16.37 ± 4.23 |
| Dentate | 0.44 ± 0.11 | 0.56 ± 0.24 | 0.88 ± 0.57 | 0.76 ± 0.33 |
| Entorhinal cortex | 3.00 ± 1.12 | 2.17 ± 0.34 | 25.75 ± 9.64 | 32.22 ± 9.60 |
Three seizures were induced over a 1 h period and animals were killed 30 min after the last seizure. Foci were counted in NSE-positive cells for which the entire nucleus was visible and free of apoptotic-like morphology as visualized by DAPI staining. Data are represented as the average number of foci (left columns) and the average foci density (right columns) ± SEM (N = 5 animals per group).
Table 2.
γ-H2AX foci number and density in NSE-positive cells following chronic (7 d) ECS
| Region | Mean foci number ± SEM |
Mean foci density ± SEM |
||
|---|---|---|---|---|
| Control | ECS | Control | ECS | |
| CA1 | 3.12 ± 0.55 | 4.08 ± 1.00 | 13.47 ± 3.41 | 11.76 ± 3.47 |
| Dentate | 2.70 ± 0.49 | 1.94 ± 0.09 | 6.66 ± 1.76 | 5.51 ± 0.41 |
| Entorhinal cortex | 2.65 ± 0.54 | 3.05 ± 1.78 | 7.54 ± 1.61 | 7.88 ± 2.56 |
The animals were killed 24 h after the last ECS seizure. Foci were counted in NSE-positive cells for which the entire nucleus was visible and free of apoptotic-like morphology as visualized by DAPI staining. Data are represented as the average number of foci (left columns) and the average foci density (right columns) ± SEM (N = 5 animals per group).
γ-H2AX following KA-evoked prolonged seizures: γ-H2AX induction after individual seizures
After injection of KA, the first seizures to occur are intermittent episodes of individual seizures interrupted by normal behaviors such as grooming and locomotor exploration. These began with an average onset latency of 17 min from the time of injection and recurred over a period of 60–120 min before the onset of SE (average time to onset of SE = 99 min). After the onset of SE, seizure activity was continuous until the time at which diazepam was administered to terminate the seizures. For our experiments, we compared the effects of clusters of individual seizures (5–7 seizures in a 30 min period) with various durations of SE to determine whether SE is necessary for induction of γ-H2AX or if SE increases the induction of γ-H2AX above and beyond the effect of individual seizures.
To examine the effect of individual seizures on γ-H2AX induction, animals exhibiting individual seizures, which started within 20 min after KA injection, were killed 30 min after the first seizure episode. During this time period, each animal exhibited between five and seven seizure episodes, and none of the animals entered into SE. These seizures resulted in γ-H2AX formation in neurons (identified by NSE immunoreactivity) in multiple brain regions, including the hippocampus and entorhinal cortex (Fig. 4). Increases in γ-H2AX were seen in the majority of neurons in all regions examined (>95%; data not shown), with the exception of a few occasional neurons that did not display such an increase (e.g., two cell nuclei in the entorhinal cortex shown in Fig. 4). This data indicates that recurrent individual seizures induced by KA are sufficient for induction of γ-H2AX and that SE is not necessary for this effect.
Figure 4.

γ-H2AX immunoreactivity increases in the rat brain 30 min after first behavioral manifestation of KA-induced seizure activity (i.e., following 5–7 intermittent individual seizures). Confocal images of γ-H2AX immunoreactivity in the hippocampal CA1 region and dentate granule cell layer and in the entorhinal cortex of an adult rat brain. γ-H2AX foci were examined 30 min after the first KA-evoked seizure (5–7 individual seizures occurring before onset of continuous seizure/status epilepticus). Nuclei were identified using DAPI staining (data not shown) and circled on images of γ-H2AX immunoreactivity. Small black dots of varying sizes are γ-H2AX foci. NSE immunostaining (data not shown) confirmed that γ-H2AX formation occurred in neurons. Images are representative of the γ-H2AX foci numbers observed in the majority of cells in each brain region following the indicated duration of seizures. A minimum of four animals were examined for each group, and all sections were processed together. Each slide had slices from both a control animal and a KA-treated animal to control for any slide-to-slide staining variability. Scale bar, 20 μm.
γ-H2AX following SE: relationship between γ-H2AX induction and seizure duration
In view of the effect of individual seizures on γ-H2AX induction, we determined whether SE further enhanced the expression of γ-H2AX foci above and beyond the effect of individual seizures. To do this, we compared γ-H2AX expression after 5, 30, and 120 min of SE. Increases in γ-H2AX were seen in the vast majority of neurons within the regions of interest (>95%; this study had an insufficient power to detect differences in the number of nuclei displaying elevated foci as a function of seizure duration). A quantitative comparison of γ-H2AX foci over SE duration is presented in Figure 5 along with data from rats experiencing only a cluster of individual seizures. All seizure conditions shown in Figure 5 resulted in the formation of significantly higher levels of γ-H2AX foci than in the controls for each brain region (p < 0.05) (also see Fig. 6), allowing a comparison across seizure conditions for each brain region. With the exception of the dentate granule cells, all regions showed a significantly greater amount of γ-H2AX after 5 min of SE than after 30 min of individual seizures, as indicated by foci density (Fig. 5A) or number (Fig. 5B). Moreover, with the exception of the dentate granule cells, all regions exhibited the highest levels of γ-H2AX after the most prolonged duration of SE (120 min), probably due to an accumulation of γ-H2AX foci with continuing excitation. The dentate granule cells exhibited a temporal pattern quite distinct from those of the other brain areas examined. In this region, a peak level of γ-H2AX was achieved after a cluster of individual seizures alone, showing no additional increase with 5 min of SE and a subsequent decline after 30 min of SE (foci density: 850 ± 271 SEM; number of foci: 775 ± 61 SEM).
Figure 5.

γ-H2AX evoked in the rat brain following 30 min of intermittent individual seizures, IS, or 5 or 120 min of status epilepticus, SE. Data are expressed as percentage mean untreated-control ± SEM. (N = 4 for 30 min individual seizures and 120 min SE; N = 3 for 5 min SE). Data shown for all treatment groups in all brain areas are significantly greater than respective controls (p < 0.05). Asterisks are used for comparisons across seizure groups within each brain region. (*p < 0.05, **p < 0.01; ANOVA followed by post hoc Tukey's test). Quantification of γ-H2AX immunoreactivity in the CA1 and CA3 subfields and the dentate granule cell layer of the hippocampus and in the entorhinal cortex was carried out. γ-H2AX was quantified in neurons (NSE-positive cells) having normal nuclear morphology (visualized with DAPI staining) 30 min after the first KA-evoked seizure (30 min of intermittent individual seizures; light gray bars) or after 5 min (dark gray bars) or 120 min (black bars) of SE. Average γ-H2AX foci density (A) or average number of foci per nucleus (B) was calculated as a percentage of the average value for saline-injected animals (controls). Data for γ-H2AX foci density and the number obtained from animals experiencing 30 min of SE (data not shown on the graph) were consistently in between the values shown for 5 and 120 min of SE, and were not significantly different from those for120 min.
Figure 6.

γ-H2AX foci formation and colocalization with Mre11 in the rat brain following varying durations of KA-induced seizures. A–C, Quantified γ-H2AX immunoreactivity as a function of time after first behavioral manifestation of seizure activity in the hippocampal CA1 pyramidal cell layer (A) and dentate granule cells (B), as well as in the entorhinal cortex (C). γ-H2AX was quantified in neurons (NSE-positive cells) having normal nuclear morphology (visualized with DAPI staining). r = Spearman's rho, *p < 0.01 one-tailed; ○, 5–7 individual seizures; ■, 5 min of SE; ▵, 15 min of SE;  , 30 min of SE; •, 120 min of SE. Data are expressed as foci density [percentage of mean control (seizure naive) ± SEM]. D, γ-H2AX (green) and Mre11 (red) colocalization (yellow) in the neurons from the CA1 pyramidal cell layer (CA1), dentate gyrus, and entorhinal cortex after 15 min of KA-evoked SE. White arrows point to selected colocalized foci. Nuclei were identified using DAPI staining (data not shown) and circled on images of γ-H2AX and Mre11 immunoreactivity.
As shown in Figure 6, γ-H2AX foci density, when analyzed across all seizure treatment groups, was significantly correlated with time after the first behavioral manifestation of seizure activity, such that foci density increased with time in the hippocampal CA1 subfield and the entorhinal cortex (Fig. 6A,C). In contrast, in the hippocampal dentate gyrus granule cell layer, foci density was negatively correlated with seizure duration (Fig. 6B). This unusual pattern for the dentate granule cells reflects the same relationship observed in Figure 5B and may be associated with the resistance of this population to seizure-induced damage.
The colocalization between γ-H2AX and a DNA damage-response protein, Mre11, provides supplementary evidence of DSB damage and is a reliable indicator for mobilization of DSB repair mechanisms when detected using confocal laser microscopy (see Materials and Methods) (Paull et al., 2000; Mirzoeva and Petrini, 2001). A subset of seizure-evoked γ-H2AX foci colocalized with Mre11. Colocalization was variable within and among populations (Fig. 6D).
γ-H2AX following 120 min of SE in animals in which SE-induced injury was prevented by pre-exposure to ECS
We have demonstrated previously that rats pre-exposed to repeated, brief seizures induced by ECS were resistant to neuronal damage evoked by prolonged durations of KA-elicited SE (Kondratyev et al., 2001). For the present study, we used the same neuroprotective protocol for ECS exposure involving 7 d of ECS treatment. We also challenged the rats with a120 min duration of KA-induced SE, as this duration caused profound damage in controls but not in ECS-pre-exposed rats (as evidenced by both silver staining and DNA fragmentation) (Kondratyev et al., 2001). The ECS pre-exposure attenuated the γ-H2AX evoked by 120 min of SE in all brain regions (Fig. 7). Moreover, in the dentate gyrus, pre-exposure to ECS completely blocked the subsequent seizure-evoked increase in γ-H2AX foci density (Fig. 7A) and the number of foci (Fig. 7B). In the CA1, CA3, and entorhinal cortex, pre-exposure to ECS resulted in ∼80–95% reduction in γ-H2AX density and 40–80% reduction in the number of foci, as compared to controls (pre-exposed to sham ECS) following 120 min of SE.
Figure 7.
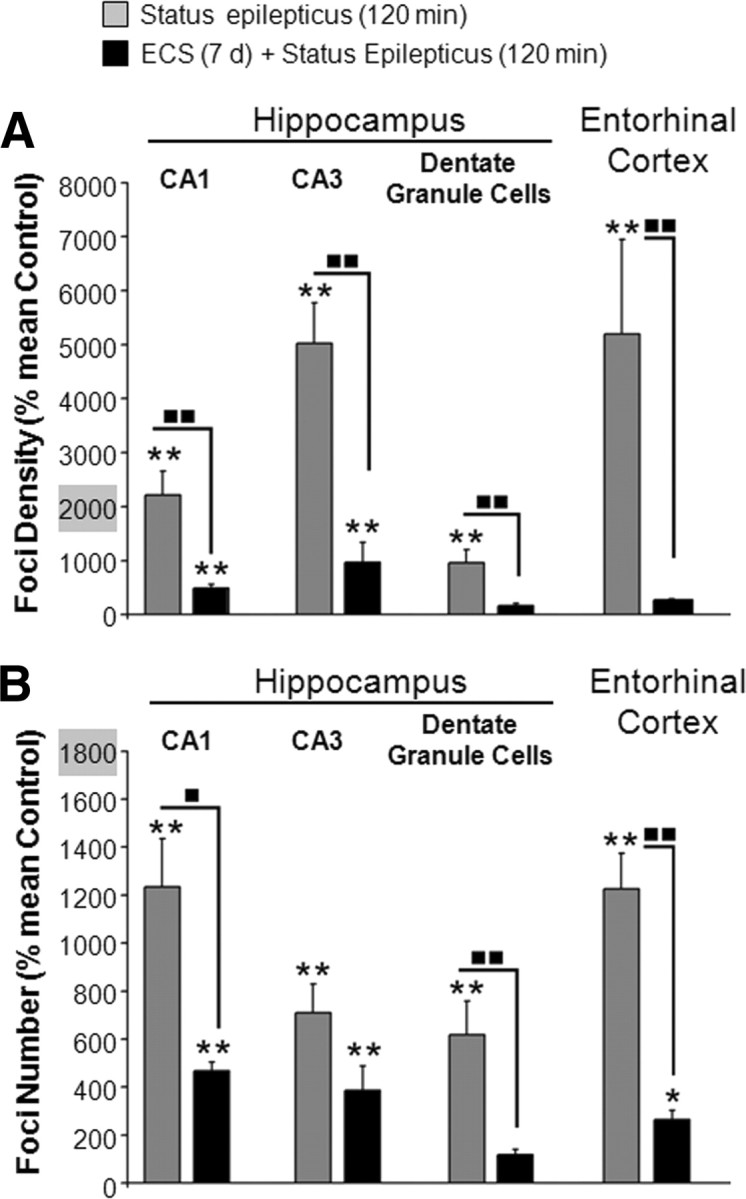
Pretreatment with minimal ECS attenuates seizure-induced γ-H2AX foci. A, B, Quantification of γ-H2AX immunoreactivity in the CA1 and CA3 pyramidal neurons and dentate granule cells of the hippocampus, and in the entorhinal cortex immediately following 120 min of SE in seizure naive animals (those pretreated with sham ECS) (gray bars) or in animals pretreated with 7 d of brief, repeated minimal ECS (black bars). γ-H2AX was quantified in neurons (NSE-positive cells) having normal nuclear morphology (visualized with DAPI staining). Average γ-H2AX foci density (A) and average number of foci per nucleus (B) calculated as a percentage of the average value for untreated control animals (no ECS treatment and no KA treatment). Data are expressed as percentage of mean untreated-control ± SEM. Statistical analysis were done on a log-normal transformation of the raw data to account for unequal variances among groups and to make the data fit into a normal distribution for parametric analyses (N = 4 animals per group; *p < 0.05, **p < 0.01 as compared to seizure-naive controls; ■, p < 0.05, ■ ■, p < 0.01 as compared between treatments; ANOVA followed by post hoc Tukey's test).
Discussion
Here we show that a well documented and reliable quantitative marker of DNA DSB damage, γ-H2AX, increases in neuronal populations in the brain as early as 30 min after the first KA-evoked seizure, before the onset of SE. This increase was observed not only in neuronal populations vulnerable to seizure-evoked injury (i.e., hippocampal CA1 and CA3 subfields and entorhinal cortex), but also in regions resistant to such insults (i.e., dentate granule cells). Furthermore, in both control and KA-treated animals, a subset of γ-H2AX foci colocalized with the DNA repair factor Mre11, indicating that DNA DSB repair mobilized concurrently with DNA damage in at least a portion of the foci (Crowe and Kondratyev, 2010). Our present findings provide the first direct demonstration that DNA DSB damage occurs in vivo in the brain following excessive stimulation due to seizure activity.
Remarkably, we observed an increase in γ-H2AX after durations of KA-induced recurrent seizures considerably shorter than those required to cause significant cell death (Kondratyev and Gale, 2001). At the same time, we have established that exposure to brief isolated seizures (three seizures over 60 min with a cumulative duration <2 min) induced by ECS is not sufficient to trigger an increase in γ-H2AX. The fact that a few isolated and brief seizure episodes are not sufficient to cause γ-H2AX induction also indicates that stress of handling and the seizure experience itself do not trigger DSB damage in the brain regions we have examined.
Greater than 30 min duration of SE is necessary to cause detectable cell death as measured by DNA fragmentation in vulnerable brain regions (Kondratyev and Gale, 2001). Our observation of significant induction of γ-H2AX with only five intermittent seizures or 5 min of SE indicates that DSB damage occurs with nonlethal insults, an observation corroborated by the seizure-induced increase in γ-H2AX in neurons (dentate granule cells) known for their ability to survive conditions that kill other hippocampal neuronal populations.
The time of onset of the increase in γ-H2AX foci was much earlier than the time of onset of DNA fragmentation following SE (Filipkowski et al., 1994; Pollard et al., 1994; Kondratyev and Gale, 2001). DNA fragmentation, as measured by detecting products of endonuclease-mediated DNA disintegration (Wyllie, 1980; Gavrieli et al., 1992; Negoescu et al., 1998), begins at least 4 h after the initial seizure insult, reaching a peak at 24 h (Kondratyev and Gale, 2001). This latter type of damage marks terminal irreversible stages of cellular injury, accompanied by aberrant nuclear morphology indicative of cellular degeneration (Fujikawa et al., 2000). In contrast, in the studies reported here, there was little or no evidence of the aberrant nuclear morphology or pan-nuclear pattern of γ-H2AX immunostaining characteristic of dying cells (Rogakou et al., 2000; Huang et al., 2004; Nowak et al., 2006). Thus, γ-H2AX, as an intracellular index of DSBs, appears to be an especially sensitive and rapid sign of cell endangerment that is capable of detecting sublethal toxic insults to neurons.
The almost linear increase in γ-H2AX foci as a function of duration of recurrent seizures supports the hypothesis that DSB damage reflects the severity of the seizure-induced insult. The exception to this pattern was in the death-resistant dentate granule cells, where maximal DSB damage was achieved after either 5–7 individual seizures or as little as 5 min of SE. This very early and transient DNA damage in the dentate granule cells may occur in coordination with seizure-induced massive and early changes in gene transcription in these neurons, changes that are reflected in phosphorylation of histone H3 and acetylation of histone H4 (Huang et al., 2002; Sng et al., 2006; Taniura et al., 2006). These changes in chromatin remodeling and gene expression may permit early repair of oxidative damage and contribute to the injury resistance of this population of neurons.
Additional evidence that the DSB damage we have detected is related to compromised survival comes from the results of our preconditioning experiments. We found that an intervention that protects against neuronal death also prevents DSB damage. As we reported previously, pre-exposure to ECS-induced seizures is remarkably neuroprotective against neurodegeneration induced by prolonged SE (Kondratyev et al., 2001). This same pre-exposure attenuated the seizure-induced γ-H2AX formation in our present study. Although this phenomenon may appear to resemble ischemic preconditioning (Kato et al., 1991; Chen and Simon, 1997; Perez-Pinzon et al., 1997), unlike the latter, preconditioning with ECS does not subject the brain to DNA damage as evidenced by the absence of γ-H2AX induction following ECS in our experiments. Thus, ECS preconditioning may recruit neuroprotective mechanisms via activity-dependent trophic changes, rather than the induction of repair mechanisms.
Consistent with the proposal that γ-H2AX staining provides a highly sensitive marker of sublethal cell insult, a small but significant γ-H2AX induction could still be detected in ECS-preconditioned, neuroprotected brains. In this context, γ-H2AX staining can be useful as an especially stringent test of neuroprotective therapy, one that is considerably more sensitive than markers linked to cell death and one that can identify subpopulations of cells that elude neuroprotective interventions.
In a previous study (Crowe and Kondratyev, 2010), we examined protein levels of the regulatory subunit of DNA-dependent protein kinase, Ku-70, an essential component of nonhomologous end-joining (the repair pathway believed to be predominant in nonproliferating cells). We found that ECS exposure alone did not alter the levels of Ku-70, consistent with our current findings that ECS seizures do not induce DSBs. However, ECS preconditioning did prevent Ku-70 induction by SE (Crowe and Kondratyev, 2010), indicating that the neuroprotective effect of ECS is upstream from both DSB damage and repair responses.
The changes we observed in γ-H2AX took place considerably earlier than the changes observed by Lan et al. in 8-hydroxyl-2′-deoxyguanosine, an index of seizure-induced oxidative DNA damage in brain tissue (Lan et al., 2000). The latter investigators found no change in hippocampus at 4 h, but more than a doubling by 8 h after KA injection; this was well in advance of the appearance of DNA fragmentation, which was detected starting at 24 h (Lan et al., 2000). Thus, the high sensitivity of the γ-H2AX assay allows detection of DNA DSB damage in the earliest phases of DSB formation (Bonner et al., 2008) when it is minimal, well before it accumulates to a level needed for detection with other assays of DNA damage.
Currently, the most well established marker of sublethal injury in the brain is heat shock protein 72 (HSP72). Like γ-H2AX, HSP72 is increased by prolonged and continuous seizures in durations insufficient to cause irreversible injury or death (Lowenstein et al., 1990; Sloviter and Lowenstein, 1992), and it is not induced by nonstressful excitation (Sloviter and Lowenstein, 1992) or by ECS (Wong et al., 1992). However, the seizure durations required for induction of HSP72 in hippocampal CA1 and CA3 subfields (30–60 min) (Lowenstein et al., 1990) were considerably longer than those required to detect a significant increase in γ-H2AX in our experiments. Moreover, dentate granule cells show little or no HSP72 induction, in contrast to the marked induction of γ-H2AX in granule cells in our experiments. In studies using HSP70 as a marker, no increase in HSP70 was detected in hippocampal regions of KA-treated animals that exhibited only intermittent individual seizures without SE (Armstrong et al., 1996). Even with SE, increases in HSP70 mRNA were seen in CA1 and CA3 only after 3 h, with no increase in the dentate granule cells until 12 h. Thus, the induction of γ-H2AX occurs considerably more rapidly and in response to less severe insults than required to cause an increase in the inducible heat shock proteins.
Our results indicate that DNA DSB damage is rapidly induced in the mature brain as a function of prolonged synaptic excitation, much of which is mediated by glutamate. Because γ-H2AX, as an index of DNA DSB damage, increased progressively with longer durations of seizure-evoked insult, it is likely that DNA DSBs contribute to the transition from cell endangerment to frank neuronal death following injurious seizure durations. At the same time, our results provide evidence that dentate granule cells may be equipped with especially responsive mechanisms for rapidly countering seizure-evoked DNA damage; these mechanisms may resist seizure-induced injury. Together, our data suggest that DSB damage alone is not sufficient for inducing cell death, but a failure to repair DSB damage may contribute to seizure-induced injury in vulnerable populations. Indeed, in the absence of certain DSB repair mechanisms, mice exhibited increased susceptibility to glutamate-mediated neurotoxicity (Culmsee et al., 2001; Macleod et al., 2003). But even when DSB repair takes place unimpeded, the surviving neurons may be compromised, especially if the repair process generates errors that give rise to mutations and genomic instability. Such errors could contribute to adverse neurological sequelae and/or later onset epilepsy. Because we found that substantial DNA damage in the absence of neuronal loss occurred after as little as 5 min of SE in seizure-naive animals, our data may prompt a reassessment of the duration of SE considered to be benign in the clinical setting (currently thought to be 30 min). The highly selective detection of seizure-evoked DNA damage that we describe here may provide a novel approach to monitoring neuronal endangerment that can better inform clinical decision making.
Footnotes
This work was supported by a National Research Service Award predoctoral fellowship F31NS 461991 (S.L.C.) from the National Institute of Neurological Disorders and Stroke and by National Institutes of Health Grants MH02040, AG019165, NS048974, and NS056057 (A.K.). We would like to thank Drs. Jinsook Kim, G. William Rebeck, Vicente Notario, and P. J. Brooks for their valuable feedback and helpful comments in the preparation of this manuscript. We also thank Irina Kats for technical assistance.
References
- Armstrong JN, Plumier JC, Robertson HA, Currie RW. The inducible 70,000 molecular/weight heat shock protein is expressed in the degenerating dentate hilus and piriform cortex after systemic administration of kainic acid in the rat. Neuroscience. 1996;74:685–693. doi: 10.1016/0306-4522(96)00164-9. [DOI] [PubMed] [Google Scholar]
- Bonner WM, Redon CE, Dickey JS, Nakamura AJ, Sedelnikova OA, Solier S, Pommier Y. GammaH2AX and cancer. Nat Rev Cancer. 2008;8:957–967. doi: 10.1038/nrc2523. [DOI] [PMC free article] [PubMed] [Google Scholar]
- Chen J, Simon R. Ischemic tolerance in the brain. Neurology. 1997;48:306–311. doi: 10.1212/wnl.48.2.306. [DOI] [PubMed] [Google Scholar]
- Conti G, Gale K, Kondratyev A. Immunohistochemical evaluation of the protein expression of nerve growth factor and its TrkA receptor in rat limbic regions following electroshock seizures. Neurosci Res. 2009;65:201–209. doi: 10.1016/j.neures.2009.07.001. [DOI] [PMC free article] [PubMed] [Google Scholar]
- Crowe SL, Kondratyev A. DNA damage and repair in the brain: implications for seizure-induced neuronal injury, endangerment, and neuroprotection. In: Fujikawa D, editor. Acute neuronal injury: the role of excitotoxic programmed cell death mechanisms. New York: Springer; 2010. pp. 243–275. [Google Scholar]
- Crowe SL, Movsesyan VA, Jorgensen TJ, Kondratyev A. Rapid phosphorylation of histone H2A.X following ionotropic glutamate receptor activation. Eur J Neurosci. 2006;23:2351–2361. doi: 10.1111/j.1460-9568.2006.04768.x. [DOI] [PMC free article] [PubMed] [Google Scholar]
- Culmsee C, Bondada S, Mattson MP. Hippocampal neurons of mice deficient in DNA-dependent protein kinase exhibit increased vulnerability to DNA damage, oxidative stress and excitotoxicity. Brain Res Mol Brain Res. 2001;87:257–262. doi: 10.1016/s0169-328x(01)00008-0. [DOI] [PubMed] [Google Scholar]
- Ding M, Haglid KG, Hamberger A. Quantitative immunochemistry on neuronal loss, reactive gliosis and BBB damage in cortex/striatum and hippocampus/amygdala after systemic kainic acid administration. Neurochem Int. 2000;36:313–318. doi: 10.1016/s0197-0186(99)00139-4. [DOI] [PubMed] [Google Scholar]
- Fernandez-Capetillo O, Lee A, Nussenzweig M, Nussenzweig A. H2AX: the histone guardian of the genome. DNA Repair. 2004;3:959–967. doi: 10.1016/j.dnarep.2004.03.024. [DOI] [PubMed] [Google Scholar]
- Filipkowski RK, Hetman M, Kaminska B, Kaczmarek L. DNA fragmentation in rat brain after intraperitoneal administration of kainate. Neuroreport. 1994;5:1538–1540. doi: 10.1097/00001756-199407000-00032. [DOI] [PubMed] [Google Scholar]
- Fujikawa DG, Shinmei SS, Cai B. Kainic acid-induced seizures produce necrotic, not apoptotic, neurons with internucleosomal DNA cleavage: implications for programmed cell death mechanisms. Neuroscience. 2000;98:41–53. doi: 10.1016/s0306-4522(00)00085-3. [DOI] [PubMed] [Google Scholar]
- Gale K. Animal models of generalized convulsive seizures: some neuroanatomical differentiation of seizure types. In: Avoli M, Gloor P, Kostopoulos G, Naquet R, editors. Generalized epilepsy. Boston: Birkhäuser; 1990. pp. 329–343. [Google Scholar]
- Gavrieli Y, Sherman Y, Ben-Sasson SA. Identification of programmed cell death in situ via specific labeling of nuclear DNA fragmentation. J Cell Biol. 1992;119:493–501. doi: 10.1083/jcb.119.3.493. [DOI] [PMC free article] [PubMed] [Google Scholar]
- Grasso A, Haglid KG, Hansson HA, Persson L, Rönnbäck L. Localization of 14–3-2 protein in the rat brain by immunoelectron microscopy. Brain Res. 1977;122:582–585. doi: 10.1016/0006-8993(77)90472-3. [DOI] [PubMed] [Google Scholar]
- Gwinn R, Kondratyev A, Gale K. Time-dependent increase in basic fibroblast growth factor protein in limbic regions following electroshock seizures. Neuroscience. 2002;114:403–409. doi: 10.1016/s0306-4522(02)00265-8. [DOI] [PubMed] [Google Scholar]
- Huang X, Okafuji M, Traganos F, Luther E, Holden E, Darzynkiewicz Z. Assessment of histone H2AX phosphorylation induced by DNA topoisomerase I and II inhibitors topotecan and mitoxantrone and by the DNA cross-linking agent cisplatin. Cytometry A. 2004;58:99–110. doi: 10.1002/cyto.a.20018. [DOI] [PubMed] [Google Scholar]
- Huang Y, Doherty JJ, Dingledine R. Altered histone acetylation at glutamate receptor 2 and brain-derived neurotrophic factor genes is an early event triggered by status epilepticus. J Neurosci. 2002;22:8422–8428. doi: 10.1523/JNEUROSCI.22-19-08422.2002. [DOI] [PMC free article] [PubMed] [Google Scholar]
- Kato H, Liu Y, Araki T, Kogure K. Temporal profile of the effects of pretreatment with brief cerebral ischemia on the neuronal damage following secondary ischemic insult in the gerbil: cumulative damage and protective effects. Brain Res. 1991;553:238–242. doi: 10.1016/0006-8993(91)90831-f. [DOI] [PubMed] [Google Scholar]
- Kim SJ, Kim JE, Moon IS. Paraquat induces apoptosis of cultured rat cortical cells. Mol Cells. 2004;17:102–107. [PubMed] [Google Scholar]
- Kondratyev A, Gale K. Temporal and spatial patterns of DNA fragmentation following focally or systemically-evoked status epilepticus in rats. Neurosci Lett. 2001;310:13–16. doi: 10.1016/s0304-3940(01)02055-9. [DOI] [PubMed] [Google Scholar]
- Kondratyev A, Sahibzada N, Gale K. Electroconvulsive shock exposure prevents neuronal apoptosis after kainic acid-evoked status epilepticus. Brain Res Mol Brain Res. 2001;91:1–13. doi: 10.1016/s0169-328x(01)00099-7. [DOI] [PubMed] [Google Scholar]
- Lan J, Henshall DC, Simon RP, Chen J. Formation of the base modification 8-hydroxyl-2′-deoxyguanosine and DNA fragmentation following seizures induced by systemic kainic acid in the rat. J Neurochem. 2000;74:302–309. doi: 10.1046/j.1471-4159.2000.0740302.x. [DOI] [PubMed] [Google Scholar]
- Lowenstein DH, Simon RP, Sharp FR. The pattern of 72-kDa heat shock protein-like immunoreactivity in the rat brain following flurothyl-induced status epilepticus. Brain Res. 1990;531:173–182. doi: 10.1016/0006-8993(90)90771-3. [DOI] [PubMed] [Google Scholar]
- Macleod MR, Ramage L, McGregor A, Seckl JR. Reduced NMDA-induced apoptosis in neurons lacking ataxia telangiectasia mutated protein. Neuroreport. 2003;14:215–217. doi: 10.1097/00001756-200302100-00011. [DOI] [PubMed] [Google Scholar]
- Masco D, Sahibzada N, Switzer R, Gale K. Electroshock seizures protect against apoptotic hippocampal cell death induced by adrenalectomy. Neuroscience. 1999;91:1315–1319. doi: 10.1016/s0306-4522(98)00636-8. [DOI] [PubMed] [Google Scholar]
- Mirzoeva OK, Petrini JH. DNA damage-dependent nuclear dynamics of the Mre11 complex. Mol Cell Biol. 2001;21:281–288. doi: 10.1128/MCB.21.1.281-288.2001. [DOI] [PMC free article] [PubMed] [Google Scholar]
- Negoescu A, Guillermet C, Lorimier P, Brambilla E, Labat-Moleur F. Importance of DNA fragmentation in apoptosis with regard to TUNEL specificity. Biomed Pharmacother. 1998;52:252–258. doi: 10.1016/S0753-3322(98)80010-3. [DOI] [PubMed] [Google Scholar]
- Nowak E, Etienne O, Millet P, Lages CS, Mathieu C, Mouthon MA, Boussin FD. Radiation-induced H2AX phosphorylation and neural precursor apoptosis in the developing brain of mice. Radiat Res. 2006;165:155–164. doi: 10.1667/rr3496.1. [DOI] [PubMed] [Google Scholar]
- Paull TT, Rogakou EP, Yamazaki V, Kirchgessner CU, Gellert M, Bonner WM. A critical role for histone H2AX in recruitment of repair factors to nuclear focus after DNA damage. Curr Biol. 2000;10:886–895. doi: 10.1016/s0960-9822(00)00610-2. [DOI] [PubMed] [Google Scholar]
- Paxinos G, Watson C. The rat brain in stereotaxic coordinates. Ed 6. London: Academic; 2007. [DOI] [PubMed] [Google Scholar]
- Pérez-Pinzón MA, Xu GP, Dietrich WD, Rosenthal M, Sick TJ. Rapid preconditioning protects rats against ischemic neuronal damage after 3 but not 7 days of reperfusion following global cerebral ischemia. J Cereb Blood Flow Metab. 1997;17:175–182. doi: 10.1097/00004647-199702000-00007. [DOI] [PubMed] [Google Scholar]
- Pollard H, Cantagrel S, Charriaut-Marlangue C, Moreau J, Ben Ari Y. Apoptosis associated DNA fragmentation in epileptic brain damage. Neuroreport. 1994;5:1053–1055. doi: 10.1097/00001756-199405000-00009. [DOI] [PubMed] [Google Scholar]
- Racine RJ. Modification of seizure activity by electrical stimulation. II. Motor seizure. Electroencephalogr Clin Neurophysiol. 1972;32:281–294. doi: 10.1016/0013-4694(72)90177-0. [DOI] [PubMed] [Google Scholar]
- Rogakou EP, Pilch DR, Orr AH, Ivanova VS, Bonner WM. DNA double-stranded breaks induce histone H2AX phosphorylation on serine 139. J Biol Chem. 1998;273:5858–5868. doi: 10.1074/jbc.273.10.5858. [DOI] [PubMed] [Google Scholar]
- Rogakou EP, Boon C, Redon C, Bonner WM. Megabase chromatin domains involved in DNA double-strand breaks in vivo. J Cell Biol. 1999;146:905–916. doi: 10.1083/jcb.146.5.905. [DOI] [PMC free article] [PubMed] [Google Scholar]
- Rogakou EP, Nieves-Neira W, Boon C, Pommier Y, Bonner WM. Initiation of DNA fragmentation during apoptosis induces phosphorylation of H2AX histone at serine 139. J Biol Chem. 2000;275:9390–9395. doi: 10.1074/jbc.275.13.9390. [DOI] [PubMed] [Google Scholar]
- Sloviter RS, Lowenstein DH. Heat shock protein expression in vulnerable cells of the rat hippocampus as an indicator of excitation-induced neuronal stress. J Neurosci. 1992;12:3004–3009. doi: 10.1523/JNEUROSCI.12-08-03004.1992. [DOI] [PMC free article] [PubMed] [Google Scholar]
- Sng JC, Taniura H, Yoneda Y. Histone modifications in kainate-induced status epilepticus. Eur J Neurosci. 2006;23:1269–1282. doi: 10.1111/j.1460-9568.2006.04641.x. [DOI] [PubMed] [Google Scholar]
- Solier S, Sordet O, Kohn KW, Pommier Y. Death receptor-induced activation of the Chk2- and histone H2AX-associated DNA damage response pathways. Mol Cell Biol. 2009;29:68–82. doi: 10.1128/MCB.00581-08. [DOI] [PMC free article] [PubMed] [Google Scholar]
- Taniura H, Sng JC, Yoneda Y. Histone modifications in status epilepticus induced by kainate. Histol Histopathol. 2006;21:785–791. doi: 10.14670/HH-21.785. [DOI] [PubMed] [Google Scholar]
- Wong ML, Weiss SR, Gold PW, Doi SQ, Banerjee S, Licinio J, Lad R, Post RM, Smith MA. Induction of constitutive heat shock protein 73 mRNA in the dentate gyrus by seizures. Brain Res Mol Brain Res. 1992;13:19–25. doi: 10.1016/0169-328x(92)90040-i. [DOI] [PubMed] [Google Scholar]
- Wyllie AH. Glucocorticoid-induced thymocyte apoptosis is associated with endogenous endonuclease activation. Nature. 1980;284:555–556. doi: 10.1038/284555a0. [DOI] [PubMed] [Google Scholar]
- Yang ES, Wang H, Jiang G, Nowsheen S, Fu A, Hallahan DE, Xia F. Lithium-mediated protection of hippocampal cells involves enhancement of DNA-PK-dependent repair in mice. J Clin Invest. 2009;119:1124–1135. doi: 10.1172/JCI34051. [DOI] [PMC free article] [PubMed] [Google Scholar]