

Abstract
Approximately 200 samples of rice (including white, brown, red, black, basmati and jasmine, as well as wild rice) from several different countries, including the United States, Canada, Pakistan, India and Thailand, were analysed for aflatoxins, ochratoxin A (OTA) and fumonisins by separate liquid Chromatographic methods in two different years. The mean concentrations for aflatoxin B1 (AFB1) were 0.19 and 0.17 ng g−1 with respective positive incidences of 56% and 43% (≥ the limit of detection (LOD) of 0.002 ng g−1). Twenty-three samples analysed in the second year also contained aflatoxin B2 (AFB2) at levels ≥LOD of 0.002 ng g−1 The five most contaminated samples in each year contained 1.44–7.14 ng AFB1 g−1 (year 1) and 1.45–3.48 ng AFB1 g−1 (year 2); they were mostly basmati rice from India and Pakistan and black and red rice from Thailand. The average concentrations of ochratoxin A (OTA) were 0.05 and 0.005 ng g−1 in year 1 and year 2, respectively; incidences of samples containing ≥LOD of 0.05 ng g−1 were 43% and 1%, respectively, in the 2 years. All positive OTA results were confirmed by LC-MS/MS. For fumonisins, concentrations of fumonisin B1 (FB1) averaged 4.5 ng g−1 in 15 positive samples (≥0.7 ng g−1) from year 1 (n = 99); fumonisin B2 (FB2) and fumonisin B3 (FB3) were also present (≥1 ng g−1). In the second year there was only one positive sample (14 ng g−1 FB1) out of 100 analysed. All positive FB1 results were confirmed by LC-MS/MS.
Keywords: Chromatographic analysis, high-performance liquid chromatography (HPLC), liquid chromatography/mass spectrometry (LC/MS), aflatoxins, fumonisins, ochratoxin A, rice
Introduction
Aflatoxins are the most important human mycotoxins (World Health Organization (WHO) 1998). They are synthesized by certain Aspergillus species, in particular A. flavus and A. parasiticus. Chronic exposure leads to a high risk of developing liver cancer (Wang and Tang 2004). Aflatoxins may occur in peanuts, corn (maize) and cottonseed, as well as in many other agricultural commodities (Pittet 2001). Occurrence in rice has also been reported in a number of countries (Reddy et al. 2008; Gummert et al. 2009): Sri Lanka (Bandara et al. 1991), Bangladesh (Dawlatana et al. 2002), Japan (Tabata et al. 1993), China (Liu and Gao 2006; Wang and Liu 2007), Vietnam (Nguyen et al. 2007), Thailand (Shank et al. 1972), India (Pande et al. 1990; Toteja et al. 2006; Reddy et al. 2009), the Philippines (Sales and Yoshizawa 2005), Korea (Park et al. 2004, 2005a), United Arab Emirates (Osman et al. 1999), Turkey (Aydin et al. 2010), Tunisia (Ghali et al. 2008), Nigeria (Hussaini et al. 2007), Côte d'Ivoire (Sangare-Tigori et al. 2006b), Uruguay (Piñeiro et al. 1996), Brazil (Soares and Rodriguez-Amaya 1989; de Carvalho et al. 2010), and the United States (Abbas and Shier 2009), as well as in imported/ marketed rice in the United Kingdom (Scudamore et al. 1998; Food Standards Agency (FSA) 2002), Austria (Reiter et al. 2010), Iran (Mazaheri 2009) and Sweden (Fredlund et al. 2009; Nordkvist et al. 2009). The study in Vietnam indicated that the rainy season was a major risk factor for occurrence of AFB1 in rice (Nguyen et al. 2007).
Ochratoxin A (OTA) is a mycotoxin formed by certain species of Aspergillus and Penicillium (Bayman and Baker 2006; Clark and Snedeker 2006). It is carcinogenic, nephrotoxic, teratogenic, immunotoxic and hepatotoxic and has been classified by the International Agency for Research on Cancer (IARC) as possibly carcinogenic to humans (Group 2B) (IARC 1993). OTA is found in grains and many other foodstuffs. Its occurrence in rice has been reported in Portugal (Pena et al. 2005; Juan et al. 2008a), Spain (Juan et al. 2005, 2008a; González et al. 2006), Turkey (Aydin et al. 2010), Egypt (Abd Alla 1996), Nigeria (Hussaini et al. 2007), Côte d'Ivoire (Sangare-Tigori et al. 2006a, 2006b), Morocco (Zinedine et al. 2007; Juan et al. 2008b), Tunisia (Zaied et al. 2009), Jordan (Salem and Ahmad 2010), Chile (Vega et al. 2009), Vietnam (Trung et al. 2001; Nguyen et al. 2007), Japan (Uchiyama et al. 1976; Goto et al. 2007), Korea (Park et al. 2005a, 2005b), and in rice bran used as animal feed in the UK (Scudamore et al. 1998).
Fumonisin B1 (FB1) is one of a group of mycotoxins produced mainly by Fusarium verticillioides (formerly known as F. moniliforme), a widespread fungal pathogen of corn. Also Aspergillus niger has now been found to form fumonisin B2 (FB2) (Frisvad et al. 2007). FB1 can cause two diseases of farm animals: leukoencephalomalacia in horses and porcine pulmonary oedema (Marasas 2001; Jackson 2004). In humans fumonisins are associated with oesophageal cancer. FB1 is carcinogenic, hepatotoxic and nephrotoxic in animals. The IARC designated FB1 as a possible human carcinogen (Group 2B) (IARC 1993).
Fumonisins (mainly FB1 and FB2 — there are fewer data on the less common fumonisin B3 (FB3)) are frequently found in corn and corn-based foods (Shephard et al. 1996; Weidenbörner 2001). However, they have also been found in several other foodstuffs, of which rice is the most important from a consumption point of view (Reddy et al. 2008). Fumonisins have been reported in US rice with Fusarium sheath rot and scab disease (Abbas et al. 1998; Abbas and Shier 2009), and have also been detected in rice from Korea (Chung and Kim 1995; Kim et al. 1998; Park et al. 2005a), Japan (Kushiro et al. 2008), China (Trucksess 2000), Russia (Kononenko and Burkin 2008), Argentina (Lerda et al. 2005), Italy (Cirillo et al. 2003), and Germany (Zimmer et al. 2008).
There is only one previous study on analysis of rice for all three types of mycotoxins discussed in this paper: aflatoxins, OTA and fumonisins (Park et al. 2005a). The present paper describes analyses of rice available in Canada over 2-year periods in 2007–2009 for these three groups of mycotoxins.
Materials and methods
Samples and sample preparation
The sampling strategy was based on available market share data per country (Industry Canada 2006). The majority of rice consumed by Canadians is imported from the United States and Asian countries and therefore sampling was almost equally distributed between these areas. Samples of white (long, medium and short grain), quick-cook, brown, red, black, basmati, and jasmine rice, as well as wild rice, were collected by the Canadian Food Inspection Agency from retail stores across Canada.
For the first year of the study (2007), rice samples were made of one lot with a minimum amount of approximately 1 kg. For subsequent years, rice samples, with a minimum amount of approximately 1 kg from four portions of the same lot, were made into composites. They were thoroughly mixed and an approximate 1 kg subsample was obtained using a sample splitter (Retsch RT-25). This was ground with an Ultra Centrifugal ZM 200 Retsch Mill using a 0.5 mm ring sieve, resulting in a particle size of less than 200 μm. The sample was then mixed by blending for 30 min with a 1000 W Industrial Cuisinart Stand Mixer. About 400 g were frozen and analytical sub-samples withdrawn as needed.
Aflatoxin determination
Aflatoxin B1 (AFB1), and in the second year also aflatoxin B2 (AFB2), were determined by an in-house-validated method (Tam et al. 2006), essentially the same as AOAC Official Method 2000.16 (AOAC International 2000). Briefly, 50 g of the test sample and 5 g NaCl were extracted with 250 ml methanol-water (8 + 2, v/v). The sample extract (10 ml) was diluted to 100 ml with water and cleaned-up by an immunoaffinity column (IAC) (VICAM AflaTest™ WB, Waters, Milford, MA, USA). Aflatoxins were eluted from the column with methanol, then evaporated and redissolved in 250 μl methanol-water (3.5 + 6.5, v/v). After derivatization with pyridinium hydrobromide perbromide (PBPB), they were determined by a Waters Alliance HPLC with fluorescence detection (εex = 360 nm and εem = 420 nm). The LC column (reversed phase) was a Zorbax SB-C18, 5 μm, 4.6 × 250 mm, with guard column. The mobile phase was water-methanol-acetonitrile (54.5 + 27.3 + 18.2, v/v/v) at 1 ml min−1 and the injection volume was 50 μl.
AFB1 was qualitatively confirmed in selected positive samples by the marked loss in peak area when PBPB derivatization was omitted. The method, which had previously been validated for barley cereal, was validated for rice by spiking ground brown rice with 0.25 ng g−1 for each aflatoxin (AFB1, AFB2); recoveries averaged 81% ± 5% and 83% ± 4%, respectively (n = 4). The limit of detection (LOD) and limit of quantitation (LOQ), determined by signal-to-noise ratios (S/N = 3: 1 and 10: 1, respectively) were 0.002 and 0.05 ng g−1 respectively for both AFB1 and AFB2.
Satisfactory z-scores for AFB1, AFB2, AFG1 and AFG2 as well as total aflatoxins were obtained in a Food Analysis Performance Assessment Scheme (FAPAS®) proficiency test on ground rice.
Ochratoxin A determination
OTA was determined by an in-house method previously validated for dry pasta (Ng et al. 2009), with extraction and clean-up essentially the same as AOAC Official Method 2000.03 (Entwisle et al. 2000). The main difference was the transfer to a Waters Acquity Ultra Performance LC (UPLC®) instrument. Briefly, 25 g of test sample were extracted with 100 ml of acetonitrile-water (6 + 4, v/v). The extract was filtered through Whatman #4 filter paper and 5 ml diluted with 55 ml phosphate-buffered saline (PBS) solution. This was then filtered through a Whatman 934-AH microfibre glass filter under vacuum and 48 ml of the filtrate applied to an IAC containing antibodies specific for OTA (VICAM OchraTest™). Prior to use the columns were pre-rinsed with 3 × 1 ml deionized water, 3 × 1 ml methanol, then 20 ml PBS. OTA was eluted from the column into a silanized vial with 4 × 1 ml methanol, which was evaporated and the residue redissolved in 500 μl of methanol-water-acetic acid (30 + 70 + 1, v/v/v). The injection volume was 10 μl on a Acquity UPLC® BEH C18 1.7 μm, 2.1 × 50 mm column (Waters) at 35°C using a gradient of 0.083 M H3PO4-CH3CN (1 + 1, v/v) and methanol, with fluorescence detection (εex = 330 nm and εem = 470 nm).
The method was validated by spiking rice and obtaining recoveries of 86% ± 15%, 89% ± 6% and 88% ± 4% at 0.5, 3.0 and 5 ng g−1 spiking levels (n = 5), respectively. The LOD was 0.05 ng g−1 (S/N = 3: 1) and the LOQ was 0.2 ng g−1 (S/N = 10: 1).
For confirmation of OTA in positive rice samples, a Waters Acquity UPLC® coupled to a Waters Quattro Premier tandem mass spectrometer was used with the same extract (Tam et al. 2011). The UPLC was equipped with a Waters BEH C18 column (1.7 μm, 2.1 × 50 mm). The mobile phase consisted of a variable mixture of solutions A (water-formic acid, 99: 1 v/v) and B (acetonitrile-formic acid, 99: 1 v/v) at a flow rate of 0.3 ml min−1. The linear gradient programme was set to provide 90% A at 0 min, 10% A at 7 min and 90% A from 8 to 10 min. The column temperature was 30°C and the injection volume was 20 μl. The mass spectrometer was operated in the positive electrospray ionization mode with argon as the collision gas at a flow rate of 0.3 ml min−1. Multiple-reaction monitoring (MRM) mode was configured to monitor the following mass-to-charge ratio (m/z) transitions: both 404 → 239 (collision energy 25 eV) and 404 → 358 (collision energy 15 eV) for OTA. The second transition (m/z 404 → 358) was used for confirmation. The ion ratio for 404 → 239/404 → 358 was 1.9 (range ± 20%), which was determined from a standard and met the minimum requirement for the identification and confirmation of OTA in samples.
Fumonisins
Fumonisins B1, B2 and B3 (FB1, FB2 and FB3) were determined in rice by the method of Oh et al. (2009), with some modifications. A 10 g sample plus 1 g NaCl was submerged in 50 ml water for 30 min (Kushiro et al. 2008; Awaludin et al. 2009) and extraction was completed by blending (Polytron) for 3 min with 50 ml acetonitrile-methanol (1 + 1, v/v). After centrifuging at 2000 rpm for 10 min and filtering (Whatman #1), 40 ml PBS (pH 7) were added to a 10 ml aliquot of extract. A total of 10 ml of this solution was added to a VICAM FumoniTest™ IAC, previously conditioned with 5 ml PBS. The column was washed with 10 ml PBS, then the fumonisins were eluted with 2 × 0.75 ml methanol-water (8 + 2, v/v), which was evaporated to dryness under nitrogen at 60°C. The residue was dissolved in 500 μl acetonitrile-water (1 + 1, v/v) and filtered (Teflon (PTFE), 0.45 μm). LC pre-column derivatization for fluorescence determination was with o-phthaldialdehyde (OPA)/2-mercaptoethanol (ME) reagent. LC was modified by using injection volumes of 10 μl sample + 10 μl OPA/ME on a Zorbax Eclipse Plus C18 1.8 μm, 4.6 × 50 mm column (Agilent Technologies) at 35°C. Method validation by spiking triplicate blank samples of ground white rice showed recoveries for FB1, FB2 and FB3 of 82% ± 5%, 78% ± 12% and 71% ± 18%, respectively, at 10 ng g−1; 77% ± 3%, 65% ± 3% and 74% ± 4%, respectively, at 100 ng g−1; and 78% ± 2%, 74% ± 3% and 84% ± 4%, respectively, at 500 ng g−1. Spike recoveries were >89% for arborio, basmati, brown, Thai and wild rice samples. The LODs (S/N = 3: 1) were 0.7, 1 and 1 ng g−1 for FB1, FB2 and FB3, respectively and LOQs (S/N = 10: 1) were 2, 4 and 4 ng g−1, respectively.
Confirmation of the identity of the fumonisins and some of the quantitations were done by LC-MS/MS. The LC was an Agilent 1200 HPLC system (Agilent Technologies); Phenomenex (Torrance, CA, USA) Gemini-NX C18, 3 μm, 2 × 150 mm at 15°C; injection volume 10 μl; mobile phase A: 0.1% formic acid in LC-MS-grade water; mobile phase B: 0.1% formic acid in acetonitrile-methanol (1 + 1, v/v); the gradient was 15% B from zero to 3 min (flow rate = 0.175 ml min−1), ramped to 60% B from 3 to 8 min, held for 12 min, returned to 15% B at 21 min (flow rate-0.250 ml min−1), held for 4 min, then 15% B at 26 min (flow rate = 0.175 ml min−1).
MS/MS instrumentation and conditions were the following: Waters Quattro-Ultima triple quadrupole tandem mass spectrometer (Milford, MA, USA) in positive electrospray ionization mode; the capillary voltage was 3.5 kV, cone voltage 35 V and source temperature 120°C. Desolvation temperature was 350°C, desolvation gas flow 700 lh−1, cone gas flow 50 lh−1, multiplier voltage 625 V, and collision cell pressure 3.0 × 10⁻³ mbar (Ar). Resolution for the first and the last quadrupole mass analysers was 1.0–1.2 mass units at base. For FB1, MRM transitions were m/z 722 → 334 (collision energy = 37 eV), 722 → 352 (35 eV) (quantitation ion transition) and 722 → 704 (27 eV); ion ratios for 722 → 352/722 → 334 and 722 → 352/722 → 704 were 1.05 (range ± 25%) and 1.15% ± 25%, respectively. For FB2 and FB3, MRM transitions were 706 → 336 (collision energy = 35 eV) (quantitation ion transition), 706 → 354 (35 eV) and 706 → 688 (30 eV); ion ratios for 706 → 336/706 → 354 were 3.6% ± 25% (FB2 and FB3) and for 706 → 336/706 → 688 were 3.6% ± 25% (FB2) and 2.6 ± 25% (FB3). The dwell time for each transition was set at 80 ms with an inter-channel delay time of 20 ms. The instrumental LOD was approximately 0.05 ng ml−1 for each fumonisin.
Results and discussion
Aflatoxins
In the first year (2008), only AFB1 was analysed and the mean for AFB1 was 0.19 ng g−1 (n = 99), with 56 of the samples positive (≥LOD). The mean AFB1 of the positive samples was 0.34 ng g−1. The highest AFB1 contamination was in a sample of brown basmati rice from India (7.1 ng g−1).
In the second year (2009), 100 composites of rice were analysed for AFB1 and AFB2. For AFB1, the overall mean was 0.17 ng g−1, and the mean was 0.39 ng g−1 for the 43% positive samples (≥LOD). Twenty-three samples analysed in the second year also contained AFB2 at levels from 0.002 to 0.63 ng g−1, usually together with AFB1. Typically, the ratio of AFB2/AFB1 concentration was approximately 0.1 in a naturally contaminated sample. The normal distribution plot of the yearly distribution of AFB1 in Canadian retail rice is illustrated in Figure 1.
Figure 1.
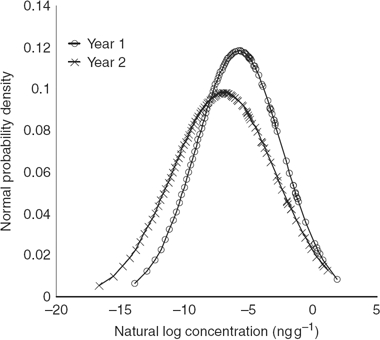
Yearly variation of AFB1 in Canadian retail rice, expressed as a normal distribution plot. There were not enough positives in both years to conduct year-to-year comparisons for the other two mycotoxins.
It demonstrates that based on a t-test there is no significant difference at the 99% confidence level between the average and spread (distribution) of aflatoxin contamination in rice between the 2 years.
The five most contaminated samples in each year contained 1.44–7.14 ng g−1 of AFB1 (year 1) and 1.45–3.48 ng g−1 of AFB1 (year 2); they were mostly basmati rice from India and Pakistan, and black and red rice from Thailand.
The findings are comparable with surveys of rice imported into European countries: rice from the UK (Scudamore et al. 1998; FSA 2002), Austria (Reiter et al. 2010) and Sweden (Fredlund et al. 2009; Nordkvist et al. 2009) was found to be commonly contaminated with AFB1.
Ochratoxin A
In the first year (2007), individual results for OTA were corrected by subtracting 0.13 ng g−1 due to a contamination problem with the reagent blank. The average amount of OTA detected in the 100 rice samples was 0.05 ng g−1. Four rice samples had OTA concentrations greater than the LOQ (0.2 ng g−1); three were from the United States (Calrose, brown and sushi rice) and one from India (brown basmati rice). The mean of positives was 0.11 ng g−1 for the 43 rice samples, with OTA levels detected at or above the LOD (0.05 ng g−1).
A second survey (2008) included 99 rice samples. The overall mean for OTA was below the LOD. The only positive sample (≥LOD) was a black glutinous rice from Thailand, which contained 0.49 ng OTA g−1. The distribution of OTA in rice is quite different between each survey year, but the overall contamination of rice remained well below 5 ng g−1, the proposed Health Canada maximum limit (ML) for OTA in raw cereal grains, including rice, and below 0.5 ng g−1, the proposed Health Canada ML for OTA in baby foods and processed cereal-based foods for infants and young children (Health Canada 2009).
Fumonisins
In the first survey (2008), 15/99 samples were positive (mean = 4.5 ng FB1 g−1). FB2 and FB3 were also found (up to 2 and 1 ng g−1, respectively). Table 1 shows the 15 rice samples found positive by LC-fluorescence and which were confirmed by LC-MS/MS. For a few samples, because of its higher sensitivity and specificity, the LC-MS/MS quantitation is reported, especially when the concentration was above the LC-fluorescence result. A long grain brown rice, a black glutinous rice and a brown basmati rice had the highest FB1 contamination (9–11 ng g−1). Nine of the 15 positive rice samples originated from the United States. In the second survey (2009), there was only one positive (14 ng FB1 g−1) in the 100 rice samples analysed: a black sweet rice from Thailand. The finding was confirmed by LC-MS/MS.
Table 1.
Samples with a positive fumonisin contamination in rice collected in 2008.a
| Concentration (ng g−1) |
||||
|---|---|---|---|---|
| Rice sample | FB1 | FB2 | FB3 | Fumonisins (total) |
| Enriched pre-cooked | 1b | 0 | 0 | 1 |
| Wild mix | 2 | 0 | 0 | 2 |
| Long-grain brown | 2 | 0 | 0 | 2 |
| Long grain white | 2 | 0 | 0 | 2 |
| Organic white long grain | 2 | 0 | 0 | 2 |
| Medium grain Calrose | 3b | 0 | 0 | 3 |
| Whole grain brown | 3 | 0 | 0 | 3 |
| Organic brown and wild | 4 | 0 | 0 | 4 |
| Wild rice and brown | 4 | 0 | 0 | 4 |
| Medium grain Calrose | 5 | 0 | 0 | 5 |
| Sticky | 5 | 0 | 0 | 5 |
| Organic brown basmati | 5 | 1b | 1b | 7 |
| Brown basmati natural | 9 | 1b | 1b | 11 |
| Black glutinous | 9b | 2b | 1b | 12 |
| Long-grain brown | 11 | 2 | 1b | 14 |
Notes: aOnly one positive (14 ng g−1) out of 100 samples was found in the 2009 survey.
bLC-MS/MS result.
LC-fluorescence and LC-MS/MS data are reported.
Since fumonisins are known to be apparently unstable in rice flour (Kim et al. 2002), it was desirable to check whether they survived unchanged in ground rice at −30°C during the 15–24 weeks between surveys in the present study. It was found that fumonisins were stable on frozen storage of ground rice, so this does not explain the lower incidence in rice in the second survey. Different weather patterns and storage conditions are factors that could explain the lower incidence of fumonisins in the rice collected in 2009. We also evaluated the stability of fumonisins after spiking brown (25 days), Thai (18 h) and sticky rice (18 h). No significant loss of fumonisins was measured.
Seventeen retail heat processed rice samples (four rice cakes, five rice crisps, three adult breakfast cereals, four infant cereals and one rice pasta) were analysed, but no detectable FB1, FB2 and FB3 contamination was found. FB1 was found previously in rice cake and rice snacks in Korea (Kim et al. 1998), indicating stability to food processing.
Multitoxins
Although the rice surveys were for 2 years, only the 2008 rice survey included analysis of the three mycotoxins for a specific rice sample. Figure 2 illustrates the results for each mycotoxin. The concentration of FB1 is generally the highest, especially in black rice. The black rice sample was positive for the three mycotoxins. Generally, basmati rice and brown rice contained AFB1. Although the OTA concentration was highest in black rice, the concentration was low and often negligible in other rices analysed in this survey. Table 2 shows the overall incidences for each rice sample collected in 2008. Generally, the incidences are higher for AFB1.
Figure 2.
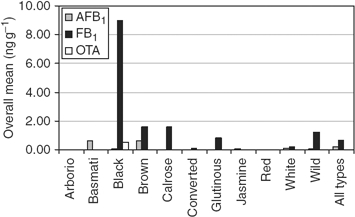
Overall means of AFB1, FB1 and OTA for each type of rice sample collected in 2008. Except where colour is indicated, rices are white.
Table 2.
Overall incidences (≥LOD) of AFB1, OTA and FB1 for each type of rice sample collected in 2008.
| Incidence |
|||
|---|---|---|---|
| Rice type | AFB1 | OTA | FB1 |
| Arborioa | 0/9 | 0/9 | 0/9 |
| Basmatia | 9/9 | 0/9 | 0/9 |
| Black | 1/1 | 1/1 | 1/1 |
| Brown | 11/19 | 0/19 | 5/19 |
| Calrosea | 2/5 | 0/5 | 2/5 |
| Converteda | 7/9 | 0/9 | 1/9 |
| Glutinousa | 1/6 | 0/6 | 1/6 |
| Jasminea | 8/12 | 0/12 | 0/12 |
| Red | 1/2 | 0/2 | 0/2 |
| Whitea | 12/19 | 0/19 | 2/19 |
| Wildb | 4/8 | 0/8 | 3/8 |
| All rices | 56/99 | 1/99 | 15/99 |
Notes: a White rices.
b May be mixed with other types of rice.
The arithmetic mean (positives and overall) of each mycotoxin are summarised in Table 3 for each collection year. Although the aflatoxin results are similar for both years, those of OTA and FB1 are significantly different between each sampling year.
Table 3.
Natural occurrence of aflatoxins, ochratoxin A and fumonisins in rice for each sample collection year.
| 2007 (n = 100) |
2008 (n = 99) |
2009 (n = 100) |
|||||||
|---|---|---|---|---|---|---|---|---|---|
| n (p) | Mean (p) | Mean (o) | n (p) | Mean (p) | Mean (o) | n (p) | Mean (p) | Mean (o) | |
| AFB1 | – | – | – | 56 | 0.34 | 0.19 | 43 | 0.39 | 0.17 |
| AFB2 | – | – | – | – | – | – | 23 | 0.08 | 0.02 |
| OTA | 43 | 0.11 | 0.05 | 1 | 0.49 | 0.005 | – | – | – |
| FB1 | – | – | – | 15 | 4.5 | 0.68 | 1 | 14 | 0.14 |
| FB2 | – | – | – | 4 | 1.5 | 0.06 | 1 | 2.9 | 0.03 |
| FB3 | – | – | – | 4 | 1.0 | 0.04 | 1 | 1.6 | 0.02 |
Notes: n (p), number of positives (≥LOD); mean (p), mean of positives (ng g−1); mean (o), overall mean (ng g−1). –, no data available.
Table 4 shows the overall data (both years) for each mycotoxin. Although the highest incidence of positives was for AFB1, the FB1 concentrations are highest overall. The incidence of AFB1 was more than twice that of OTA.
Table 4.
Two-year surveys of rice sold in Canada for aflatoxin B1, ochratoxin A and fumonisin B1.
| All rice (n = 199) | AFB1 | OTA | FB1 |
|---|---|---|---|
| Maximum concentration (ng g−1) | 7.1 | 0.49 | 14 |
| Number of positives (≥LOD) | 99 | 44 | 16 |
| Mean of positives (ng g−1) | 0.36 | 0.12 | 5.1 |
| Overall mean (ng g−1) | 0.18 | 0.03 | 0.41 |
Rice can be contaminated with field fungi (Fusarium species), and be spoiled with storage fungi (Aspergillus and Penicillium) (Park et al. 2005a). Based on the fairly consistent aflatoxin incidence found in rice (Table 3), contamination seems more likely to have occurred in storage. As FB1 concentrations attain higher levels than the other mycotoxins, previous contamination with field fungi (Fusarium) is also indicated.
In conclusion, the survey results will contribute to future Canadian risk assessments for each of these mycotoxins in food.
Acknowledgements
The authors thank the Canadian Food Inspection Agency for collecting the rice samples.
References
- Abbas HK, Cartwright RD, Shier WT, Abouzied MM, Bird CB, Rice LG, Ross PF, Sciumbato GL, Meredith FI. Natural occurrence of fumonisins in rice with Fusarium sheath rot disease. Plant Dis. 1998;82:22–25. doi: 10.1094/PDIS.1998.82.1.22. [DOI] [PubMed] [Google Scholar]
- Abbas HK, Shier WT. Mycotoxin contamination of agricultural products in the southern United States and approaches to reducing it from pre-harvest to final food products. In: Appell M, Kendra DF, Trucksess MW, editors. Mycotoxin prevention and control in agriculture. Washington, DC: American Chemical Society; 2009. pp. 37–58. [Google Scholar]
- Abd Alla EAM. Natural occurrence of ochratoxin A and citrinin in foodstuffs. Mycotox Res. 1996;12:41–44. doi: 10.1007/BF03192079. [DOI] [PubMed] [Google Scholar]
- AOAC International. Aflatoxins in baby food. Official Method. 2000;2000:16. [Google Scholar]
- Awaludin N, Nagata R, Kawasaki T, Kushiro M. Preparation of an in-house reference material containing fumonisins in Thai rice and matrix extension of the analytical method for Japanese rice. Toxins. 2009;1:188–195. doi: 10.3390/toxins1020188. [DOI] [PMC free article] [PubMed] [Google Scholar]
- Aydin A, Aksu H, Gunsen U. Mycotoxin levels and incidence of mould in Turkish rice. 2010. Environ Monit Assess. Published online: 09 September 2010. [DOI] [PubMed]
- Bandara JMRS, Vithanege AK, Bean GA. Occurrence of aflatoxins in parboiled rice in Sri Lanka. Mycopathologia. 1991;116:65–70. doi: 10.1007/BF00436366. [DOI] [PubMed] [Google Scholar]
- Bayman P, Baker JL. Ochratoxins: a global perspective. Mycopathologia. 2006;162:215–223. doi: 10.1007/s11046-006-0055-4. [DOI] [PubMed] [Google Scholar]
- Chung SH, Kim YB. Natural occurrence of fumonisin B1 in Korean corn and rough rice. Foods Biotechnol. 1995;4:212–216. [Google Scholar]
- Cirillo T, Ritieni A, Visone M, Cocchieri RA. Evaluation of conventional and organic Italian foodstuffs for deoxynivalenol and fumonisins B1 and B2. J Agric Food Chem. 2003;51:8128–8131. doi: 10.1021/jf030203h. [DOI] [PubMed] [Google Scholar]
- Clark HA, Snedeker SM. Ochratoxin A: its cancer risk and potential for exposure. J Toxicol Environ Health B. 2006;9:265–296. doi: 10.1080/15287390500195570. [DOI] [PubMed] [Google Scholar]
- Dawlatana M, Coker RD, Nagler MJ, Wild CP, Hassan MS, Blunden G. The occurrence of mycotoxins in key commodities in Bangladesh: surveillance results from 1993 to 1995. J Nat Toxins. 2002;11:379–386. [PubMed] [Google Scholar]
- de Carvalho RA, Batista LR, Prado G, de Oliveira BR, da Silva DM. Incidencia de fungos toxigênicos e aflatoxinas em arroz. Cienc Agrotecnol. 2010;34:946–952. [Google Scholar]
- Entwisle AC, Williams AC, Mann PJ, Slack PT, Gilbert J. Liquid chromatographic method with immunoaffinity column cleanup for determination of ochratoxin A in barley: collaborative study. J AOAC Int. 2000;83:1377–1383. [PubMed] [Google Scholar]
- Food Standards Agency (FSA) Food Survey Information Sheet No. 22/02. Survey of retail rice for a range of mycotoxins. London (UK): FSA; 2002. [Google Scholar]
- Fredlund E, Thim A-M, Gidlund A, Brostedt S, Nyberg M, Olsen M. Moulds and mycotoxins in rice from the Swedish retail market. Food Addit Contam A Chem Anal Control Expo Risk Assess. 2009;26:527–533. doi: 10.1080/02652030802562912. [DOI] [PubMed] [Google Scholar]
- Frisvad JC, Smedsgaard J, Samson RA, Larsen TO, Thrane U. Fumonisin B2 production by Aspergillus niger. J Agric Food Chem. 2007;55:9727–9732. doi: 10.1021/jf0718906. [DOI] [PubMed] [Google Scholar]
- Ghali R, Hmaissia-Khlifa K, Ghorbel H, Maaroufi K, Hedili A. Incidence of aflatoxins, ochratoxin A and zearalenone in Tunisian foods. Food Contr. 2008;19:921–924. [Google Scholar]
- González L, Juan C, Soriano JM, Moltó JC, Mañes J. Occurrence and daily intake of ochratoxin A of organic and non-organic rice and rice products. Int J Food Microbiol. 2006;107:223–227. doi: 10.1016/j.ijfoodmicro.2005.10.001. [DOI] [PubMed] [Google Scholar]
- Goto T, Otsuki K, Umeda M, Nakamura S, Bandoh S. Single laboratory validation for method of analysis for ochratoxin A in rice and buckwheat. Mycotoxins. 2007;57:81–86. [Google Scholar]
- Gummert M, Balingbing CB, Barry G, Estevez LA. Management options, technologies and strategies for minimised mycotoxin contamination of rice. World Mycotox J. 2009;2:151–159. [Google Scholar]
- Health Canada. Information document on Health Canada's proposed maximum limits (standards) for the presence of the mycotoxin ochratoxin A in foods – 2009 Health Canada consultation document; [cited 2010 Oct 15] 2009. Available from: http://www.hc-sc.gc.ca/fn-an/consult/limits-max-seuils/myco_consult_ochra-eng.php/
- Hussaini AM, Timothy AG, Olufunmilayo HA, Ezekiel AS, Godwin HO. Fungi and some mycotoxins contaminating rice (Oryza sativa) in Niger State, Nigeria. Afr J Biotechnol. 2007;6:99–108. [Google Scholar]
- Industry Canada. Trade data online; [cited 2006 Oct 15] 2006. Available from: http://www.ic.gc.ca/eic/site/tdo-dcd.nsf/eng/Home/
- International Agency for Research on Cancer (IARC) Monographs on the evaluation of carcinogenic risks to humans Number 56. Lyon (France): IARC Press; 1993. pp. 489–521. [Google Scholar]
- Jackson L. Fumonisins. In: Nagan M, Olsen M, editors. Mycotoxins in food: detection and control. Cambridge (UK): Woodhead; 2004. pp. 367–405. [Google Scholar]
- Juan C, González L, Soriano JM, Moltó JC, Mañes J. Accelerated solvent extraction of ochratoxin A from rice samples. J Agric Food Chem. 2005;53:9348–9351. doi: 10.1021/jf051560q. [DOI] [PubMed] [Google Scholar]
- Juan C, Moltó JC, Lino CM, Mañes J. Determination of ochratoxin A in organic and non-organic cereals and cereal products from Spain and Portugal. Food Chem. 2008a;107:525–530. [Google Scholar]
- Juan C, Zinedine A, Idrissi L, Mañes J. Ochratoxin A in rice on the Moroccan retail market. Int J Food Microbiol. 2008b;126:83–85. doi: 10.1016/j.ijfoodmicro.2008.05.005. [DOI] [PubMed] [Google Scholar]
- Kim E-K, Kim Y-B, Shon D-H, Ryu D, Chung S-H. Natural occurrence of fumonisin B1 in Korean rice and its processed foods by enzyme-linked immunosorbent assay. Food Sci Biotechnol. 1998;7:221–224. [Google Scholar]
- Kim E-K, Scott PM, Lau BP-Y, Lewis DA. Extraction of fumonisins B1 and B2 from white rice flour and their stability in white rice flour, cornstarch, cornmeal, and glucose. J Agric Food Chem. 2002;50:3614–3620. doi: 10.1021/jf020058s. [DOI] [PubMed] [Google Scholar]
- Kononenko GP, Burkin AA. Fusariotoxins content in maize and rice grain harvested in the main regions of cultivation in the Russian Federation. 2008. pp. 88–91. Sel'skokhozyaistvennaya Biologiya no. 5 [in Russian]
- Kushiro M, Nagata R, Nakagawa H, Nagashima H. Liquid chromatographic detection of fumonisins in rice seed. Rep Natl Food Res Inst. no. 2008;72:37–44. [Google Scholar]
- Lerda D, Biaggi Bistoni M, Peralta N, Ychari S, Vazquez M, Bosio G. Fumonisins in foods from Cordoba (Argentina), presence and genotoxicity. Food Chem Toxicol. 2005;43:691–698. doi: 10.1016/j.fct.2004.12.019. [DOI] [PubMed] [Google Scholar]
- Liu Z, Gao J, Yu J. Aflatoxins in stored maize and rice grains in Liaoning Province, China. J Stored Prod Res. 2006;42:468–479. [Google Scholar]
- Marasas WFO. Discovery and occurrence of the fumonisins: a historical perspective. Environ Health Persp. 2001;109(Suppl. 2):239–243. doi: 10.1289/ehp.01109s2239. [DOI] [PMC free article] [PubMed] [Google Scholar]
- Mazaheri M. Determination of aflatoxins in imported rice to Iran. Food Chem Toxicol. 2009;47:2064–2066. doi: 10.1016/j.fct.2009.05.027. [DOI] [PubMed] [Google Scholar]
- Ng W, Mankotia M, Pantazopoulos P, Neil RJ, Scott PM, Lau BP-Y. Survey of dry pasta for ochratoxin A in Canada. J Food Prot. 2009;72:890–893. doi: 10.4315/0362-028x-72.4.890. [DOI] [PubMed] [Google Scholar]
- Nguyen MT, Tozlovanu M, Tran TL, Pfohl-Leszkowicz A. Occurrence of aflatoxin B1, citrinin and ochratoxin A in rice in five provinces of the central region of Vietnam. Food Chem. 2007;105:42–17. [Google Scholar]
- Nordkvist E, Stepinska A, Haeggblom A. Aflatoxin contamination of consumer milk caused by contaminated rice by-products in compound cattle feed. J Sci Food Agric. 2009;89:359–361. [Google Scholar]
- Oh KS, Scott PM, Chung S-H. Incomplete recoveries of fumonisins present in naturally contaminated corn foods from an immunoaffinity column. J AOAC Int. 2009;92:496–501. erratum 92 203A. [PubMed] [Google Scholar]
- Osman NA, Abdelgadir AM, Moss MO, Bener A. Aflatoxin contamination of rice in the United Arab Emirates. Mycotoxin Res. 1999;15:39–44. doi: 10.1007/BF02945213. [DOI] [PubMed] [Google Scholar]
- Pande N, Saxena J, Pandey H. Natural occurrence of mycotoxins in some cereals. Mycoses. 1990;33:126–128. doi: 10.1111/myc.1990.33.3.126. [DOI] [PubMed] [Google Scholar]
- Park JW, Choi S-Y, Hwang H-J, Kim Y-B. Fungal mycoflora and mycotoxins in Korean polished rice destined for humans. Int J Food Microbiol. 2005a;103:305–314. doi: 10.1016/j.ijfoodmicro.2005.02.001. [DOI] [PubMed] [Google Scholar]
- Park JW, Chung S-H, Lee C, Kim Y-B. Fate of ochratoxin A during cooking of naturally contaminated polished rice. J Food Protect. 2005b;68:2107–2111. doi: 10.4315/0362-028x-68.10.2107. [DOI] [PubMed] [Google Scholar]
- Park JW, Kim EK, Kim YB. Estimation of the daily exposure of Koreans to aflatoxin B1 through food consumption. Food Addit Contam A. 2004;21:70–75. doi: 10.1080/02652030310001622782. [DOI] [PubMed] [Google Scholar]
- Pena A, Cerejo F, Lino C, Silveira I. Determination of ochratoxin A in Portuguese rice samples by high performance liquid chromatography with fluorescence detection. Anal Bioanal Chem. 2005;382:1288–1293. doi: 10.1007/s00216-005-3254-9. [DOI] [PubMed] [Google Scholar]
- Piñeiro M, Dawson R, Costarrica ML. Monitoring program for mycotoxin contamination in Uruguayan food and feeds. Nat Toxins. 1996;4:242–245. doi: 10.1002/(SICI)(1996)4:5<242::AID-NT7>3.0.CO;2-A. [DOI] [PubMed] [Google Scholar]
- Pittet A. Natural occurrence of mycotoxins in foods and feeds: a decade in review. In: de Koe WJ, Samson RA, van Egmond HP, Gilbert J, Sabino M, editors. Mycotoxins and phycotoxins in perspective at the turn of the millennium. Wageningen (the Netherlands): WJ de Koe; 2001. pp. 153–172. [Google Scholar]
- Reddy KRN, Reddy CS, Abbas CS, Abel CA, Muralidharan K. Mycotoxigenic fungi, mycotoxins and management of rice grains. Toxin Rev. 2008;27:287–317. [Google Scholar]
- Reddy KRN, Reddy CS, Muralidharan K. Detection of Aspergillus spp. and aflatoxin B1 in rice in India. Food Microbiol. 2009;26:27–31. doi: 10.1016/j.fm.2008.07.013. [DOI] [PubMed] [Google Scholar]
- Reiter EV, Vouk F, Böhm J, Razzazi-Fazeli E. Aflatoxins in rice — a limited survey of products marketed in Austria. Food Contr. 2010;21:988–991. [Google Scholar]
- Salem NM, Ahmad R. Mycotoxins in food from Jordan: Preliminary survey. Food Contr. 2010;21:1099–1103. [Google Scholar]
- Sales A, Yoshizawa T. Updated profile of aflatoxin and Aspergillus section Flavi contamination in rice and its by-products from the Philippines. Food Addit Contam A. 2005;22:429–436. doi: 10.1080/02652030500058387. [DOI] [PubMed] [Google Scholar]
- Sangare-Tigori B, Dem AA, Kouadio HJ, Betbeder AM, Dano DS, Moukha S, Creppy EE. Preliminary survey of ochratoxin A in millet, maize, rice and peanuts in Côte d'Ivoire from 1998 to 2002. Hum Exp Toxicol. 2006a;25:211–216. doi: 10.1191/0960327106ht605oa. [DOI] [PubMed] [Google Scholar]
- Sangare-Tigori B, Moukha S, Kouadio HJ, Betbeder AM, Dano DS, Creppy EE. Co-occurrence of aflatoxin B1, fumonisin B1, ochratoxin A and zearalenone in cereals and peanuts from Côte d'Ivoire. Food Addit Contam A. 2006b;23:1000–1007. doi: 10.1080/02652030500415686. [DOI] [PubMed] [Google Scholar]
- Scudamore KA, Nawaz S, Hetmanski MT, Rainbird SC. Mycotoxins in ingredients of animal feeding stuffs: III. Determination of mycotoxins in rice bran. Food Addit Contam A. 1998;15:185–194. doi: 10.1080/02652039809374629. [DOI] [PubMed] [Google Scholar]
- Shank RC, Bhamarapravati N, Gordon JE, Wogan GN. Dietary aflatoxins and human liver cancer. IV. Incidence of primary liver cancer in two municipal populations of Thailand. Food Cosmet Toxicol. 1972;10:171–179. doi: 10.1016/s0015-6264(72)80195-0. [DOI] [PubMed] [Google Scholar]
- Shephard GS, Thiel PG, Stockenström S, Sydenham EW. Worldwide survey of fumonisin contamination of corn and corn-based products. J AOAC Int. 1996;79:671–687. [PubMed] [Google Scholar]
- Soares LM, Rodriguez-Amaya DB. Survey of aflatoxins, ochratoxin A, zearalenone, and sterigmatocystin in some Brazilian foods by using multi-toxin thin-layer chromatographic method. J Assoc Off Anal Chem. 1989;72:22–26. [PubMed] [Google Scholar]
- Tabata S, Kamimura H, Ibe A, Hashimoto H, Iida M, Tamura Y, Nishima T. Aflatoxin contamination in foods and foodstuffs in Tokyo: 1986–1990. J AOAC Int. 1993;76:32–35. [PubMed] [Google Scholar]
- Tam J, Mankotia M, Mably M, Pantazopoulos P, Neil RJ, Calway P, Scott PM. Survey of breakfast and infant cereals for aflatoxins B1, B2, G1 and G2. Food Addit Contam A. 2006;23:693–699. doi: 10.1080/02652030600627230. [DOI] [PubMed] [Google Scholar]
- Tam J, Pantazopoulos P, Scott PM, Moisey J, Dabeka RW, Richard IDK. An application of isotope dilution mass spectrometry: determination of ochratoxin A in the Canadian total diet study. Food Addit Contam A. 2011;28:754–761. doi: 10.1080/19440049.2010.504750. [DOI] [PMC free article] [PubMed] [Google Scholar]
- Toteja GS, Mukherjee A, Diwakar S, Singh P, Saxena BN, Sinha KK, Sinha AK, Kumar N, Nagaraja KV, Bai G, et al. Aflatoxin B1 contamination of parboiled rice samples collected from different states of India: a multi-centre study. Food Addit Contam A. 2006;23:411–414. doi: 10.1080/02652030500442490. [DOI] [PubMed] [Google Scholar]
- Trucksess MW. Joint Mycotoxin Committee Report. J AOAC Int. 2000;83:536–541. [Google Scholar]
- Trung TS, Bailly JD, Querin A, Le Bars P, Guerre P. Fungal contamination of rice from South Vietnam, mycotoxigenesis of selected strains and residues in rice. Rev Méd Vét. 2001;152:555–560. [Google Scholar]
- Uchiyama M, Isohata E, Yakeda Y. A case report on the detection of ochratoxin A from rice. J Food Hyg Soc Japan. 1976;17:103–104. [Google Scholar]
- Vega M, Muñoz K, Sepúlveda C, Aranda M, Campos V, Villegas R, Villarroel O. Solid-phase extraction and HPLC determination of ochratoxin A in cereals products on Chilean market. Food Contr. 2009;20:631–634. [Google Scholar]
- Wang J, Liu XM. Contamination of aflatoxins in different kinds of food in China. Biomed Environ Sci. 2007;20:483–487. [PubMed] [Google Scholar]
- Wang J-S, Tang L. Epidemiology of aflatoxin exposure and human liver cancer. J Toxicol Toxin Rev. 2004;23:249–271. [Google Scholar]
- Weidenbörner M. Foods and fumonisins. Eur Food Res Technol. 2001;212:262–273. [Google Scholar]
- World Health Organization (WHO) Aflatoxins. 1998. In: Safety evaluation of certain food additives and contaminants. WHO Food Additive Series No. 40. Report of the 49th Meeting of the Joint FAO/WHO Expert Committee on Food Additives (JECFA). Geneva (Switzerland): WHO; p. 359–468.
- Zaied C, Abid S, Zorgui L, Bouaziz C, Chouchane S, Jomaa M, Bacha H. Natural occurrence of ochratoxin A in Tunisian cereals. Food Contr. 2009;20:218–222. [Google Scholar]
- Zimmer I, Usleber E, Klaffke H, Weber R, Majerus P, Otteneder H, Gareis M, Dietrich R, Märtlbauer E. Fumonisin intake of the German consumer. Mycotoxin Res. 2008;24:40–52. doi: 10.1007/BF02985269. [DOI] [PubMed] [Google Scholar]
- Zinedine A, Soriano JM, Juan C, Mojemmi B, Moltó JC, Bouklouze A, Cherrah Y, Idrissi L, El Aouad R, Mañes J. Incidence of ochratoxin A in rice and dried fruits from Rabat and Salé area, Morocco. Food Addit Contam A. 2007;24:285–291. doi: 10.1080/02652030600967230. [DOI] [PubMed] [Google Scholar]