

Abstract
The functional definition of extended-spectrum β-lactamase (ESBL) activity is a clinical challenge. Here we report a rapid and convenient assay of β-lactamase activity through the competitive inhibition of fluorescent substrate hydrolysis that provides a read-out nearly 40x more rapidly than conventional techniques for functional definition. A panel of β-lactam antibiotics was used for competition against β-lactamase enzyme activated photosensitizer (β-LEAP) yielding a competitive index (Ci) in 30 minutes. Significant differences in the relative Ci’s of the panel of β-lactams were determined in vitro for Bacillus cereus Penicillinase. Additionally, the relative Ci’s for whole bacterial cell suspensions of B. cereus 5/β were compared to the relative MIC values and a correlation coefficient of 0.899 was determined. We further demonstrated the ability of β-LEAP to probe the capacity of ceftazidime to inhibit the enzyme activity of a panel of ESBL producing Escherichia coli. The bacteria were assayed for susceptibility to ceftazidime and the relative MIC values were compared to the relative Ci’s for ceftazidime yielding a correlation coefficient of 0.984. This work demonstrates for the first time the whole cell assay of the competitive inhibition of β-lactamase enzyme activity and derivation of associated constants.
INTRODUCTION
A global health threat, the extended spectrum β-lactamases (ESBLs) confer bacterial resistance against third generation extended spectrum cephalosporins and can be present in combination with a myriad of other antibiotic resistance genes severely limiting treatment options (1, 6, 10). ESBL-producing bacterial pathogens present a challenge to caregivers in the initial management of infections due to lack of screening and to the high frequency of misidentification when there is screening (10). Current clinical diagnostic techniques for ESBL producing bacteria pursue readouts in two broad categories, indirect detection of the enzyme’s activity via bacterial growth and detection of the genes encoding the enzymes via polymerase chain reaction techniques (10). It is noted that there are often incongruities between the results of clinical antibiotic susceptibility tests and the respective treatment response of patients with regards to infections by ESBL producers (10).
Reducing the time required for the functional definition of ESBLs could enable clinicians to make educated decisions regarding treatment options more rapidly, reduce the frequency of treatment failure and greatly improve patient outcome. Assaying the scope of ESBL hydrolytic efficiency directly could provide valuable information to clinicians and help to guide the selection of effective treatment options. Recently, we reported on the specific photodynamic antibacterial activity of a β-lactamase enzyme-activated photosensitizer (β-LEAP) (17). We have since developed β-LEAP as a fluorescent molecular probe for the detection and characterization of β-lactamase activity via competitive inhibition with β-lactam antibiotics. We have used this technique to measure the relative substrate conversion abilities of β-lactamases. Here we report the success of this approach in rapidly characterizing the activity of β-lactamases as purified enzymes and in whole cell bacterial suspensions both Gram-positive and Gram-negative, including a panel of common ESBLs, in a fraction of the time required for conventional culture-based antibiotic susceptibility tests.
MATERIALS & METHODS
Enzymes, β-lactams, bacterial strains, media, and culture conditions
Purified Bacillus cereus penicillinase (β-lactamase I) (Sigma Aldrich, St. Louis, MO) was suspended at a concentration of 500 Enzyme-Units/ml in ddH2O/50% glycerol. All bacterial strains used in this study were purchased from the ATCC, Manassas, VA (Table 1.).
Table 1.
Strains of bacteria used in this study.
| Strain | ATCC I.D. | β-lactamase | Culture Media and Conditions |
|---|---|---|---|
| B. cereus 5/β | 13061 | β-lactamase I/II | Brain heart infusion broth & agar, 37°C, 300 r.p.m. |
| E. coli J53 | BAA196 | ESBL TEM-10 | Tryptic soy broth & agar, 37°C, 300 r.p.m. |
| BAA197 | ESBL TEM-12 | ||
| BAA198 | ESBL TEM-26 | ||
| BAA199 | ESBL SHV-3 | ||
| BAA200 | ESBL SHV-4 | ||
| BAA201 | ESBL TEM-3 (CTX-1) |
The following cephalosporins and penicillins were purchased from Sigma Aldrich, St. Louis, MO; ceftazidime hydrate, cefotaxime sodium salt, cefazolin, ampicillin, penicillin G, and carbenicillin. All β-lactam antibiotics were suspended in ddH2O and stored at −20°C.
Synthesis of β-LEAP
β-LEAP was synthesized using a procedure previously described (17). Briefly, the chloro group on 7-amino-3-chloromethyl-3-cephem-4-carboxylic acid p-methoxybenzyl ester (ACLE) was substituted with 4-aminothiophenol with the help of 4-methylmorpholine. The purified product was mixed with 5-(4′-carboxybutylamino)-9-diethylaminobenzo[a]phenothiazinium chloride (EtNBS-COOH), O-(7-azabenzotriazole-1-yl)-N,N,N,N′-tetramethyluronium hexafluorophosphate (HATU), and diisopropylethylamine in dry N,N-dimethylformamide. The reaction mixture was stirred at room temperature for 3 hours then purified on silica coated preparative thin-layer chromatography. After removed p-methoxybenzyl protection group, Reversed Phase-High Performance Liquid Chromatography was performed to yield β-LEAP in high purity (>95%).
Minimum inhibitory concentration assay
Susceptibility testing was performed as previously described (15). Briefly, overnight liquid cultures were established from freshly streaked plates. The next day cultures were established by making a 1:1000 dilution of the overnight cultures and were grown until mid-exponential growth phase. Equal volumes of serial concentrations of antibiotics were added to result in the desired final concentrations of antibiotics and a starting concentration of 5×10⁵ colony forming units per milliliter. The growth of the resultant cultures was monitored as optical density at a wavelength of 600 nm using a Spectramax M5 plate reader (Molecular Devices, Inc., Sunnyvale, CA)) every four hours for a total of 5 reading across a 16-hour incubation period. The area under the curve (AUC) of resultant growth curves was determined using Simpson’s Rule and each AUC was divided by the AUC of growth without antibiotics to yield the fractional area (FA). The FA was plotted verses the log10 concentration of antibiotic and the resultant inhibition profile was fit to a modified Gompertz equation using Prism 5.0 (Graphpad Software, Inc., La Jolla, CA) to determine the MIC.
β-LEAP competitive inhibition assay
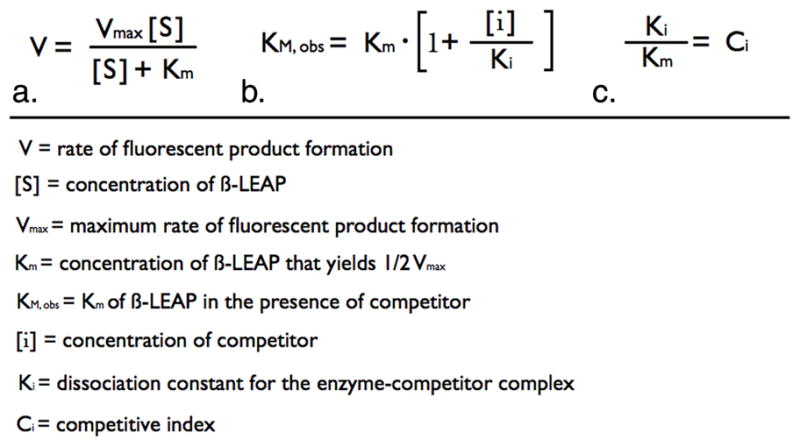
All reactions had a final volume of 100 μl and the assays were set up in 96 well, clear bottom, white polystyrene, nonpyrogenic, sterile plates. Three concentrations of β-LEAP (10 μM, 5 μM, & 2.5 μM), 5 concentrations of competitor β-lactam, as well as the controls lacking competitor or lacking β-LEAP were used in each assay. Reaction components were assembled in the following order. Twenty-five μl of competitor antibiotics at 4X final concentration were placed into the appropriate wells of the plate. Competitor β-lactam antibiotics were serially diluted in phosphate buffered saline (PBS), pH 7.4. If the assay was for pure enzyme, 25 μl of enzyme suspended in PBS, pH 7.4, was added to the appropriate wells at 4X the final concentration. In the case of whole cell bacterial suspensions, 25 μl of overnight culture was added to each well. The reactions were then incubated at 37°C for 10 minutes. Following the incubation period β-LEAP was added to the reactions at 2X final concentration in PBS, pH 7.4, 40% dimethylsulfoxide. Plates were monitored immediately after addition of β-LEAP. The fluorescence emission signals of the reactions were read every minute for 30 minutes using a Spectramax M5 plate reader (Molecular Devices, Inc., Sunnyvale, CA). The instrument was set to an incubation temperature of 37°C. The excitation wavelength was set to 650 nm and the emission wavelength was set to 700 nm. The data was reduced to slope as a measure of reaction velocity using Softmax Pro, v5.3 (Molecular Devices, Inc., Sunnyvale, CA). The y-axis limit in the reduction menu was set to ensure that the slope was determined across a linear range for each reaction. The reduced values were entered into worksheets in Prism 5.0 (Graphpad Software, Inc., La Jolla, CA) and were fit to a competitive inhibition equation (Fig. 1b.) using global analysis (7). The resultant Km values for β-LEAP and the resultant Ki values for the competitor substrates were used to derive the competitive index values (Fig. 1c.).
Figure 1.
Statistics
All resultant values obtained for each experimental group from both competitive inhibition assays and MIC assays were tested pair wise for statistically significant differences via one-way analysis of variance and Tukey’s post-test using Prism 5 (Graphpad Software, Inc., La Jolla, CA) (7).
The results of competitive inhibition assays and MIC assays were tested for correlation as follows. All values for each bacteria or each β-lactam within each assay were normalized to their respective maximum and minimum values and were expressed fractionally with upper and lower asymptotes of 1.0 and 0 respectively. The resultant values for each bacteria or each β-lactam were arranged in the identical order in columns for each of the two assays. The resultant data sets were analyzed for correlation by the Pearson test using Prism 5 (Graphpad Software, Inc., La Jolla, CA) (7).
RESULTS AND DISCUSSION
Assaying the affinity of multiple β-lactams for pure B. cereus penicillinase
We have recently published the Km of β-LEAP for B. cereus penicillinase (17). We thought it might be possible to identify effective and ineffective antibiotics by directly probing these differences using β-LEAP as a reporter of β-lactam cleavage by β-lactamase. When two substrates compete for the active site of an enzyme their relative binding affinities in part determine the relative duration that each occupies the active site. Increasing the concentration of the competitive inhibitor, a β-lactam, increases the observed Km due to the competitor occupying the active site with a respectively greater frequency. The concentration dependent increase in the observed Km can be used to determine the Ki for the competitor substrate (7). In this system the reaction velocity of β-LEAP cleavage is observed as the rate of fluorescent product formation (V) (Fig. 1a.). The dependence of V on β-LEAP concentration ([S]) is determined using multiple [S]’s and used to determine the [S] at which one half of the maximum rate (Vmax) is achieved (Km) (Fig. 1a). The ability of a competitor β-lactam antibiotic substrate to increase the observed Km (Km, obs) of β-LEAP is probed for a range of concentrations and used to determine the dissociation constant of the enzyme-competitor complex (Fig. 1b.). Different enzymes will yield different Km values for β-LEAP and in order to compare the ability of competitors to inhibit β-LEAP hydrolysis by different enzymes it is necessary to normalize the Ki values to the Km values to yield the competitive index (Ci) (Fig. 1c).
We first established the usefulness of this approach in assaying differences in Ci for a panel of β-lactam antibiotics using purified β-lactamase (Fig. 2a). For this purpose we elected to use Bacillus cereus penicillinase (Sigma Aldrich, St. Louis, MO) (Table 1.). Bacillus cereus penicillinase is a Class A serine enzyme, has a broad spectrum of hydrolytic activity and is known to preferentially hydrolyze penicillins as compared to cephalosporins making it an ideal choice for testing the inhibitory effects of a panel β-lactam antibiotics comprised of penicillins and cephalosporins (4).
Figure 2.

Competitive inhibition reactions were monitored for 30 minutes and the data was then fit to determine the Ci for each antibiotic tested. Indeed, the panel of β-lactams exhibited statistically significant differences in their respective Ci values (Fig. 2a.). The least potent competitor with the greatest Ci was ampicillin (305.9) (Fig. 2a.). Carbenicillin (185.1) and penicillin G (180.1) completed the penicillin group of the panel whose Ki’s were all significantly greater than those of the cephalosporins, cefazolin, cefatoxime, and ceftazidime (22.0, 55.3, & 70.2 respectively). In agreement with the literature, the enzyme was found to hydrolyze penicillins preferentially as compared to cephalosporins (16).
Correlation of the CI’s with the MICs of β-lactams for B. cereus 5/β
Bacillus cereus 5/β was assayed similarly in the form of whole bacterial cell suspensions (Table 1.). Again ampicillin was the least potent inhibitor (6752.8). The Ci for penicillin G (6199.5) was significantly greater than that obtained for carbenicillin (1817.4) while this relationship not significant in the case of pure enzyme. A further difference between the results for pure enzyme and those for B. cereus 5/β cultures was that the Ci of carbenicillin was not significantly different than those obtained for the cephalosporins 2682.8, 3069.4, & 3384.5 respectively) (Fig. 2B.). These findings demonstrated that β-LEAP could be used to directly probe the affinity of β-lactamases produced by bacteria in cultures but, how would the Ci profiles generated using β-LEAP compare to the results of culture based susceptibility tests? To answer this question the MIC of each member of the panel of β-lactam antibiotics was determined (Fig. 2C.). When the resultant MIC values were compared against the Ci values obtained from the previous assays there were some obvious differences in their relative values as well as some striking similarities. The range of sensitivity of the competitive inhibition assay was greater than that of the MIC assay, yielding Ci values for ampicillin, a β-lactam to which B. cereus 5/β was so resistant the MIC was undeterminable. Of the β-lactams for which an MIC was determinable, B. cereus 5/β was most resistant to penicillin G (2604.7 μg/ml) followed by carbenicillin (1709 μg/ml) and lastly the cephalosporins (42.3 μg/ml, 50.4 μg/ml, 188.5 μg/ml, respectively). Additionally, just as it was defined by the relative Ci’s of the panel of β-lactams for purified enzyme and for whole cell suspensions, the relative MIC values indicated that the bacterium was more resistant to penicillins than to cephalosporins (compare Fig. 2a., b., & c.). The relative Ci values of the β-lactams were compared to the relative MIC values and a correlation coefficient of 0.899 was determined indicating a high level of agreement between the readouts of the two assays. These findings demonstrate that the Ci of a competitor substrate directly correlates with the ability of the competitor to inhibit the growth of the bacterium that expresses the enzyme.
The dual role of the competitive inhibitor as a substrate enables this relationship. The Ki component of the Ci is the dissociation constant of the enzyme-competitor complex (Fig. 1b & c.). A low Ki, is indicative of high binding affinity of the competitive inhibitor for the enzyme. The Ci values for competitor substrates as determined via a concentration-dependent increase in the Km of a fluorescent substrate (β-LEAP) for the enzyme reflect the total time that a single molecule of competitor occupies the active site of the enzyme prior to its conversion to product. This time is influenced by at least two dissociation constants that of the enzyme-competitor complex and that of the enzyme-competitor transition-state complex (13). The transition-state is the rate-limiting step of the reaction in the absence of enzyme (13). The capacity of the enzyme to stabilize the transition-state reduces the amount of energy required for the reaction to occur. If two substrates with equivalent dissociation constants for their respective enzyme-competitor complexes have different dissociation constants for their respective enzyme-competitor transition state complexes they will be associated with the enzyme for different durations of time. One explanation for the direct correlation of Ci and MIC values is that those competitors with lower Ci values remain associated with the enzyme for a greater duration of time due to a higher energy of activation for their hydrolytic cleavage. Those competitor substrates with higher activation energies for hydrolysis would logically be greater inhibitors of growth as more antibiotic would be active in culture over time as compared those with lower activation energies.
The affinities of a single β-lactam for multiple ESBLs correlates with the respective MICs
Together these findings indicated that the competitive inhibition of β-LEAP hydrolysis by β-lactams could provide information as useful as that provided by the MIC assay nearly 40 times faster, as the MIC assay required 20 hours of culture past the initial overnight incubation period while the competitive inhibition assay required only 30 minutes. Additionally, these findings demonstrate that a greater Ci value can be used as an indicator of a greater MIC value. However, defining differences in the affinity of a single enzyme for multiple substrates is quite different than defining the affinity of multiple enzymes for a single substrate, multiple substrates, or even further in multiple species of bacteria.
We elected to explore the use of β-LEAP in probing the affinity of multiple ESBLs for a single substrate, a third generation cephalosporin, ceftazidime, using a panel of ESBL producing Escherichia coli (ATCC, Manassas, VA) (Table 1.) (6). The TEM and SHV classes of ESBLs are represented in this group of bacteria and the respective gene sequences, genomic contexts, and some differences in substrate-specific hydrolytic activity of the ESBLs contained therein have been well defined (2, 3, 5, 6, 8, 14). The panel included enzymes derived from TEM-1 that are still prevalent in U.S. hospitals, TEM-10, TEM-12, and TEM-26 (1). The panel also included TEM-3, and enzyme also known as CTX-1 due to its high efficiency hydrolysis of cefatoxime, but not to be confused with the CTX-M enzymes that have become the prominent ESBL worldwide, excluding the United States (1, 5). Additionally the panel included two SHV class enzymes, SHV-3 and SHV-4.
As a first step towards defining the activity of the panel of ESBLs in hydrolyzing ceftazidime the MICs of the panel of clones were determined (Fig. 3b.) The most resistant of the lot was BAA196 (354.53 μg/ml) that expresses the TEM-10 enzyme and the least resistant was BAA197 (9.72 μg/ml) that expresses the TEM-12 enzyme (Table 1. & Fig. 3c.) (3, 12). These two enzymes differ by a single amino acid, Glu240 to Lys, demonstrating how a single amino acid substitution in an ESBL can confer dramatic differences in the susceptibility of the bacteria that express them (3, 5, 12). Also notable, is the difference between the MICs of BAA199 (83.37 μg/ml) and BAA200 (24.15 μg/ml), expressing SHV-3 and SHV-4, respectively and differing by a single amino acid, Glu204 to Lys (Table 1. & Fig. 3b.) (5, 9, 11). The resultant MIC profile for the panel of ESBLs indicated that there were significant differences that could be tested using our β-LEAP competitive inhibition assay (Fig. 3b.).
Figure 3.

The ability of the panel of ESBLs to hydrolyze β-LEAP (10 μM) was assayed using whole bacterial cell suspensions and expressed as fluorescence units versus minutes (Fig. 4.). Five out of the six ESBLs hydrolyzed β-LEAP quite efficiently and were assayed for competitive inhibition by ceftazidime (Fig. 4.). TEM-26 did not hydrolyze β-LEAP significantly as compared to no cells (Fig. 4.) Both TEM-12 and TEM-26 share the common progenitor enzyme TEM-1. The two enzymes share a common amino-acid substitution as compared to TEM-1, Arg164 to Ser, however TEM-26 harbors the additional Glu104 to Lys substitution that appears to render the enzyme incapable of catalyzing the hydrolytic cleavage of β-LEAP (5). Interstingly, TEM-3 shares the Glu104 to Lys substitution with TEM-26 and hydrolyzes β-LEAP with a velocity similar to that of TEM-12 (Fig. 4.) (5). A lack of β-LEAP hydrolysis could be indicative of ESBLs with specific combinations of amino acid substitutions. In this context, the lack of hydrolysis of β-LEAP by an ESBL would provide useful information. It is possible that through combination with PCR based diagnostic techniques that the β-LEAP assay could provide a functional definition of enzyme activity even in the absence of cleavage.
Figure 4.

Comparing the Ci’s of the panel of ESBLs to their respective MIC values revealed that the readouts were quite similar (Compare Fig. 2c. & Fig. 2b). In both cases SHV-3 has a significantly greater value than SHV-4 and TEM-10 has a significantly greater value than all others (Fig. 3a., & b.). One difference was that the MIC of ceftazidime for TEM-3 (CTX-1) (18.85 μg/ml) was significantly greater than that of TEM-12 (9.72 μg/ml) while the respective Ci values (82.9 & 89, respectively) were not (Compare Fig. 3a. & Fig. 3b.). However, the profiles of the two readouts were very similar. When the two data sets were tested for correlation they yielded a correlation coefficient of 0.984 demonstrating a high degree of correlation between the respective Ki/Km ratios and MICs for each ESBL (Fig. 3c.).
In this work we, for the first time, demonstrate the measure of competitive inhibition and the determination of the Ci of β-lactamases in whole bacterial cell suspensions. We have also demonstrated that a competitive inhibition assay that uses β-LEAP as a fluorescent reporter yields results that correlate to those of the MIC assay in a fraction of the time. We anticipate the use of this technology for the development of rapid high-throughput systems for the functional definition of β-lactamases as well as other enzymes.
References
- 1.Bush K. Extended-spectrum beta-lactamases in North America, 1987–2006. Clin Microbiol Infect. 2008;14(Suppl 1):134–143. doi: 10.1111/j.1469-0691.2007.01848.x. [DOI] [PubMed] [Google Scholar]
- 2.Chanal C, Sirot D, Malaure H, Poupart MC, Sirot J. Sequences of CAZ-3 and CTX-2 extended-spectrum beta-lactamase genes. Antimicrob Agents Chemother. 1994;38:2452–2453. doi: 10.1128/aac.38.10.2452. [DOI] [PMC free article] [PubMed] [Google Scholar]
- 3.Goussard S, Courvalin P. Updated sequence information for TEM beta-lactamase genes. Antimicrob Agents Chemother. 1999;43:367–370. doi: 10.1128/aac.43.2.367. [DOI] [PMC free article] [PubMed] [Google Scholar]
- 4.Hussain M, Carlino A, Madonna MJ, Lampen JO. Cloning and sequencing of the metallothioprotein beta-lactamase II gene of Bacillus cereus 569/H in Escherichia coli. J Bacteriol. 1985;164:223–229. doi: 10.1128/jb.164.1.223-229.1985. [DOI] [PMC free article] [PubMed] [Google Scholar]
- 5.Jacoby GA, Bush K. β-Lactamase Classification and Amino Aicd Sequences for TEM, SHV and OXA Extended Spectrum β-Lactamases. Lahey Clinic; 2010. [Google Scholar]
- 6.Jacoby GA, Sutton L. Properties of plasmids responsible for production of extended-spectrum beta-lactamases. Antimicrob Agents Chemother. 1991;35:164–169. doi: 10.1128/aac.35.1.164. [DOI] [PMC free article] [PubMed] [Google Scholar]
- 7.Motulsky H, Christopoulos A. Fitting Models to Biological Data Using Linear and Nonlinear Regression. Oxford University Press; New York, New York: 2004. [Google Scholar]
- 8.Naumovski L, Quinn JP, Miyashiro D, Patel M, Bush K, Singer SB, Graves D, Palzkill T, Arvin AM. Outbreak of ceftazidime resistance due to a novel extended-spectrum beta-lactamase in isolates from cancer patients. Antimicrob Agents Chemother. 1992;36:1991–1996. doi: 10.1128/aac.36.9.1991. [DOI] [PMC free article] [PubMed] [Google Scholar]
- 9.Nicolas MH, Jarlier V, Honore N, Philippon A, Cole ST. Molecular characterization of the gene encoding SHV-3 beta-lactamase responsible for transferable cefotaxime resistance in clinical isolates of Klebsiella pneumoniae. Antimicrob Agents Chemother. 1989;33:2096–2100. doi: 10.1128/aac.33.12.2096. [DOI] [PMC free article] [PubMed] [Google Scholar]
- 10.Paterson DL, Bonomo RA. Extended-spectrum beta-lactamases: a clinical update. Clin Microbiol Rev. 2005;18:657–686. doi: 10.1128/CMR.18.4.657-686.2005. [DOI] [PMC free article] [PubMed] [Google Scholar]
- 11.Peduzzi J, Barthelemy M, Tiwari K, Mattioni D, Labia R. Structural features related to hydrolytic activity against ceftazidime of plasmid-mediated SHV-type CAZ-5 beta-lactamase. Antimicrob Agents Chemother. 1989;33:2160–2163. doi: 10.1128/aac.33.12.2160. [DOI] [PMC free article] [PubMed] [Google Scholar]
- 12.Quinn JP, Miyashiro D, Sahm D, Flamm R, Bush K. Novel plasmid-mediated beta-lactamase (TEM-10) conferring selective resistance to ceftazidime and aztreonam in clinical isolates of Klebsiella pneumoniae. Antimicrob Agents Chemother. 1989;33:1451–1456. doi: 10.1128/aac.33.9.1451. [DOI] [PMC free article] [PubMed] [Google Scholar]
- 13.Radzicka A, Wolfenden R. Transition state and multisubstrate analog inhibitors. Methods Enzymol. 1995;249:284–312. doi: 10.1016/0076-6879(95)49039-6. [DOI] [PubMed] [Google Scholar]
- 14.Rice LB, Marshall SH, Carias LL, Sutton L, Jacoby GA. Sequences of MGH-1, YOU-1, and YOU-2 extended-spectrum beta-lactamase genes. Antimicrob Agents Chemother. 1993;37:2760–2761. doi: 10.1128/aac.37.12.2760. [DOI] [PMC free article] [PubMed] [Google Scholar]
- 15.Sallum UW, Chen TT. Inducible resistance of fish bacterial pathogens to the antimicrobial peptide cecropin B. Antimicrob Agents Chemother. 2008;52:3006–3012. doi: 10.1128/AAC.00023-08. [DOI] [PMC free article] [PubMed] [Google Scholar]
- 16.Wang W, Mezes PS, Yang YQ, Blacher RW, Lampen JO. Cloning and sequencing of the beta-lactamase I gene of Bacillus cereus 5/B and its expression in Bacillus subtilis. J Bacteriol. 1985;163:487–492. doi: 10.1128/jb.163.2.487-492.1985. [DOI] [PMC free article] [PubMed] [Google Scholar]
- 17.Zheng X, Sallum UW, Verma S, Athar H, Evans CL, Hasan T. Exploiting a bacterial drug-resistance mechanism: a light-activated construct for the destruction of MRSA. Angew Chem Int Ed Engl. 2009;48:2148–2151. doi: 10.1002/anie.200804804. [DOI] [PubMed] [Google Scholar]