

Abstract
Cancer susceptibility has been attributed to at least one heterozygous genetic alteration in a tumor suppressor gene (TSG)1. It has been hypothesized that subtle variations in TSG expression can promote cancer development2,3. However, this hypothesis has not yet been definitively supported in vivo. PTEN is a TSG frequently lost in human cancer and mutated in inherited cancer-predisposition syndromes4. Here, we analyze Pten hypermorphic mice (Ptenhy/+), expressing 80% normal levels of Pten. Ptenhy/+ mice develop a spectrum of tumors, with breast tumors occurring at the highest penetrance. All breast tumors analyzed here retained two intact copies of Pten and maintained Pten levels above heterozygosis. Notably, subtle downregulation of Pten altered the steady-state biology of the mammary tissues and the expression profiles of genes involved in cancer cell proliferation. We present an alterative working model for cancer development in which subtle reductions in the dose of TSGs predispose to tumorigenesis in a tissue-specific manner.
Susceptibility to cancer has been historically attributed to inherited genetic alterations. Three decades ago, Alfred Knudson, a pioneer of cancer genetics, proposed a groundbreaking model for tumorigenesis, suggesting that cancer growth is initiated as a result of two genetic alterations of a single TSG1,5,6. Knudson envisioned tumor suppression as recessive characteristic, whereby an inactivating mutation present at birth is accompanied by a second somatic loss in the tumor. As a result of this visionary working model, a number of TSGs that undergo biallelic disruption or truncating point mutations were identified1.
In mouse models, monoallelic loss of major TSGs can be sufficient to trigger tumorigenesis in the absence of loss of heterozygosity (LOH), leading to a refinement of the Knudsonian hypothesis and the introduction of the concepts of haploinsufficiency and compound haploinsufficiency5,7–9.
We and others have previously demonstrated that Pten (encoding the protein phosphatase and tensin homolog deleted on chromosome 10) is a bona fide haploinsufficient TSG10–12, whereas subsequent studies have shown that a further decrease of Pten dosage below heterozygosity leads to an accelerated progression to invasive cancer2.
With the advent of functional genomics, subtle changes in the expression levels of TSGs frequently detected in the general population have been proposed to dictate cancer susceptibility3. However, this hypothesis lacks conclusive experimental evidence.
Here we demonstrate through the generation and characterization of a Ptenhy/+ mouse model that even a negligible decrease in Pten expression is sufficient to promote cancer susceptibility in mice.
To decrease the expression level of Pten below homozygosity, we targeted intron 3 of Pten with a neomycin (neo) cassette under the control of the cytomegalovirus (CMV) promoter, resulting in transcriptional interference (as reported in refs. 13 and 14; Supplementary Fig. 1a). Ptenhy/+ mice were crossed with Pten+/− mice to generate hypomorphic mouse cohorts with decreasing levels of Pten expression (Ptenwt > Ptenhy/+ > Pten+/− > Ptenhy/−). To preserve a constant 129/C57BL/6 mixed genetic background, we crossed Ptenhy/+ mice with Pten+/− mice for eight or more generations before analysis. As expected, Ptenhy/+ mouse embryonic fibroblasts (MEFs) showed Pten levels below those of Ptenwt and above those of Pten+/− mice (Supplementary Fig. 1b; quantified in Supplementary Fig. 1c). Analysis of Pten gene expression by quantitative RT-PCR in MEFs also showed a 20% reduction in mRNA levels in mice with Ptenhy/+ cells (Supplementary Fig. 1d).
We first evaluated the long-term survival and spontaneous tumor development of the Pten hypomorphic series of mice. Reduction of Pten dose in mice resulted in decreased survival (Fig. 1a–c). Mean survival was 12 ± 1.8 months (mean ± s.d.) for Pten+/− mice and 8.5 ± 1.48 months for Ptenhy/− mice. Unexpectedly, Ptenhy/+ mice also showed a significant decrease in survival (Fig. 1a–c). Similar to Pten+/− mutants15, Ptenhy/+ mice had autoimmune disorders. Ptenhy/+ mice developed lymphadenopathy and splenomegaly (Supplementary Fig. 2a–c); however, the onset of this autoimmune disease was delayed in the Ptenhy/+ mice (Supplementary Fig. 2a), which explains the difference in survival between the Pten+/− and Ptenhy/+ populations. Similar to that for Pten+/− mice15, the histology of the spleen and lymph node from Ptenhy/+ mice showed autoimmune lymphadenopathy (Supplementary Fig. 2d) and multiorgan inflammatory infiltration (Supplementary Fig. 2e). Comparable with Pten+/− mice15, Ptenhy/+ males developed a less severe autoimmune disorder, which explains their difference in survival as compared to female Ptenhy/+ mice (compare Fig. 1b and 1c).
Figure 1.

A subtle reduction in the dose of Pten dictates overall survival in Ptenhy/+ mice and initiates mammary tumorigenesis. (a–c) Kaplan-Meier plots for overall survival in the general population (a) and in the male (b) and female (c) populations. hy/+, mice having a Pten hypomorphic and a wild-type (wt) allele; hy/−, mice having a Pten hypomorphic and null allele; +/−, mice having a Pten wt and null allele. OS, overall survival; n, number of mice analyzed; P, statistical significance. (d) Percentage of mice with mammary tumors according to age in the female population; n, number of animals analyzed; P, statistical significance. Inset is a representative image of a mammary tumor in Ptenhy/+ mice. (e) Top, H&E staining (×20) of a Ptenwt normal mammary gland and Ptenhy/+ and Pten+/− mammary tumors. Bottom, average size and Ki-67 proliferative index of the Ptenwt mammary glands and Ptenhy/+ and Pten+/− mammary tumors. (f) Immunohistochemical analysis for Pten and pAkt in Ptenhy/+ and Pten+/− mammary tumors (four tumors for each genotype were analyzed). The insets in Ptenhy/+ show a representative image (×40) for Pten and pAkt staining in a control mammary gland. (g) Protein blot analysis for Pten and pAkt protein levels (above) in Ptenwt, Ptenhy/+ and Pten+/− mammary tumors showing the presence of Pten protein and the corresponding pAkt level. Bottom, quantification of Pten protein level in mammary tumors from Ptenwt, Ptenhy/+ and Pten+/− mice. Error bars, s.d. from three independent experiments. Asterisk indicates a nonspecific band observed when blotting protein extracted from mouse tissue. Numbers to the left of the blots represent molecular weight markers in kDa; those below the Pten blot indicate densitometrically quantified protein levels that have been normalized to β-actin. Presentation of cropped images is in accordance with Nature Publishing Group policy.
Notably, Ptenhy/+ mutant mice showed increased susceptibility to developing cancer. In particular, Ptenhy/+ females had increased susceptibility to epithelial cancers (Table 1) and had later onset of cancer than Pten+/− females (Fig. 1d). Of note, 67% of Ptenhy/+ females after the age of 14 mo developed mammary carcinomas and 28% had endometrial atypical complex hyperplasia (Supplementary Fig. 3a and Table 1), which is normally considered a precursor of endometrial tumors. Tumor size and proliferation increased with the reduction of Pten dosage (Fig. 1e). Both male and female Ptenhy/+ mice also developed multifocal primary lung carcinoma and intestinal polyps at low penetrance and with comparable incidence and onset (Supplementary Fig. 3b and Table 1). Additionally, pathological analysis of the Ptenhy/+ mammary tumors showed features of differentiated invasive ductal carcinoma, whereas Pten+/− tumors were less differentiated, with a prominent stromal component (Fig. 1e, top). Immunohistochemical analysis (Fig. 1f), as well as protein blot detection of Pten (Fig. 1g), confirmed that both Ptenhy/+ and Pten+/− tumors retained Pten protein expression according to their genotype, and increased activation of the Akt protein (as indicated by phosphorylation at Ser473) as the levels of Pten were reduced, strongly suggesting that these tumors do not arise from subpopulations of cells expressing lower levels of the TSG. Furthermore, the slight upregulation of phosphorylated Akt (pAkt) in the Ptenhy/+ mice indirectly suggested that Pten in these tumors is functionally active and lacks mutation or loss of heterozygosity (LOH), which was confirmed by mutational analysis (0/4 tumors showed mutations in any of the 9 exons of Pten) and LOH analysis by DNA blot (Supplementary Fig. 4). In sum, these data demonstrate that after a long latency, Ptenhy/+ mice develop mammary tumors at a high frequency and in the absence of a detectable Pten mutation or LOH. Although methylation may occur in a subset of tumors, that is unlikely to be the case in our model, given the high level of Pten protein expression as detected by protein blot and immunohistochemistry in the Ptenhy/+ tumors.
Table 1.
Tumorigenesis in Ptenhy/+ and Pten+/− female mice
| Incidence at 9–15 months Pten+/− | Incidence at 12–21 months Ptenhy/+ | |
|---|---|---|
| Mammary tumors | 85 | 60 |
| Uterine tumors | 66 | 28 |
| Lymphadenopathy | 100 | 40 |
| Lung tumors | 0 | 28 |
| Intestinal polyps | 66 | 28 |
| Pheochromocytoma | 100 | 14 |
Tumor spectrum in the Ptenhy/+ and Pten+/− long-term survivor female mice (mice between 12–21 months of age for the Ptenhy/+ and 9–15 months of age for the Pten+/−). Data are shown in percentages.
We next checked whether a subtle decrease of Pten dose had a functional and cell-autonomous consequence in preneoplastic mammary tissue. First, we analyzed the proliferative index in preneoplastic mammary tissues from 2-month-old virgin control and Ptenhy/+ female mice, and we observed increased Ki-67 staining in Ptenhy/+ mammary glands (Fig. 2a). Notably, liver, small intestine, pancreas, adrenal and prostate tissues (data not shown and ref. 2) did not show any differences in their proliferative index (Fig. 2a, bottom). Next we analyzed the level of Pten and phosphorylated Akt (pAkt-Ser473) in preneoplastic mammary glands and confirmed the retention of Pten expression (Supplementary Fig. 5a,b), with slightly elevated pAkt levels (Supplementary Fig. 5a).
Figure 2.

A subtle variation of Pten gene expression promotes hyper proliferation in a tissue-specific manner. (a) Representative images of mammary tissue (above) and quantification (below) of Ki-67 staining in tissues from 2-month-old Ptenwt and Ptenhy/+ littermate mice. P, statistical significance; error bars, s.d. (b) Growth curve analysis of Ptenwt and Ptenhy/+ mouse mammary epithelial cells. Error bars, s.d. (c) Analysis of the cell viability (at the indicated time points) of Ptenwt and Ptenhy/+ mouse mammary epithelial cells after treatment with ultraviolet irradiation (at 60 J/m2). (d) Protein blot analysis for Pten, pAkt and Cyclin D1 protein levels in Ptenwt and Ptenhy/+ MMECs. Asterisk indicates residual Pten signal that is present because the membrane was not stripped prior to blotting for pAkt. Numbers to the right of the blots represent molecular weight markers in kDa; those numbers below the blots indicate densitometrically quantified protein levels for Pten (normalized to β-actin) and pAkt (normalized to total Akt). Presentation of cropped images is in accordance with Nature Publishing Group policy.
Finally, we assessed in vitro whether survival and proliferative advantages of mammary epithelial cells (MMECs) from Ptenhy/+ mice occurred in a cell-autonomous manner. The analysis of Ptenwt and Ptenhy/+ MMECs showed an enhanced proliferation of the Ptenhy/+ MMECs (Fig. 2b) and an increased resistance to apoptosis after ultraviolet irradiation (Fig. 2c). Protein blot analysis confirmed that Ptenhy/+ MMECs had decreased levels of Pten and increased levels of pAkt and cyclin D1 (Fig. 2d).
Notably, we validated our findings in MMECs from 3-month-old littermate mice of a pure C57BL/6 genetic background by short interfering (si) RNA–mediated Pten downregulation (Supplementary Fig. 6). Using this approach, we reduced Pten expression to ~80% that of the control cells. Analysis of proliferation confirmed that subtle reduction in Pten levels could promote hyperproliferation in C57BL/6 MMECs (Supplementary Fig. 6).
Thus, our data show that a subtle decrease in the dose of Pten can affect cellular proliferation and suggest that the mouse mammary gland is the tissue most sensitive to this variation. The in vitro analysis also supports a cell-autonomous origin for mammary cancer phenotype. These findings are summarized in Figure 3, where slight decreases in Pten levels in mammary tissue parallel the incidence of cancer observed in different tissues.
Figure 3.

Graphic representation of the correlation between Pten dosage (showing percent of normal levels), Akt signaling intensity and the corresponding observed incidence for the indicated phenotypes.
We then used gene expression profiling of Ptenhy/+ MEFs to evaluate whether a subtle decrease in Pten would affect pathways involved in tumorigenesis. Genes passing the quality control filter were ranked by signal-to-noise ratio according to their differential expression using the Bioconductor RankProd package16. To identify relevant pathways or gene sets, ranked genes were analyzed according to gene set enrichment analysis (GSEA). We identified a significant upregulation (P < 0.01) of seven transcript gene sets, three of which are involved in cell-cycle regulation (Fig. 4a). These include cell-cycle control and chromosomal-stability genes such as those encoding cyclin B2, cyclin D1, Mcm4 and Bub1. We validated these data in Ptenhy/+ MMECs by quantitative RT-PCR (Fig. 4b and data not shown). Stratification of Ptenhy/+ upregulated genes (P < 0.01 as found by RankProd) according to classification by the Gene Ontology biological processes (GO-BP) database identified cell proliferation and M-phase regulation to be significantly (P < 0.01) upregulated in Ptenhy/+ MEFs (see Fig. 4c for GO categories ordered by P value and fold enrichment factor of each GO compared to whole genome background in Ptenhy/+ compared to Pten+/+ MEFs). Upregulation of these genes may contribute to the tumorigenesis induced by subtle decreases in Pten levels, as suggested by increased proliferation observed in the Ptenhy/+ MMECs and mice. This analysis shows that subtle downregulation of Pten expression in MMECs drives the upregulation of genes encoding proteins involved in cellular proliferation, such as cyclin B2. Further, several transcripts associated with mitotic chromosomes are also upregulated, including the centromere proteins Cenpe and Bub1 and the cohesin-complex transcript Smc2l1, which promote chromosome segregation during the increased cycling in these cells (Fig. 4b). Thus, a small decrease in Pten level can alter the gene expression profile of pathways essential for tumor formation and progression, thereby contributing to cancer susceptibility.
Figure 4.

Gene expression profiles of Ptenhy/+ MEFs, MMECs and human breast cancer samples with reduced PTEN levels. (a) A subtle decrease in Pten levels significantly modulates three gene expression signatures for cell cycle (GNF2_CSK1B, GNF2_CDC2 and GNF2_CDC20) in Ptenhy/+ MEFs. Genes are ranked by signal to noise ratio according to their differential expression between Ptenhy/+ MEFs and controls. Genes in the lineage-specific gene sets are marked with vertical bars, and the enrichment score is shown in green. (b) Quantitative RT-PCR analysis in Ptenwt and Ptenhy/+ MMECs for the indicated genes. P, statistical significance. Error bars, s.e.m. of four independent mice (two to four samples per MMEC culture and mouse). (c) Stratification of the gene datasets upregulated in Ptenhy/+ MEFs according to GO-BP.
As PTEN is infrequently lost or mutated at the genomic level in individuals with breast cancer, despite a frequent decrease in the PTEN protein level17,18, we checked whether a similar gene expression signature was also present in human breast tumors19. In a high percentage of invasive breast cancers (n = 40), PTEN expression was significantly downregulated at the mRNA level (n = 7) (Supplementary Fig. 7a). When compared to the average PTEN expression levels in normal mammary tissue, PTEN mRNA levels were greater than 65% of normal levels in 20% of the samples analyzed (Supplementary Fig. 7a,b). Individuals found to have such subtle decreases in PTEN mRNA levels had protein levels that were similar to normal tissue (that is, stroma or normal breast epithelium) (Supplementary Fig. 7c). In addition, all seven gene sets upregulated in our model were significantly enriched in patients with subtle decreases in PTEN (see Supplementary Fig. 7a for gene expression profiles and Supplementary Fig. 8 for each of the GSEA profiles), suggesting that this signature of enrichment is also present in human breast cancer biopsies (Supplementary Fig. 7a,b). Together, our data demonstrate that a subtle Pten reduction results in overt biological outcomes in the mammary epithelium, although, in vivo, non–cell autonomous effects may also contribute in view of the `whole body' nature of this Pten mutant series. Notably, although reduction in PTEN dosage is strongly associated with human prostate cancer progression2, Ptenhy/+ male mice did not develop prostate intraepithelial neoplasia. This may be due to the existence of a higher phosphatidylinositol-3-OH kinase (PI3K) signaling threshold, as it is likely specific tissues have differential sensitivity to the output of this signaling pathway, and to the requirement for additional genetic events in causing neoplasia in mice (for example, ETS family of transcription factors)20.
Our findings lead to a number of meaningful conclusions. For example, we find that cancer can be promoted by the subtle reduction of a TSG without requiring an additional genetic hit at that locus. Although we cannot exclude additional genetic hits in other oncogenic and tumor-suppressive loci, we have proven the absence of Pten LOH or mutation in cancers arising in Ptenhy/+ mice. It has been proposed that subtle variations in gene expression of a given TSG may promote cancer susceptibility3. However, to our knowledge, this is the first experimental evidence in support of that hypothesis to date. Furthermore, to our knowledge, it has never been reported that tumors initiated by a subtle downregulation of a TSG can progress in the absence of LOH of the wild type TSG allele3.
We here show in Ptenhy/+ MEFs and preneoplastic tissues that a small reduction in Pten gene expression can trigger proliferation in direct association with the activation of a pro-proliferative signature. This suggests that epigenetic and environmental stresses leading to a subtle decrease in TSGs, without altering the architecture of the gene, may promote tumor-suppressor `quasi-insufficiency' and increased susceptibility to cancer (Fig. 5a).
Figure 5.
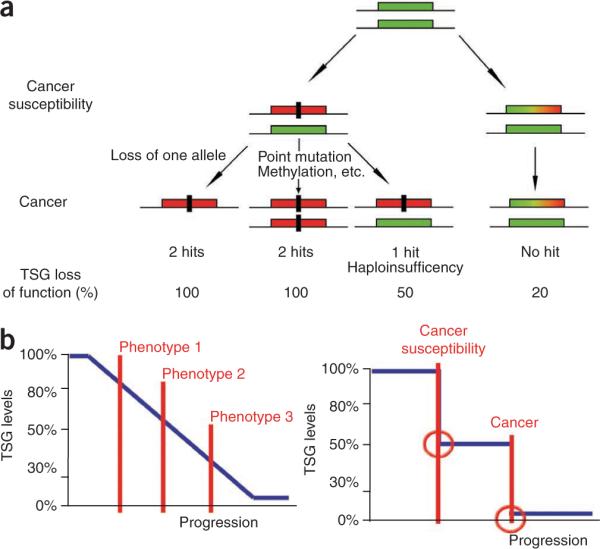
Implications for tumorigenesis upon subtle reduction of TSG levels. (a) The `no hits' model of cancer susceptibility. The rectangular green box represents a functional allele of a given TSG. The rectangular red box represents a nonfunctional allele inactivated by, for example, mutation or deletion. The rectangular green, yellow and red box represents an allele of a TSG whose expression is reduced below the normal levels. The black rectangle represents a genetic hit. Note that the model represented does not exclude the presence of additional hits on other loci. (b) A continuum model (left) for cancer initiation and promotion vis-à-vis a saltatory model (right). Note that in the continuum model, even subtle reductions in the dose of a TSG can initiate tumorigenesis in a tissue-specific manner. Phenotypes 1, 2 and 3 indicate that with the reduction of the TSG dose, the tumor phenotype can change in a tissue-specific manner, increasing incidence and aggressiveness of the disease. In the saltatory model, cancer arises from a stepwise genetic mutation–driven allelic loss.
On this basis, we propose a new model for TSG loss–driven tumorigenesis (Fig. 5b, left). Our model revisits and further refines the classical saltatory model (that is, tumorigenesis through a stepwise genetic mutation–driven allelic loss; Fig. 5b, right). We propose a continuum working model in which subtle variations in the expression of TSGs may have a profound impact on tumor susceptibility and progression. Hence, highly quantitative combinatorial methods for integrating genomic and proteomic information, along with high-throughput approaches for mutational analysis, will be required to precisely determine cancer susceptibility in any given tissue and to determine the detailed mechanisms of tumor progression; this work has critical implications in the development of both targeted and individualized approaches for cancer chemoprevention and therapy.
ONLINE METHODS
Mice
Pten+/− and hypomorphic mice were generated as previously described2,15. Tail DNA genotyped by PCR for presence of the Pten-null and Pten-hypo alleles (using primers 1 and 2 described below). Pten+/− mutants were crossed with Ptenhy/+ and their offspring were interbred to generate the four genotypes of the study cohort. Abbreviations used for cohort genotypes were (i) Pten-wt (Ptenwt), (ii) Pten hypo/wt (Ptenhy/+), (iii) Pten hypo/− (Ptenhy/−) and (iv) Pten-het (Pten+/−). Genotyping was performed on tail snips by PCR using the Pten and loxPten primers (Supplementary Table 1). DNA blot analysis in tumor tissues was done as previously described8,21 and scanned using a Storm system (Amersham). For statistical analyses, the SPSS software package (v.11) was used (SPSS Inc.). Overall and disease-free survival curves were calculated by the Kaplan-Meier method and log-rank t-tests for statistical significance.
Autopsy and histopathology
Animals were autopsied and all tissues were examined regardless of their pathological status. Normal and tumor tissue samples were fixed in 10% buffered formalin and embedded in paraffin. Sections (5 μm) were stained with hematoxylin and eosin (H&E) according to standard protocols, by staining in Harris hematoxylin solution for 8 min followed by counterstaining in eosin-phloxine B solution (0.1% eosin-Y, 0.01% phloxine B, 0.4% glacial acetic acid in 95% ethanol, all vol/vol) for 30 s to 1 min.
Cells
Primary MEFs derived from ten littermate embryos were produced as follows: MEFs were obtained by crossing Ptenhy/+ and Pten+/− animals, embryos were harvested at 13.5 days post coitum, and individual MEFs were produced and cultured as previously described21 and genotyped as described above. At passage 2, cells were harvested for protein blot analysis. Starvation or stimulation of MEFs with FBS was performed as previously described21.
Protein blot analysis
Mammary tumors from dissected animals of all genotypes were homogenized for 15 s using a Polytron homogenizer (Polytron Vertrieb), and primary MEFs were harvested and directly lysed in 50 mM Tris (pH 7.5), 150 mM NaCl, 1 mM EDTA, 0.1% NP-40 detergent, 1 mM sodium orthovanadate (Na3VO4), 10 mM NaF and protease inhibitor cocktail (Hoffmann-La Roche) and cleared by centrifugation. Concentrations were determined by the Bio-Rad Protein Assay (Bio-Rad Laboratories) and samples were taken into an SDS sample-loading buffer. Equivalents of 50 μg of lysate per lane were used for SDS-PAGE and western blot analysis. Proteins were detected using a rabbit polyclonal Pten antibody (PTEN (138G6) rabbit monoclonal antibody (mAb) no. 9559; Cell Signaling Technology), anti-actin mAb AC-74 (Sigma) for normalization, and the Phospho-Akt Pathway Sampler Kit antibodies against Akt and phospho-serine 473 of Akt (Cell Signaling Technology) following the manufacturers′ instructions. After visualization with the enhanced chemiluminescence system (Amersham Biosciences), films were scanned and band density was quantified using MacBas v2.5 (Fuji Photo Film Company) on a Macintosh computer (Apple Computer). Mammary and uterine tissues were from three sets of mice from each of the genotypes, and samples were run at least twice for confirmation and to best match loading.
Immunohistochemistry (IHC)
Tissues were fixed in 4% paraformaldehyde and embedded in paraffin, and 8-μm-thick sections were prepared. The IHC detection was performed with the mouse-on-mouse kit from Vector Laboratories. Rabbit polyclonal phospho-Akt (Ser 473) antibody (catalog no. 9270 from Cell Signaling Technology) was used in 1:50 dilution, rabbit polyclonal antibody Pten/Mmac1 Ab-5 (catalog no. RB-072-PO from Neo-Markers) was used at 1:600 dilution, and Ki-67 antibody (no. RM9106 Lab Vision) was used at 1:200 dilution. The IHC detection was performed with the ABC kit from Vector Laboratories. The staining procedures for Ki-67 were carried out by the Discovery automated staining processor from Ventana Medical Systems.
Quantitative real-time PCR
Total RNA was extracted from MMECs using Trizol (Invitrogen) and quantitative real-time PCR performed. Briefly, cDNA was obtained with Transcriptor reverse transcriptase (Roche). Taqman probes were obtained from Applied Biosystems and selected to avoid detection of genomic DNA. Amplifications were run in a 7900 Real-Time PCR System (Applied Biosystems). Each value was adjusted by using Hprt1 levels as reference.
Mutational analysis
DNA was extracted from tumor by phenol-chloroform method and amplified by PCR using Platinum PCR SuperMix High Fidelity reagents according to the manufacturer's instructions (Invitrogen). PCR amplification of Pten exons was performed using primers reported in Supplementary Table 1. Amplicons were purified using a QIAquick PCR Purification kit according to the manufacturer's instructions (Qiagen) and sequenced in both directions (Agencourt Bioscience Corporation). The results were compared with the genomic reference sequence of Pten (GenBank accession number NC_000085).
Microarray and GSEA analysis
Linear amplification of RNA was performed with the Ovation kit (Nugen) and labeled cDNA was applied to oligonucleotide microarrays (Affymetrix). Affymetrix DAT data files were processed using the Affymetrix Gene Chip Operating System to create .cel files. The raw intensity .cel files were normalized by robust multichip analysis (Bioconductor release 2.0) with perfect match (PM)-only models. Array quality control metrics generated by Affymetrix Microarray Suite 5.0 were used to asses hybridization quality. To remove probe sets not expressed or weakly expressed, probe sets were selected based on their presence on at least one of the chips using the Affymetrix present or absent calls and expression level above 32 on at least one of the chips. Normalized expression values were analyzed with Bioconductor RankProd package. The likelihood of overrepresentation of GO-BP categories in the upregulated or downregulated genes relative to the background of all array genes was calculated using Fisher's exact test. GSEA was performed as described above. Microarray experiments and gene sets are listed in Figure 4 and Supplementary Figure 8. Genes set pages are available online (see URLs).
Human subject analysis
The human subject microarray and tumor analysis was carried out using a previously published dataset19. This dataset consists of anonymous samples from the Harvard Breast Specialized Programs of Research Excellence (SPORE) blood and tissue repository. The Partners Hospital and Dana-Farber Cancer Institute Institutional Review Boards monitor this tumor repository, and consent from subjects is obtained for all identified specimens. The Partners Institutional Review Board approved the use of de-identified samples for this study (protocol no. 2000-P-001448). PTEN immunoreactivity was evaluated in biopsies from a subset of samples using the Dako PTEN IHC staining kit (M3627) following the manufacturer's instructions.
MMEC culture preparation
Mammary glands were dissected from 8-week-old female Ptenwt, Ptenhy/+ mice. Four 2-month-old (virgin) C57BL/6 mice of pure genetic background were also used to obtain MMECs. After mechanical dissociation, the tissue was placed in culture medium (DME HAM with 1 mM glutamine, 5 g/ml insulin, 500 ng/ml hydrocortisone, 10 ng/ml epidermal growth factor and 20 ng/ml cholera toxin) supplemented with 5% FCS and containing 300 U/ml collagenase (Sigma) and 100 U/ml hyaluronidase (Sigma) and digested for 1 h at 37 °C. The resultant organoid suspension was sequentially resuspended in 0.25% trypsin-EGTA for 1–2 min, 5 mg/ml dispase (Roche) and 0.1 mg/ml DNase (Worthington) for 5 min, and 0.64% NH4Cl for 3 min before filtration through a 40-μm mesh and labeling. Cells were supplemented with a MME medium containing epidermal growth factor (100 μg/ml) and 5% FCS for the in vitro assays. For the Pten siRNA experiment in MMECs, cells were transfected with different dilutions (1:4; 1:2; 1:1) of a single Pten siRNA and control.
URLs
Gene set pages; http://www.broad.mit.edu/gsea/msigdb/genesets.jsp?collection=CGN.
ACKNOWLEDGMENTS
We thank Z. Chen for help with genotyping and characterization of the Pten hypomorphic mutant mice. This study was supported, in part, by US National Cancer Institute grants (SPORE 92629 in Prostate Cancer, MMHCC CA-84292 and RO1 CA-82328). A.C. was supported by a long-term European Molecular Biology Organization fellowship.
Footnotes
Methods and any associated references are available in the online version of the paper at http://www.nature.com/naturegenetics/.
Accession codes. The mouse MEF microarray experiments carried out in this manuscript have been submitted to the GEO database and have been assigned the accession number GSE20316. In addition, the human microarray data used has been previously published19 and can be accessed from GEO using accession number GSE3744.
Note: Supplementary information is available on the Nature Genetics website.
COMPETING FINANCIAL INTERESTS The authors declare no competing financial interests.
References
- 1.Friend SH. Alfred Knudson: the importance of a visionary who enables scientists. Genes Chromosom. Cancer. 2003;38:326–328. doi: 10.1002/gcc.10257. [DOI] [PubMed] [Google Scholar]
- 2.Trotman LC, et al. Pten dose dictates cancer progression in the prostate. PLoS Biol. 2003;1:E59. doi: 10.1371/journal.pbio.0000059. [DOI] [PMC free article] [PubMed] [Google Scholar]
- 3.Yan H, et al. Small changes in expression affect predisposition to tumorigenesis. Nat. Genet. 2002;30:25–26. doi: 10.1038/ng799. [DOI] [PubMed] [Google Scholar]
- 4.Salmena L, Carracedo A, Pandolfi PP. Tenets of PTEN tumor suppression. Cell. 2008;133:403–414. doi: 10.1016/j.cell.2008.04.013. [DOI] [PubMed] [Google Scholar]
- 5.Knudson AG. Two genetic hits (more or less) to cancer. Nat. Rev. Cancer. 2001;1:157–162. doi: 10.1038/35101031. [DOI] [PubMed] [Google Scholar]
- 6.Knudson AG. Hereditary cancer: two hits revisited. J. Cancer Res. Clin. Oncol. 1996;122:135–140. doi: 10.1007/BF01366952. [DOI] [PubMed] [Google Scholar]
- 7.Ma L, et al. Genetic analysis of Pten and Tsc2 functional interactions in the mouse reveals asymmetrical haploinsufficiency in tumor suppression. Genes Dev. 2005;19:1779–1786. doi: 10.1101/gad.1314405. [DOI] [PMC free article] [PubMed] [Google Scholar]
- 8.Di Cristofano A, Pesce B, Cordon-Cardo C, Pandolfi PP. Pten is essential for embryonic development and tumour suppression. Nat. Genet. 1998;19:348–355. doi: 10.1038/1235. [DOI] [PubMed] [Google Scholar]
- 9.Venkatachalam S, et al. Retention of wild-type p53 in tumors from p53 heterozygous mice: reduction of p53 dosage can promote cancer formation. EMBO J. 1998;17:4657–4667. doi: 10.1093/emboj/17.16.4657. [DOI] [PMC free article] [PubMed] [Google Scholar]
- 10.Di Cristofano A, Pandolfi PP. The multiple roles of PTEN in tumor suppression. Cell. 2000;100:387–390. doi: 10.1016/s0092-8674(00)80674-1. [DOI] [PubMed] [Google Scholar]
- 11.Suzuki A, et al. High cancer susceptibility and embryonic lethality associated with mutation of the PTEN tumor suppressor gene in mice. Curr. Biol. 1998;8:1169–1178. doi: 10.1016/s0960-9822(07)00488-5. [DOI] [PubMed] [Google Scholar]
- 12.Podsypanina K, et al. Mutation of Pten/Mmac1 in mice causes neoplasia in multiple organ systems. Proc. Natl. Acad. Sci. USA. 1999;96:1563–1568. doi: 10.1073/pnas.96.4.1563. [DOI] [PMC free article] [PubMed] [Google Scholar]
- 13.Morita M, et al. HLF/HIF-2alpha is a key factor in retinopathy of prematurity in association with erythropoietin. EMBO J. 2003;22:1134–1146. doi: 10.1093/emboj/cdg117. [DOI] [PMC free article] [PubMed] [Google Scholar]
- 14.McDevitt MA, Shivdasani RA, Fujiwara Y, Yang H, Orkin SHA. “Knockdown” mutation created by cis-element gene targeting reveals the dependence of erythroid cell maturation on the level of transcription factor GATA-1. Proc. Natl. Acad. Sci. USA. 1997;94:6781–6785. doi: 10.1073/pnas.94.13.6781. [DOI] [PMC free article] [PubMed] [Google Scholar]
- 15.Di Cristofano A, et al. Impaired Fas response and autoimmunity in Pten+/−mice. Science. 1999;285:2122–2125. doi: 10.1126/science.285.5436.2122. [DOI] [PubMed] [Google Scholar]
- 16.Hong F, et al. RankProd: a bioconductor package for detecting differentially expressed genes in meta-analysis. Bioinformatics. 2006;22:2825–2827. doi: 10.1093/bioinformatics/btl476. [DOI] [PubMed] [Google Scholar]
- 17.Saal LH, et al. PIK3CA mutations correlate with hormone receptors, node metastasis, and ERBB2, and are mutually exclusive with PTEN loss in human breast carcinoma. Cancer Res. 2005;65:2554–2559. doi: 10.1158/0008-5472-CAN-04-3913. [DOI] [PubMed] [Google Scholar]
- 18.Bose S, et al. Reduced expression of PTEN correlates with breast cancer progression. Hum. Pathol. 2002;33:405–409. doi: 10.1053/hupa.2002.124721. [DOI] [PubMed] [Google Scholar]
- 19.Richardson AL, et al. X-chromosomal abnormalities in basal-like human breast cancer. Cancer Cell. 2006;9:121–132. doi: 10.1016/j.ccr.2006.01.013. [DOI] [PubMed] [Google Scholar]
- 20.Carver BS, et al. Aberrant ERG expression cooperates with loss of PTEN to promote cancer progression in the prostate. Nat. Genet. 2009;41:619–624. doi: 10.1038/ng.370. [DOI] [PMC free article] [PubMed] [Google Scholar]
- 21.Trotman LC, et al. Identification of a tumour suppressor network opposing nuclear Akt function. Nature. 2006;441:523–527. doi: 10.1038/nature04809. [DOI] [PMC free article] [PubMed] [Google Scholar]