

INTRODUCTION
Transcranial magnetic stimulation (TMS) has been widely used to study the changes that occur in the motor system following stroke (See Talelli et al., 2006 for review). However, obtaining measureable responses in proximal limb muscles of stroke subjects is relatively difficult with traditional single pulse TMS (compared to distal muscles) due to the heightened motor threshold post-stroke (Cicinelli et al., 2003; Cicinelli et al., 1997; Traversa et al., 1997; Turton et al., 1996). Experimental methods to facilitate TMS responses are necessary for further investigation of the neurophysiological mechanisms underlying motor impairments following brain injury such as the abnormal coactivation between muscles acting at shoulder, elbow, wrist and hand joints (Dewald et al., 1995). This abnormal coactivation results in a loss of independent joint control in the paretic upper limb in stroke survivors (Dewald et al., 2001a&b, Sukal et al., 2007) limiting their movement abilities. Future studies on the underlying mechanisms are essential for the development of novel treatment strategies.
Previous studies that used single pulse TMS on paretic proximal upper limb muscles in stroke patients relied on background contraction to facilitate the response: biceps brachii (Alagona et al., 2001; Heald et al., 1993), triceps (Heald et al., 1993), deltoid (Turton and Lemon, 1999), pectoralis major, (Heald et al., 1993; Schwerin et al., 2007). Unfortunately, stroke subjects are sometimes unable to provide background contraction, excluding this option. In addition, TMS responses collected both at rest and during voluntary activation are important to understanding the underlying mechanisms that result in abnormal muscle coactivation patterns following stroke.
Another method to facilitate TMS evoked responses is to use dual pulse TMS. This method enables the study of single or multiple paretic muscles at rest and is more appropriate for investigating MEPs in the stroke population. The use of two pulses of the same intensity has been shown to intensify diminutive or nonexistent responses to single pulse TMS through temporal and spatial summation at the spine and through facilitation at the cortical level (Nakamura et al., 1995). These studies have shown that an interstimulus interval of 10–50 ms with pulses of high stimulation intensity produce facilitatory effects in healthy control subjects in hand muscles (Abbruzzese et al., 1999; Chen et al., 1998; Claus et al., 1992; Kujirai et al., 1993; Valls-Sole et al., 1992) and in biceps brachii (Abbruzzese et al., 1999; Chen et al., 1998). To date, this technique has not been investigated for its effectiveness in obtaining responses in shoulder muscles of healthy subjects or in obtaining responses in any muscle in the stroke population. The establishment of a stimulation method that enables the study of both contralateral and ipsilateral corticofugal connections to the paretic limb for proximal as well as distal muscles during rest will provide a useful tool for exploring the effects of losses in corticofugal projections occurring during motor recovery from stroke as well as for studying neural mechanisms underlying effective novel rehabilitation treatment paradigms.
It is unknown which interstimulus interval (ISI) would be optimal to allow the comparison of MEPs in both proximal and distal upper limb muscles in both healthy and stroke subjects. In this study, we investigated a range of ISIs for their facilitatory effects in thirteen upper limb muscles in stroke and healthy subjects using high intensity dual pulses. Our overall goal was to examine the effectiveness of dual pulse TMS in eliciting simultaneous responses in upper extremity muscles. The specific aim was to determine an optimal range of ISIs that could be used to study multiple upper extremity muscles in both healthy and stroke subjects in future comparative studies.
MATERIALS AND METHODS
Subjects
Eight stroke patients (age: 60.75 ± 12.76 years, 6 male) with unilateral hemiparesis (see Table 1) and six controls in the same age range (age: 57.50 ± 9.85 years, 5 male, 4 right hand dominant) were tested. Stroke patients were more than one year post-stroke (7.88 ± 6.90 years) and were moderately to severely impaired as determined by the Fugl-Meyer upper limb assessment (Fugl-Meyer et al., 1975). A neuroradiologist identified the lesion locations from anatomical MRIs acquired specifically for this study. All subjects were recruited from the stroke database at the Sensory Motor Performance Program within the Rehabilitation Institute of Chicago. Written informed consent was obtained from all subjects. The Institutional Review Board at Northwestern University approved the experimental protocol.
Table 1.
Clinical data for the hemiparetic stroke participants
| Participant | Gender | Age (years) | Years Since Onset | FMAa | Original Handedness | Lesion Location (hemisphere: structures) |
|---|---|---|---|---|---|---|
| S1 | M | 46 | 3 | 11 | R | L: motor cortex, corona radiata, insula, basal ganglia, internal capsule |
| S2 | M | 61 | 23 | 13 | R | R: thalamus, PLICb |
| S3 | M | 58 | 5 | 24 | R | R: thalamus, posterior putamen, PLICb |
| S4 | M | 49 | 10 | 26 | R | R: temporal cortex, insula, thalamus, basal ganglia, genu of the internal capsule |
| S5 | M | 75 | 10 | 30 | R | L: thalamus, PLICb |
| S6 | M | 62 | 1 | 34 | L | R: thalamus, PLICb |
| S7 | F | 83 | 4 | 35 | R | L: thalamus |
| S8 | F | 52 | 7 | 35 | R | L: premotor cortex, caudate, basal ganglia, ALICc |
Based on Fugl-Meyer Assessment (FMA) scale (maximum score = 66)
PLIC = posterior limb of the internal capsule
ALIC = anterior limb of the internal capsule
Experimental Set-Up
The subject was supine in a Biodex experimental chair (Biodex Medical systems, Shirley, NY) with the chair back tilted up 25º from horizontal. The torso was secured using restraining straps over the shoulders and another across the waist. Both arms were studied in all subjects. The TMS evoked responses in each arm (stroke subjects: paretic arm, non-paretic arm; control subjects: right arm, left arm) were studied on separate sessions (please see Experimental Sessions below). The target arm was held in the following configuration: 90° elbow angle, 75° shoulder abduction angle, and 0° shoulder flexion angle. A fiberglass cast was put over the target hand, wrist and forearm and was fixed at the wrist to a stationary base to maintain arm position.
Electromyography
Surface electromyographic (EMG) signals were recorded with active differential electrodes (Delsys, Boston, MA) with a 1 cm inter-electrode distance placed over the muscle belly. The EMG signals were pre-amplified with a gain of 1000 and high pass filtered at 20 Hz. In a second stage, the signals were low pass filtered at 500 Hz (8-pole Butterworth, Frequency Devices Model 9016, Havelhill, MA) and amplified depending on the strength of the signal during maximum muscle contraction to optimize for the range of the amplifier. The amplified EMG signals were then sampled at 1000 Hz and stored on a computer for subsequent analysis. EMG electrodes were placed on thirteen arm muscles including: first dorsal interosseus (FDI), extensor carpi radialis (ECR), wrist flexors in the region of the flexor carpi radialis (WF), biceps brachii (BIC), brachioradialis (BRD), triceps brachii long head and lateral head (TRILO and TRILA), anterior (ADL), intermediate (IDL), and posterior (PDL) deltoids, the sternal head of the pectoralis major (PMJ), latissimus dorsi (LAT), and superior trapezius (TPS). Correct electrode placement was verified by examination of EMG activity using methods described by Kendall et al. (1983). After EMG electrode placement, EMG during maximum voluntary contraction of each arm muscle was collected for normalization purposes. During TMS application, the muscles were at rest and were monitored for activity prior to data collection. Trials where muscle activity was detected, after data collection, were eliminated from further analysis. In order to analyze the effect of muscle group (i.e., proximal vs. distal) on the optimal ISI, muscles were divided into four groups: hand/wrist (FDI, WF, ECR), elbow (BRD, BIC, TRILO, TRILA), shoulder (ADL, IDL, PDL) and trunk (PMJ, TPS, LAT).
Transcranial magnetic stimulation
TMS was performed with a thinly coated 70 mm diameter figure-of-eight coil connected to a magnetic stimulator (Magstim 250, Magstim, U.K.) with a maximum field strength of 1.97 Tesla. Stereotaxic stimulation was performed using an in-house program which co-registered a 1 cm grid on the subject’s MRI scalp surface with the subject’s head using anatomical landmarks (nasion, inion and preauricular points). The location of the stimulating coil was monitored using infrared markers on the coil and on the subject’s head. The grid was stimulated using a 25 ms interstimulus interval (ISI) and 100% stimulator intensity while the subject was at rest and responses in all 13 upper extremity muscles were recorded The center of the coil (3 cm posterior to the anterior bifurcation of the external coating) was positioned tangential to the head at each site with the handle at 30° from the parasagittal plane.
Optimal stimulation site determination
TMS was performed at a single site to minimize experimental time and to enable the gathering of data for this large number of upper limb muscles. Instead of stimulating at each muscle’s hotspot, an optimal stimulation site was found where all the muscles being investigated could be activated to at least 1% of maximum voluntary contraction. If any of the muscles could not be activated from any point on the scalp, an optimal site was found for the subset of muscles that could be activated. Given that the proximal muscles have higher thresholds, the optimal site was closer to their true hotspot than it was to that of the distal muscles. By using 100% stimulation intensity we maximized our chances of activating all of the target muscles at a single site. Maximal intensity stimulation took advantage of the recruitment of muscles from a stimulus site distant from their hotspots by means of current spread (Thickbroom et al., 1998) and also took advantage of the overlapping of TMS maps of muscles in the upper limb (Devanne et al., 2006). Since this study investigated a relative change in the magnitude of the response due to different ISIs and not the actual magnitude, this method was deemed acceptable. If multiple sites could elicit responses in all the target muscles, then the stimulation intensity was lowered until only one site met our criteria and we then employed that site for the experiment. The experiment then continued using 100% stimulation intensity. There was no case encountered in this study where two or more locations resulted in different groups of muscles being activated.
Single pulse stimulation
The motor evoked responses related to single pulse stimulation were measured at the optimal stimulation site determined above. The stimulation intensity was 100% maximum stimulator output.
ISI investigation
The stimulating coil was held in place at the optimal site with a multi-jointed arm attached to the Biodex Chair. The specific goal of the study was to determine the optimal inter-stimulus intervals to generate motor evoked potentials across upper extremity muscles using intervals ranging from 1 to 100 ms and included previously reported ISIs that have been shown to cause facilitation in healthy adults. Dual pulse stimuli with ISI = 1, 3, 5, 8, 10, 12, 15, 20, 25, 30, 40, 50, 60, 70, 80, 99.9 ms were applied randomly with six sequential trials recorded for each ISI. The intensity of each of the dual pulses was 100% of the stimulator output.
Experimental sessions
In stroke subjects, the contralateral projections from the lesioned hemisphere and non-lesioned hemisphere as well as the ipsilateral projections from the non-lesioned hemisphere were studied on three separate sessions. In controls, the contralateral projections from the left and right hemispheres were studied on two separate sessions, with a search for ipsilateral activity from each respective hemisphere at the end of each session. If ipsilateral activity was found for any of the muscles, it was investigated in detail on a third session. For analysis, there were six subject/projection types: control right hemisphere stimulation (Right), control left hemisphere stimulation (Left), control ipsilateral stimulation (Ipsilateral), stroke non-lesioned hemisphere stimulation (Non-Lesioned), stroke lesioned hemisphere stimulation (Lesioned) and stroke ipsilateral stimulation (Ipsilateral).
Analysis
Compared to the response obtained with single pulse TMS, the optimal ISI was identified as the interval that 1) lead to a higher occurrence rate of motor evoked potentials, 2) resulted in a larger response magnitude and 3) remained consistent across different muscle/subject groups. The MEP analysis for each criterion is described below. For criteria 1 & 2 we selected a range of best ISIs in order to limit the number of optimal ISIs after applying criteria 3.
Motor evoked potential occurrence rate
Data were analyzed off-line using custom software developed in Matlab (Mathworks, Inc., Natick, MA). For a single trial, the occurrence of a MEP was determined by visually inspecting the single trial in comparison to an overlay of all six trials. Specifically, we investigated two indices: optimal ISI range for MEP occurrence rate and the increase in MEP occurrence rate. We defined an optimal ISI range for MEP occurrence rate across subjects and muscles as the range of ISIs in which the MEP occurrence rate is no less than 25% of the highest resulting occurrence rate across ISIs. The increase in MEP occurrence rate (benefit) attributed to the dual pulse technique was defined as the occurrence rate for a particular ISI divided by the occurrence rate with single pulse stimulation:
MEP magnitude
The six unrectified trials for an individual subject/muscle were ensemble averaged and the peak-to-peak magnitude of the MEP was calculated. If one MEP was observed, the peak-to-peak of that response was calculated. If two distinguishable MEPs occurred, the peak-to-peak was calculated for the second response. If two indistinguishable responses occurred, the peak-to-peak of the fused response was measured. Each subject and muscle combination has a different motor threshold and therefore may respond more or less than another muscle or person at any specific ISI. This is simply because of the relationship between the threshold and the stimulation intensity. Therefore we normalized each muscle’s response within subject to its respective highest magnitude response across all ISIs, such that the best ISI has a magnitude of 1. The normalized responses were averaged across subjects/projection types. We then defined the range of optimal ISIs for achieving the highest magnitude responses within each subject/projection type as the range in which the ISI produced responses that were significantly greater than the single pulse response but were not significantly different from the greatest magnitude response across ISIs. A t-test with the 0.05 level was used to test for significance. We quantified the gain in magnitude by dividing the largest magnitude response across ISIs (Magnitude MAX) by the magnitude of the response with single pulse stimulation:
Muscle Groups
The magnitude of responses within muscle groups was analyzed to investigate differences in the distal/proximal nature of the results. The nonparametric Kolmogorov-Smirnov goodness of fit test was used to determine if the ISI response curve distributions for each muscle group were significantly different from one another and to determine if there were differences for a muscle group between subject group/projection types.
RESULTS
Optimal stimulation site
The optimal stimulation site was always in either the primary motor cortex or premotor cortex for all subject group/projection types (see Figure 1). Across subjects, in the non-lesioned hemisphere, there was not a consistent relationship between the location of the ipsilateral projection site and the location of the the contralateral projection site.
Figure 1. Stimulation sites.
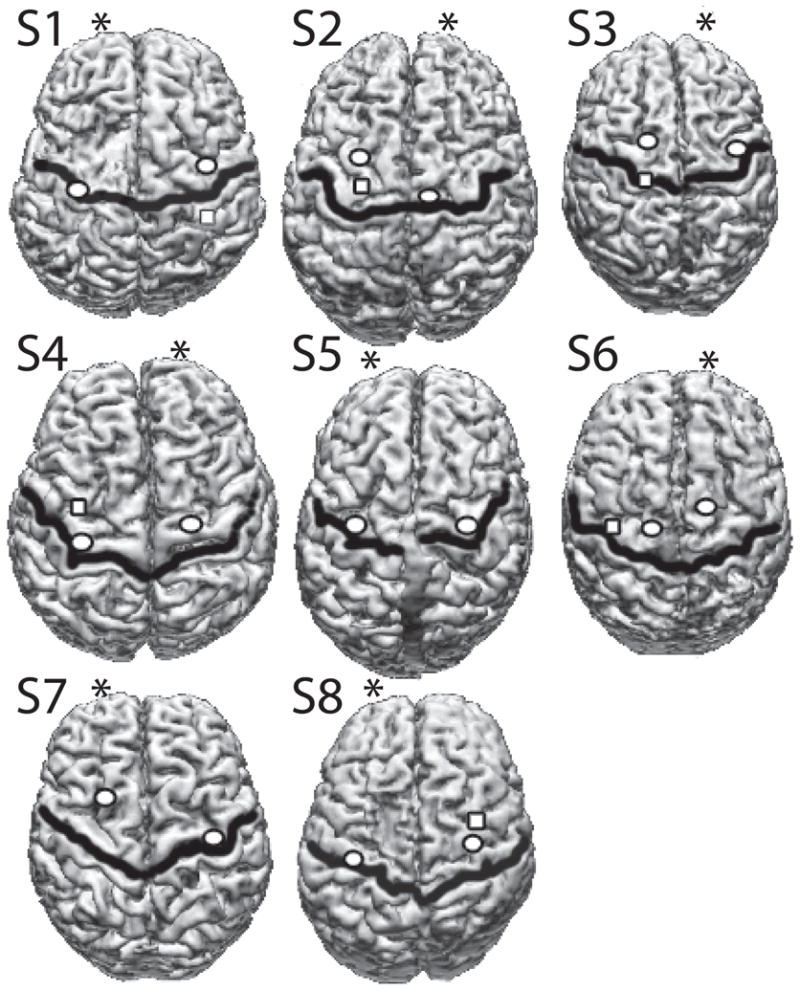
The optimal stimulation site in stroke subjects. The central sulcus is shown by a dark black line. The contralateral optimal site is shown as a circle in each hemisphere. In subjects where responses to stimulation of the ipsilateral hemisphere to the paretic arm were recorded, the optimal ipsilateral site is shown with a square. Optimal sites were determined by stimulating a 1cm grid on the subject’s MRI scalp surface. The MRI and the subject’s head were co-registered using anatomical landmarks (nasion, inion, pre-auricular points). The location of the stimulating coil was monitored using infrared markers on the coil and on the subject’s head.
Motor Evoked Potentials
Figure 2 shows examples of MEPs elicited in both control and stroke subjects using either single or dual pulse TMS in the anterior deltoid muscle. In the more distal muscles, two responses (one to the first stimulus and one to the second stimulus) were more frequently recorded in the control subjects as well as in the non-lesioned hemisphere. Two responses were rarely obtained when stimulating the ipsilateral cortex regardless of muscle.
Figure 2. Raw data.

Effect of TMS dual pulse stimulation compared to single pulse stimulation exemplified in the anterior deltoid muscle (ADL). Control (A) and stroke (B-D) subject responses. All responses result from contralateral stimulation except for D which results from ipsilateral stimulation. A) Right hemisphere stimulation with recording from the contralateral left arm ADL muscle in a control subject. B) Non-lesioned hemisphere stimulation with recording from the non-paretic arm ADL muscle in a stroke subject. C) Lesioned hemisphere stimulation with recording from the paretic arm ADL muscle. D) Non-lesioned hemisphere stimulation with recording from the paretic arm ADL muscle. The arrows indicate the time-point of the first stimulus. Note the different μV scales for each graph. In the control and stroke non-lesioned hemisphere paired pulse promotes facilitation at shorter ISIs than in the stroke lesioned and ipsilateral hemispheres. The magnitude of the response from stimulation of the stroke non-lesioned and lesioned hemispheres is much smaller than for stimulation of the control or stroke ipsilateral hemispheres.
Occurrence rate
In the control group, dual pulse TMS with a wide range of ISIs consistently evoked contralateral MEPs (cMEPs) across all muscles regardless of hemisphere (see Figure 3A and B). Dual pulse stimulation increased the occurrence rate compared to single pulse stimulation. Very few responses were observed with control ipsilateral stimulation, so these data were excluded from further analysis. In Table 2 we report the optimal ISI that generated the highest occurrence rate, the occurrence rate observed using single pulse stimulation, the occurrence rate observed using the optimal ISI for dual pulse stimulation, the benefit in occurrence rate using dual pulse stimulation, and the overall optimal range of ISIs. We defined the optimal ISI range for MEP occurrence rate across subjects and muscles as the range of ISIs in which the MEP occurrence rate was no less than 25% of the maximal occurrence rate across ISIs. This range is shown in Figure 3 by the bar at the top of each figure and is reported in Table 2. Dual pulse stimulation of the stroke non-lesioned hemisphere resulted in occurrence rates similar to the control hemispheres across ISIs (occurrence rates were between 80–100% within the optimal ISI range). However, stimulation of the lesioned hemisphere resulted in lower occurrence rates across ISIs (between 30–40% within the optimal ISI range). MEPs in the paretic arm resulting from stimulation of the ipsilateral non-lesioned hemisphere also had low occurrence rates and a narrow range of effective ISIs (25–40 ms), with a sharp peak centered at an ISI of 30ms where the occurrence rate was 56.58%. While the occurrence rate at the optimal ISI was relatively low in the paretic arm compared to the non-paretic arm or controls, the benefit of using dual pulse TMS over single pulse TMS was double for cMEPs and 15 times for iMEPs, revealing how beneficial dual pulse TMS at an optimal ISI is for evoking motor potentials in the paretic limb.
Figure 3. Occurrence rate of TMS responses.

Each bar illustrates the percentage of trials where an MEP was evoked at that ISI out of the total number of stimulation trials across muscles and subjects for both single and paired pulse stimulation in both Control (A-C) and Stroke (D-F) groups. The total number of trials was defined as number of stimulation trials applied for each muscle and for each subject within the specified group at that ISI (6 trials × 13 muscles × number of subjects in the group). The figure in the upper right of each graph demonstrates which hemisphere was stimulated and which arm was recorded from. Paired pulse using any ISI increased the occurrence rate compared to single pulse. The range of ISIs with occurrence rates within 25% of the max occurrence rate are shown by the bar at the top of each graph.
Table 2.
TMS group results
| Occurrence Rate |
Normalized Magnitude |
|||||||||
|---|---|---|---|---|---|---|---|---|---|---|
| Hemisphere Stimulated | Optimal ISI (ms) | Rate - Single (%) | Rate - Optimal ISI (%) | Gain | Range (ms) | Optimal ISI (ms) | Mag.a – Single | Mag.a – Optimal ISI | Gain | Range (ms) |
CONTROL Right 
|
20 | 40.17 | 94.66 | 2.36 | 8–40 | 20 | .12 | .75 | 6.12 | 8–40 |
CONTROL Left 
|
20 | 54.91 | 93.59 | 1.7 | 3–50 | 25 | .15 | .81 | 5.37 | 10–30 |
STROKE Non- Lesioned 
|
25 | 42.98 | 96.05 | 2.23 | 8–50 | 20 | .16 | .68 | 4.19 | 8–25 |
STROKE Lesioned 
|
30 | 20.79 | 46.20 | 2.22 | 12–50 | 30 | .17 | .58 | 3.41 | 20–40 |
STROKE Ipsilateral 
|
30 | 3.77 | 56.58 | 15.01 | 25–40 | 30 | .01 | .62 | 68.15 | 15–50 |
Normalized Magnitude
Magnitude
Like the occurrence rate results, the ipsilateral MEP magnitudes in the paretic arm were greatest using a range of ISIs centered at 30ms. (see Figure 4F). Dual pulse stimulation using ISIs of 15-50 ms produced responses significantly larger than with single pulse stimulation and the responses were not significantly different in magnitude from the response at 30 ms. This range is shifted slightly to the right compared to the range observed in the control right (8–40 ms) and control left (10–30 ms) and stroke non-paretic (8–25 ms) but was similar to the range for the stroke paretic range (20–40 ms). The gain in magnitude at the best ISI over single pulse for ipsilateral stimulation in stroke was quite large (68%) compared to the control results (right = 6%, left = 5%) and compared to the contralateral responses in stroke with stimulation of the non-lesioned hemisphere (4%) or the lesioned hemisphere (3%). As can be seen by the error bars in the Figure 4, the variability in the relative magnitude of the response across muscles/subjects for any particular ISI was similar between patients and control subjects.
Figure 4. Magnitude of TMS responses.

Within each subject and each muscle, the MEPs across ISIs were normalized to the maximal response. Then the normalized magnitude of each ISI was averaged across all muscles and all subjects. The normalized MEPs for each ISI are shown within Control (A-C) and Stroke (D-F) groups. The MEP resulting from a single pulse and a range of dual pulse stimuli are shown within each group and for both contralateral and ipsilateral hemisphere stimulation. * denote responses that are significantly different in magnitude from the single pulse response. + denote responses that were not significantly different from the maximal response for that subject group/projection (p<0.05). The range of ISIs that produced responses that were significantly greater than the single pulse response, but were not significantly smaller than the greatest magnitude response across ISIs are shown by the bar at the top of the each graph. The figure in the upper right of each graph demonstrates which hemisphere was stimulated and which arm was recorded from. Standard errors bars are shown. The range of ISIs with the highest magnitude responses was narrowest for the ipsilateral hemisphere and centered around 30 ms ISI.
Muscle Groups
The Kolmogorov-Smirnov test did not show a significant difference in the ISI response curve distributions between muscle groups within each subject/projection type (see Figure 5). At the .05 level of significance there was a significant difference in the hand/wrist muscles between the stroke ipsilateral projection response curve and each of the other subject/projection types (left: p < .0001; right; p = .004; non-lesioned: p = .0001; lesioned: p < .0001) and between control left and stroke lesioned curves (p = .039). In the elbow muscle group there was a significant difference between control left and stroke ipsilateral curves (p = .039) and stroke lesioned and stroke ipsilateral curves (p = .014). In the shoulder muscle group there was a significant difference between the stroke ipsilateral and the control left curves (p = .039). There was no statistically significant difference between subject/projection type ISI response curves for the trunk muscle group.
Figure 5. ISI response curves across muscle groups.

ISI response curves plotted for muscle groups. The normalized magnitude of the response at each ISI was averaged across the muscles in each group. Note how the curves are narrowest for the proximal muscles and also for the stroke ipsilateral projection.
DISCUSSION
The use of high intensity dual pulses drastically increased the occurrence rate of cMEPs and iMEPs in the paretic limb and produced strong facilitation across muscles. The iMEPs had the narrowest range of optimal ISIs. The greatest facilitation of the magnitude of ipsilateral MEPs occurred at 15–50 ms and the best range for optimal occurrence rate was 25–40 ms. For cMEPs in the paretic limb, the optimal range for facilitation was 12–50 ms and the optimal range for occurrence rate was 20–40 ms. Therefore the optimal range for studying the paretic limb was 25–40 ms. The contralateral MEPs in the non-paretic limb and in the control subjects all had optimal ranges that included the narrower ipsilateral and contralateral range observed in the paretic limb. Therefore, the best ISI for studies of multiple muscles, or between ipsilateral and contralateral projections to the paretic limb, or between stroke and control groups would be 25–40 ms. This study has provided evidence of the efficacy of dual pulse TMS in consistently eliciting responses in distal and proximal muscles and enables the study of these muscles following stroke. This is a dramatic improvement over the single pulse method which yielded a poor representation of proximal and ipsilateral effects in these subjects.
Possible mechanisms of facilitation at medium interval ISIs
The exact mechanism causing the facilitation at the 25–40 ms ISIs is currently unknown. At medium latency ISIs of 10–50 ms, facilitation has been observed to occur in healthy subjects with a subthreshold first (conditioning) stimulus paired with a suprathreshold second (test) stimulus, with both stimuli at threshold, and with both stimuli suprathreshold (Abbruzzese et al., 1999; Claus et al., 1992; Nakamura et al., 1997; Valls-Sole et al., 1992). Cervical epidural recordings from the spine show that the volley of descending excitatory potentials (I-waves) produced by two stimuli 25 ms apart is augmented, demonstrating that MEP facilitation with this protocol (with a suprathreshold conditioning stimulus) is at least partly cortical in origin (Nakamura et al., 1997). The increased size and number of I waves in the descending volley most likely results in temporal and spatial facilitation at the spinal level as well. The excitatory post-synaptic potential in the spinal motoneuron can be prolonged for up to 30 ms by multiple descending volleys (Kernell and Chien-Ping, 1967a; Kernell and Chien-Ping, 1967b). In addition to corticospinal volleys, TMS may activate oligosynaptic corticofugal pathways such as corticobulbospinal or corticopropriospinal projections (MacKinnon et al., 2004; Ziemann et al., 1999) which could also contribute to the descending volleys or synapse onto spinal interneurons and result in facilitation. In the MacKinnon et al. study, the medium latency portion of the MEP, occurring 6 ms later than the short latency portion, was attributed to oligosynaptic connections which reach the muscle later than the fast corticospinal projections. Olivier et al. stimulated the medullary pyramid in the macaque monkey and did not record any later peaks in the post stimulus time histogram which would have indicated propriospinal activity, even when using paired pulse TMS (Olivier et al., 2001).
In this study we used 100% stimulation intensity to determine the optimal ISI window for MEP facilitation. In the stroke lesioned hemisphere, single pulse stimulation at 100% stimulation intensity has a low probability of eliciting a contralateral MEP. We chose to use 100% stimulation intensity for this dual pulse facilitation study in an effort to maximize the chances of evoking an MEP in the paretic limb, both with contralateral and ipsilateral hemisphere stimulation. With high stimulation intensity there is magnetic field spread resulting in a larger area of cortex being stimulated. There could be the concern that the MEP amplitude might be saturated and it could affect the determination of the optimal ISI window. In distal muscles, this effect would be most likely. However, in figure 5, and in more detail in the supplementary figure with individual muscles, it can be seen that the MEP amplitude is not saturated across the majority of ISIs, and may only be saturated in some subjects in the mid-range of ISIs. This may be part of the reason why the control subjects have wider ranges of optimal ISIs. Perhaps if we used a lower stimulation intensity we would see a narrowing of the optimal ISI range, more similar to the ipsilateral hemisphere stimulation responses.
There may be a difference between the control and stroke results in that for the distal muscles in controls, the first pulse of the dual pulse is of suprathreshold intensity, whereas in the stroke subjects, for all muscles, the first pulse is typically of subthreshold intensity, meaning that if the first pulse were given alone, an MEP would not be observed. This can be seen in both figure 3 and figure 4, where the MEP occurrence rate and magnitude is low with single pulse stimulation of the lesioned hemisphere or with ipsilateral hemisphere stimulation. It is known that the intensity of the first stimulus and the interstimulus interval both modulate the response of the second stimulus. However, even though these differences exist in the relationship of the stimulation intensity to the motor threshold, overall, the input-output curves look similar between stroke and control subjects.
Muscle Group ISI curves
The magnitude ISI response curve was very similar between the control group and the non-lesioned hemisphere of the stroke group for each of the 4 muscle groups studied. The major difference in the curves was seen in the ipsilateral responses in the paretic limb. In all muscle groups, the responses at the short interval ISIs (1, 3 and 5 ms) as well as for slightly longer ISIs (8, 10, 12, 15 ms) were all suppressed compared to the response at the medium interval ISIs (25, 30, 40 ms). This seems to suggest that: 1) both distal and proximal muscles use a similar descending ipsilateral pathway, 2) either the mechanism causing facilitation at the short interval ISIs is disrupted following stroke or the mechanism does not exist in the ipsilateral descending pathway, and/or 3) the mechanism causing facilitation at the medium interval ISIs is upregulated following stroke. Cervical epidural recordings of the descending corticospinal volley provided strong evidence that all these interactions occur at the level of the motor cortex (Di Lazzaro et al. 1998, 1999). In contrast, it is thought that short-interval intracortical facilitation reflects direct excitation of axon initial segments of excitatory intracortical interneurons by the second pulse, which had been depolarized and therefore made hyperexcitable by the preceding first pulse (Hanajima et al. 2002). Intracortical facilitation using excitatory cortical circuitry is presently thought to be the mechanism causing the facilitation at the shorter ISIs (Cash et al, 2009).
Studies have shown that intracortical facilitation in the lesioned hemisphere is not significantly different from the intracortical facilitation observed from the non-lesioned hemisphere (Liepert, 2006). However, a decrease in intracortical facilitation was observed in patients with a lesion in the region of the superior cerebellar artery and therefore intracortical facilitation may depend on the lesion location (Liepert et al., 2004). Studies of intracortical facilitation of the ipsilateral projection are lacking. In the present results, we observed facilitation of ipsilateral MEPs resulting from dual pulse magnetic stimulation of the contralesional hemisphere using a number of ISIs. However, the degree of facilitation was smaller at the short ISIs. One possible explanation for this would be a decrease in intracortical facilitation in the contralesional hemisphere. If this were the case, one would expect a concomitant decrease in the magnitude of response at the short ISIs in the contralateral MEPs elicited from the contralesional hemisphere, but that was not observed. As such, we don’t believe that the smaller degree of facilitation at short ISIs was a result of decreased intracortical facilitation within the contralesional cortex. Instead, we believe that the mechanism involved in facilitation at medium interval ISIs is upregulated after stroke. This would make sense if these responses are the result of activation of an oligosynaptic pathway which is typically difficult to activate in the normal state, but may be unmasked or upregulated following stroke. This data supports the theory that ipsilateral responses result from oligosynaptic activation in that the medium latency ISI responses are preserved or upregulated after stroke.
Effect of lesion location
The facilitatory effects of dual pulse stimulation was consistent across subjects independent of lesion site. In the 3 patients that had cortical involvement, we did not find any consistent difference in the muscles we were able to activate or in the optimal range of ISIs as compared to the rest of the patient group. The relative consistency in the facilitatory effects of the medium latency ISI dual pulse stimulation may suggest a common mechanism across muscles that is preserved following stroke, regardless of stroke location. However, a larger subject pool would be required with a better distribution of lesion locations to make conclusive statements asbout the effects of lesion site on dual pulse TMS facilitatory MEPs following stroke.
Benefits of dual pulse TMS
This dual pulse TMS technique allows us to study muscles not accessible with single pulse TMS at rest, and muscles where voluntary activation is difficult or abnormal due to co-activation of multiple proximal and distal muscles simultaneously, as is the case in many stroke survivors (Dewald et al., 1995). These abnormal multi-joint muscle coactivation patterns will bias motor evoked potentials obtained with TMS in subjects with brain injuries. In addition, studying the arm at rest allows for the study of multiple muscles at a time thereby limiting experiment lengths and avoiding fatigue. The ability to study multiple muscles simultaneously will be particularly useful for investigating the mechanisms of abnormal coordination in the paretic limb. The results of this study will also allow the study of proximal muscles with TMS in healthy subjects. In addition the results will provide the platform for thorough investigation of ipsilateral and contralateral connections to muscles of the paretic limb with TMS. This method could be an invaluable tool for studying the neuroplastic changes that occur in the motor system after stroke and determining the effectiveness of rehabilitation strategies. The results of this study demonstrate that a dual pulse TMS stimulation protocol with an intermediate interpulse interval allow for the activation of distal and more importantly proximal paretic muscles in brain injured human subjects.
Supplementary Material
The normalized magnitude of the response evoked with each ISI was averaged across subjects for each group and displayed for each muscle.
Acknowledgments
We thank Dr. Annette Weis McNulty for her evaluation of the lesion location on the anatomical MRIs. This work was supported by pre-doctoral fellowships from the American Heart Association (0010216Z and 0215258Z) and grants from the National Institutes of Health (R01 HD047569-01A1) and the Department of Education (NIDRR -H133G030143).
Footnotes
Publisher's Disclaimer: This is a PDF file of an unedited manuscript that has been accepted for publication. As a service to our customers we are providing this early version of the manuscript. The manuscript will undergo copyediting, typesetting, and review of the resulting proof before it is published in its final citable form. Please note that during the production process errors may be discovered which could affect the content, and all legal disclaimers that apply to the journal pertain.
References
- Abbruzzese G, Assini A, Buccolieri A, Schieppati M, Trompetto C. Comparison of intracortical inhibition and facilitation in distal and proximal arm muscles in humans. J Physiol. 1999;514 ( Pt 3):895–903. doi: 10.1111/j.1469-7793.1999.895ad.x. [DOI] [PMC free article] [PubMed] [Google Scholar]
- Alagona G, Delvaux V, Gerard P, De Pasqua V, Pennisi G, Delwaide PJ, Nicoletti F, Maertens de Noordhout A. Ipsilateral motor responses to focal transcranial magnetic stimulation in healthy subjects and acute-stroke patients. Stroke. 2001;32:1304–1309. doi: 10.1161/01.str.32.6.1304. [DOI] [PubMed] [Google Scholar]
- Cash RFH, Benwell NM, Murray K, Mastaglia FL, Thickbroom GW. Neuromodulation by paired-pulse TMS at an I-wave interval facilitates multiple I-waves. Exp Brain Res. 2009;193:1–7. doi: 10.1007/s00221-008-1590-7. [DOI] [PubMed] [Google Scholar]
- Chen R, Tam A, Butefisch C, Corwell B, Ziemann U, Rothwell JC, Cohen LG. Intracortical inhibition and facilitation in different representations of the human motor cortex. J Neurophysiol. 1998;80:2870–2881. doi: 10.1152/jn.1998.80.6.2870. [DOI] [PubMed] [Google Scholar]
- Cicinelli P, Traversa R, Rossini PM. Post-stroke reorganization of brain motor output to the hand: a 2-4 month follow-up with focal magnetic transcranial stimulation. Electroencephalogr Clin Neurophysiol. 1997;105:438–450. doi: 10.1016/s0924-980x(97)00052-0. [DOI] [PubMed] [Google Scholar]
- Cicinelli P, Pasqualetti P, Zaccagnini M, Traversa R, Oliveri M, Rossini PM. Interhemispheric asymmetries of motor cortex excitability in the postacute stroke stage: a paired-pulse transcranial magnetic stimulation study. Stroke. 2003;34:2653–2658. doi: 10.1161/01.STR.0000092122.96722.72. [DOI] [PubMed] [Google Scholar]
- Claus D, Weis M, Jahnke U, Plewe A, Brunholzl C. Corticospinal conduction studied with magnetic double stimulation in the intact human. J Neurol Sci. 1992;111:180–188. doi: 10.1016/0022-510x(92)90066-t. [DOI] [PubMed] [Google Scholar]
- Devanne H, Cassim F, Ethier C, Brizzi L, Thevenon A, Capaday C. The comparable size and overlapping nature of upper limb distal and proximal muscle representations in the human motor cortex. Eur J Neurosci. 2006;23:2467–2476. doi: 10.1111/j.1460-9568.2006.04760.x. [DOI] [PubMed] [Google Scholar]
- Dewald JP, Pope PS, Given JD, Buchanan TS, Rymer WZ. Abnormal muscle coactivation patterns during isometric torque generation at the elbow and shoulder in hemiparetic subjects. Brain. 1995;118 (Pt 2):495–510. doi: 10.1093/brain/118.2.495. [DOI] [PubMed] [Google Scholar]
- Di Lazzaro V, Rothwell JC, Oliviero A, Profice P, Insola A, Mazzone P, Tonali P. Intracortical origin of the short latency facilitation produced by pairs of threshold magnetic stimuli applied to human motor cortex. Exp Brain Res. 1999 Dec;129(4):494–9. doi: 10.1007/s002210050919. [DOI] [PubMed] [Google Scholar]
- Di Lazzaro V, Oliviero A, Profice P, Saturno E, Pilato F, Insola A, Mazzone P, Tonali P, Rothwell JC. Comparison of descending volleys evoked by transcranial magnetic and electric stimulation in conscious humans. Electroencephalogr Clin Neurophysiol. 1998 Oct;109(5):397–401. doi: 10.1016/s0924-980x(98)00038-1. [DOI] [PubMed] [Google Scholar]
- Fugl-Meyer AR, Jaasko L, Leyman I, Olsson S, Steglind S. The post-stroke hemiplegic patient. 1. a method for evaluation of physical performance. Scand J Rehabil Med. 1975;7:13–31. [PubMed] [Google Scholar]
- Hanajima R, Ugawa Y, Terao Y, Enomoto H, Shiio Y, Mochizuki H, Furubayashi T, Uesugi H, Iwata NK, Kanazawa I. Mechanisms of intracortical I-wave facilitation elicited with paired-pulse magnetic stimulation in humans. J Physiol. 2002 Jan 1;538(Pt 1):253–61. doi: 10.1113/jphysiol.2001.013094. [DOI] [PMC free article] [PubMed] [Google Scholar]
- Heald A, Bates D, Cartlidge NE, French JM, Miller S. Longitudinal study of central motor conduction time following stroke. 1. Natural history of central motor conduction. Brain. 1993;116 (Pt 6):1355–1370. doi: 10.1093/brain/116.6.1355. [DOI] [PubMed] [Google Scholar]
- Kendall, Kendall . In: Muscles, testing, and function. Kendall F, Kendall E, editors. Williams and Wilkins; Baltimore: 1983. [Google Scholar]
- Kernell D, Chien-Ping W. Post-synaptic effects of cortical stimulation on forelimb motoneurones in the baboon. J Physiol. 1967a;191:673–690. doi: 10.1113/jphysiol.1967.sp008274. [DOI] [PMC free article] [PubMed] [Google Scholar]
- Kernell D, Chien-Ping WU. Responses of the pyramidal tract to stimulation of the baboon's motor cortex. J Physiol. 1967b;191:653–672. doi: 10.1113/jphysiol.1967.sp008273. [DOI] [PMC free article] [PubMed] [Google Scholar]
- Kujirai T, Caramia MD, Rothwell JC, Day BL, Thompson PD, Ferbert A, Wroe S, Asselman P, Marsden CD. Corticocortical inhibition in human motor cortex. J Physiol. 1993;471:501–519. doi: 10.1113/jphysiol.1993.sp019912. [DOI] [PMC free article] [PubMed] [Google Scholar]
- Liepert J. Motor cortex excitability in stroke before and after constraint-induced movement therapy. Cogn Behav Neurol. 2006;19:41–47. doi: 10.1097/00146965-200603000-00005. [DOI] [PubMed] [Google Scholar]
- Liepert J, Hamzei F, Weiller C. Lesion-induced and training-induced brain reorganization. Restor Neurol Neurosci. 2004;22:269–277. [PubMed] [Google Scholar]
- MacKinnon CD, Quartarone A, Rothwell JC. Inter-hemispheric asymmetry of ipsilateral corticofugal projections to proximal muscles in humans. Exp Brain Res. 2004;157:225–233. doi: 10.1007/s00221-004-1836-y. [DOI] [PubMed] [Google Scholar]
- Nakamura H, Kitagawa H, Kawaguchi Y, Tsuji H. Intracortical facilitation and inhibition after transcranial magnetic stimulation in conscious humans. J Physiol. 1997;498 ( Pt 3):817–823. doi: 10.1113/jphysiol.1997.sp021905. [DOI] [PMC free article] [PubMed] [Google Scholar]
- Nakamura H, Kitagawa H, Kawaguchi Y, Tsuji H, Takano H, Nakatoh S. Intracortical facilitation and inhibition after paired magnetic stimulation in humans under anesthesia. Neurosci Lett. 1995;199:155–157. doi: 10.1016/0304-3940(95)12031-x. [DOI] [PubMed] [Google Scholar]
- Netz J, Lammers T, Homberg V. Reorganization of motor output in the non-affected hemisphere after stroke. Brain. 1997;120 ( Pt 9):1579–1586. doi: 10.1093/brain/120.9.1579. [DOI] [PubMed] [Google Scholar]
- Olivier E, Baker SN, Nakajima K, Brochier T, Lemon RN. Investigation into non-monosynaptic corticospinal excitation of macaque upper limb single motor units. J Neurophysiol. 2001;86:1573–1586. doi: 10.1152/jn.2001.86.4.1573. [DOI] [PubMed] [Google Scholar]
- Schwerin S, Dewald JP, Haztl M, Jovanovich S, Nickeas M, MacKinnon C. Ipsilateral versus contralateral cortical motor projections to a shoulder adductor in chronic hemiparetic stroke: implications for the expression of arm synergies. Exp Brain Res. 2008 Mar;185(3):509–19. doi: 10.1007/s00221-007-1169-8. Epub 2007 Nov 8. [DOI] [PMC free article] [PubMed] [Google Scholar]
- Talelli P, Greenwood RJ, Rothwell JC. Arm function after stroke: neurophysiological correlates and recovery mechanisms assessed by transcranial magnetic stimulation. Clin Neurophysiol. 2006;117:1641–1659. doi: 10.1016/j.clinph.2006.01.016. [DOI] [PubMed] [Google Scholar]
- Thickbroom GW, Sammut R, Mastaglia FL. Magnetic stimulation mapping of motor cortex: factors contributing to map area. Electroencephalogr Clin Neurophysiol. 1998;109:79–84. doi: 10.1016/s0924-980x(98)00006-x. [DOI] [PubMed] [Google Scholar]
- Traversa R, Cicinelli P, Bassi A, Rossini PM, Bernardi G. Mapping of motor cortical reorganization after stroke. A brain stimulation study with focal magnetic pulses. Stroke. 1997;28:110–117. doi: 10.1161/01.str.28.1.110. [DOI] [PubMed] [Google Scholar]
- Turton A, Lemon RN. The contribution of fast corticospinal input to the voluntary activation of proximal muscles in normal subjects and in stroke patients. Exp Brain Res. 1999;129:559–572. doi: 10.1007/s002210050926. [DOI] [PubMed] [Google Scholar]
- Turton A, Wroe S, Trepte N, Fraser C, Lemon RN. Contralateral and ipsilateral EMG responses to transcranial magnetic stimulation during recovery of arm and hand function after stroke. Electroencephalogr Clin Neurophysiol. 1996;101:316–328. doi: 10.1016/0924-980x(96)95560-5. [DOI] [PubMed] [Google Scholar]
- Valls-Sole J, Pascual-Leone A, Wassermann EM, Hallett M. Human motor evoked responses to paired transcranial magnetic stimuli. Electroencephalogr Clin Neurophysiol. 1992;85:355–364. doi: 10.1016/0168-5597(92)90048-g. [DOI] [PubMed] [Google Scholar]
- Ziemann U, Ishii K, Borgheresi A, Yaseen Z, Battaglia F, Hallett M, Cincotta M, Wassermann EM. Dissociation of the pathways mediating ipsilateral and contralateral motor-evoked potentials in human hand and arm muscles. J Physiol. 1999;518 ( Pt 3):895–906. doi: 10.1111/j.1469-7793.1999.0895p.x. [DOI] [PMC free article] [PubMed] [Google Scholar]
Associated Data
This section collects any data citations, data availability statements, or supplementary materials included in this article.
Supplementary Materials
The normalized magnitude of the response evoked with each ISI was averaged across subjects for each group and displayed for each muscle.