Abstract
Calorie restriction [CR; ∼65% of ad libitum (AL) intake] improves insulin-stimulated glucose uptake (GU) and Akt phosphorylation in skeletal muscle. We aimed to elucidate the effects of CR on 1) processes that regulate Akt phosphorylation [insulin receptor (IR) tyrosine phosphorylation, IR substrate 1-phosphatidylinositol 3-kinase (IRS-PI3K) activity, and Akt binding to regulatory proteins (heat shock protein 90, Appl1, protein phosphatase 2A)]; 2) Akt substrate of 160-kDa (AS160) phosphorylation on key phosphorylation sites; and 3) atypical PKC (aPKC) activity. Isolated epitrochlearis (fast-twitch) and soleus (slow-twitch) muscles from AL or CR (6 mo duration) 9-mo-old male F344BN rats were incubated with 0, 1.2, or 30 nM insulin and 2-deoxy-[3H]glucose. Some CR effects were independent of insulin dose or muscle type: CR caused activation of Akt (Thr308 and Ser473) and GU in both muscles at both insulin doses without CR effects on IRS1-PI3K, Akt-PP2A, or Akt-Appl1. Several muscle- and insulin dose-specific CR effects were revealed. Akt-HSP90 binding was increased in the epitrochlearis; AS160 phosphorylation (Ser588 and Thr642) was greater for CR epitrochlearis at 1.2 nM insulin; and IR phosphorylation and aPKC activity were greater for CR in both muscles with 30 nM insulin. On the basis of these data, our working hypothesis for improved insulin-stimulated GU with CR is as follows: 1) elevated Akt phosphorylation is fundamental, regardless of muscle or insulin dose; 2) altered Akt binding to regulatory proteins (HSP90 and unidentified Akt partners) is involved in the effects of CR on Akt phosphorylation; 3) Akt effects on GU depend on muscle- and insulin dose-specific elevation in phosphorylation of Akt substrates, including, but not limited to, AS160; and 4) greater IR phosphorylation and aPKC activity may contribute at higher insulin doses.
Keywords: glucose transport, insulin signaling, insulin resistance, TBC1D4, diet restriction
moderate calorie restriction (CR) without malnutrition (consuming ∼60–75% of ad libitum food intake) is characterized by multiple adaptations that can lead to improved function and health in many species. One of the hallmarks of CR is improved insulin sensitivity, which has been reported for mice (24), rats (29), rhesus monkeys (34), dogs (37), and humans (2). This effect is largely secondary to increased insulin-stimulated glucose uptake by skeletal muscle. The greater glucose uptake by insulin-stimulated muscle is attributable to greater recruitment of GLUT4 to cell surface membranes (18).
A number of studies have assessed the influence of CR on various aspects of the insulin-signaling pathway, which regulates GLUT4 vesicles in skeletal muscle (reviewed in Ref. 10). Binding of insulin to its receptor stimulates autophosphorylation, activating receptor tyrosine kinase to phosphorylate insulin receptor (IR) substrates (IRS). IRS1 is the predominant isoform in skeletal muscle, and tyrosine-phosphorylated IRS1 binds phosphatidylinositol 3-kinase (PI3K), which is essential for induction of GLUT4 translocation by insulin. A key post-PI3K activator of insulin-stimulated glucose transport is the Ser/Thr kinase known as Akt or PKB. IRS1-PI3K also activates atypical PKC (aPKC), an Akt-independent regulator of glucose transport (20, 21). The most striking and consistent effect of CR on an insulin-signaling protein in skeletal muscles has been a substantial increase in insulin-stimulated Akt phosphorylation (8, 38–41). Mammals express three Akt isoforms that have distinct, but overlapping, functions, and Akt1 and Akt2 are abundantly expressed by skeletal muscle. Akt2 has been identified as the isoform that is crucial for insulin-mediated GLUT4 translocation and glucose uptake (5, 31, 33, 35). Previous studies have demonstrated that CR leads to increased insulin-stimulated activation of Akt2 (39, 40). Furthermore, Akt2 is essential for the full effect of CR on insulin-stimulated glucose uptake in skeletal muscle, as evidenced by results from ad libitum-fed (AL) or CR wild-type and Akt2-null mice (39).
In a major breakthrough for understanding the mechanisms linking Akt to GLUT4 translocation and glucose transport, Kane et al. (32) demonstrated that insulin caused a protein they named Akt substrate of 160 kDa (AS160, also called TBC1D4) to become phosphorylated on multiple Akt phosphorylation motifs. Two sites (Thr642 and Ser588) were subsequently shown to be crucial for a large portion, but not all, of insulin-mediated GLUT4 translocation to cell surface membranes (45). Akt2 was later found to account for the insulin-stimulated AS160 phosphorylation (28, 36). The effects of CR on phosphorylation of AS160 on Thr642 or Ser588 have not been reported. Therefore, our first hypothesis was that the CR-induced elevations in insulin-stimulated Akt2 phosphorylation and glucose transport of skeletal muscle would be accompanied by enhanced AS160 phosphorylation on Thr642 and Ser588.
Our results from Akt2-null mice support the idea that Akt2 is important for CR-induced elevation of glucose uptake by skeletal muscle, but we also found evidence for an Akt2-independent mechanism (39). The influence of CR on activity of aPKC, a key Akt-independent regulator of insulin-stimulated glucose transport (20, 22), is uncertain. Our second hypothesis was that CR would enhance the insulin-mediated increase in aPKC activity. In light of the evidence that Akt2-independent mechanisms may not be identical in all muscles, we evaluated the predominantly fast-twitch epitrochlearis and the predominantly slow-twitch soleus.
The mechanisms leading to the consistent and relatively large effect of CR on Akt phosphorylation are unknown. IR function of skeletal muscle after CR has been reported to be unaltered in some (3, 4, 6, 7, 15, 52), but not all (4, 19, 48, 53), studies. Enhanced insulin-stimulated glucose transport in rat skeletal muscle in response to CR has been found in the absence of significantly elevated IRS1-PI3K activity (17–19). To gain insight into mechanisms for CR-associated activation of Akt2, we also assessed the effects of CR on IR tyrosine phosphorylation and IRS1-PI3K activity in the epitrochlearis and soleus. Increased expression of Appl1 (43) or heat shock protein 90 (HSP90) (46) is reported to enhance activation of Akt, and we determined the effect of CR on these proteins. We also assessed the effect of CR on Akt association with protein phosphatase 2A (PP2A), the key Ser/Thr protein phosphatase responsible for dephosphorylation of Akt. Our third hypothesis was that CR alters Akt binding to HSP90, Appl1, and/or PP2A.
Notable aspects of our experimental design were the use of multiple insulin doses and the relatively long duration of CR. To more clearly elucidate the effects of CR on key insulin-signaling proteins, we studied muscles in the absence of insulin, with a submaximally effective insulin dose, and with a supraphysiological insulin dose. In the current study, we used 6 mo of CR, so the rats would attain a relatively stable body weight at the time of analysis.
EXPERIMENTAL PROCEDURES
Materials.
Unless otherwise noted, all chemicals were purchased from Fisher Scientific (Hanover Park, IL) or Sigma Chemical (St. Louis, MO). Reagents and apparatus for SDS-PAGE and immunoblotting were obtained from Bio-Rad Laboratories (Richmond, CA). Anti-Appl1 (catalog no. ab59592) was obtained from Abcam (Cambridge, MA); anti-phospho-AS160 Ser588 (pAS160Ser588; catalog no. 3028P2) from B-Bridge International (Mountain View, CA); anti-PP2A (catalog no. 610555) from BD Biosciences (San Jose, CA); anti-Akt (catalog no. 9272), anti-5′-AMP-activated protein kinase subunit-α (AMPKα; catalog no. 2532), anti-PKCζ (catalog no. 9372), anti-phospho-Akt (Ser/Thr) substrate (PAS; catalog no. 9611), anti-phospho-Akt Thr308 (pAktThr308; catalog no. 9275), anti-phospho-Akt Ser473 (pAktSer473; catalog no. 9272), anti-phospho-AMPKα Thr172 (pAMPKThr172; catalog no. 2531), anti-GLUT4 (catalog no. 2299), anti-Grb2 (catalog no. 3972), and anti-rabbit IgG-horseradish peroxidase conjugate (catalog no. 7074) from Cell Signaling Technology (Danvers, MA); anti-HSP90 (catalog no. ADI-SPA-846) from Enzo Life Sciences (Plymouth Meeting, PA); anti-phospho-IR Tyr1162/1163 (pIRTyr1162/1163; catalog no. 44-504G) and anti-IR (catalog no. AHR0271) from Invitrogen (Camarillo, CA); anti-phospho-AS160 Thr642 (pAS160Thr642; catalog no. 07-802), anti-AS160 (catalog no. 07-741), anti-mouse IgG-horseradish peroxidase conjugate (catalog no. 12-349), and anti-sheep IgG horseradish peroxidase conjugate (catalog no. 12-342) from Millipore (Billerica, MA); anti-Akt2 (catalog no. AF23151) from R & D Biosystems (Minneapolis, MN); and anti-Akt1 (catalog no. sc-7126), anti-aPKCζ/λ (catalog no. sc-216), and anti-mouse IgG-horseradish peroxidase conjugate (catalog no. sc-2060) from Santa Cruz Biotechnology (Santa Cruz, CA). Anti-TBC1D1 was a gift from Dr. Makoto Kanzaki (Tohuda University). 2-Deoxy-d-[3H]glucose ([3H]2-DG) and [14C]mannitol were obtained from PerkinElmer (Boston, MA).
Animal care.
Procedures for animal care were approved by the University of Michigan Committee on Use and Care of Animals. Male Fischer 344 × Brown Norway, F1 generation rats were obtained at 3 mo of age from Harlan (Indianapolis, IN). Animals were housed individually in shoebox cages and maintained on a 12:12-h light-dark cycle (lights out at 1700) in specific pathogen-free conditions. Animals had free access to food (Lab Diet 5053, PMI Nutritional International, Brentwood, MO) and water for a 2-wk acclimation period. Animals then had free access to food (NIH31 chow, Test Diet, Richmond, IN) and water for another 2-wk acclimation period. During this time, we measured 24-h food consumption of all rats daily between 1530 and 1630 to determine baseline food intake (food provided − food remaining). After the acclimation period, rats were ranked by weight (lowest to highest) and alternately assigned to the AL (control) group or the CR (treatment) group, so that the initial mean weight was similar for both groups. After the 2-wk acclimation period, the AL group had ad libitum access to the NIH31 chow for the duration of the study. The CR group received NIH31/NIA Fortified chow (Test Diet), which contains extra vitamin supplementation to provide CR animals with a level of vitamins similar to that of animals allowed ad libitum access to the NIH31 diet. The CR group was restricted to 60–65% of the intake of the AL group gradually over 3 wk (90%, 75%, 60–65%). Thereafter, the CR group received 60–65% of the intake of the AL group daily for ∼6 mo (182–200 days). All rats were fed between 1530 and 1630 each day, and food intake of both groups was measured daily. All rats were weighed weekly at the same time of day. After the 6-mo treatment period, when they were 9 mo old, the rats were euthanized and a muscle incubation experiment was performed.
Muscle dissection and incubation.
On the morning of the day when muscles were dissected, food was removed from the cages of all rats between 0700 and 0800. Rats were anesthetized with an injection of pentobarbital sodium (50 mg/kg ip) between 1030 and 1130. When rats were deeply anesthetized, soleus and epitrochlearis muscles were rapidly removed. A scalpel was used to longitudinally transect each epitrochlearis muscle into two strips of similar size and each soleus muscle into four strips of similar size. Muscle strips were subsequently placed in vials containing the appropriate medium; the vials were shaken (45 rpm), continuously gassed (95% O2-5% CO2), and heated (35°C) in a water bath. All muscles were incubated in vials containing 2 ml of Krebs-Henseleit buffer (KHB) supplemented with 0.1% BSA, 2 mM sodium pyruvate, 6 mM mannitol, and 0 (basal), 1.2, or 30 nM insulin for 30 min. Each muscle was then transferred to a second vial containing 2 ml of KHB-BSA solution, the same insulin concentration used in the previous step, 1 mM 2-DG (including a final specific activity of 2.25 mCi/mmol [3H]2-DG), and 9 mM mannitol (including a final specific activity of 0.022 mCi/mmol [14C]mannitol) for 20 min. Then the muscles were blotted on filter paper moistened with ice-cold KHB, trimmed, freeze-clamped using aluminum tongs cooled in liquid nitrogen, and stored at −80°C for later processing and analysis.
Muscle lysate preparation.
Frozen muscles were weighed and transferred to prechilled glass tissue-grinding tubes (Kontes, Vineland, NJ) and homogenized in ice-cold lysis buffer (1 ml/muscle) using a glass pestle attached to a motorized homogenizer (Caframo, Wiarton, ON, Canada). The lysis buffer contained tissue protein extraction reagent (catalog no. PI-78510, Thermo Scientific, Rockford, IL), 1 mM EDTA, 1 mM EGTA, 2.5 mM sodium pyrophosphate, 1 mM Na3VO4, 1 mM β-glycerophosphate, 1 μg/ml leupeptin, and 1 mM PMSF. Homogenates were transferred to microfuge tubes, rotated for 1 h at 4°C, and then centrifuged at 15,000 g for 15 min at 4°C to remove insoluble material. Protein concentration was measured using the bicinchoninic acid protein assay kit (catalog no. 23227, Thermo Scientific).
Immunoprecipitation.
For evaluation of Akt protein association, 300 μg of protein from each sample were combined with a 1:1,000 titer of Akt antibody and rotated overnight at 4°C. Protein G-agarose beads (catalog no. 16-266, Upstate, Lake Placid, NY) were washed three times with lysis buffer and resupended in lysis buffer to yield a 50% slurry. After initial antibody incubation, 100 μl of the 50% slurry mixture of protein G-agarose beads were added to the lysate-antibody mixture and rotated for 2 h at 4°C. Protein G-agarose beads were isolated by centrifugation (4,000 g at 4°C for 1 min) and washed three times in lysis buffer. Antigens were eluted from the beads with 45 μl of 2× SDS loading buffer and boiled for 5 min before SDS-PAGE (see below). For evaluation of Akt1 and Akt2 phosphorylation (Thr308 or Ser473), ExactaCruz C beads (catalog no. sc-45040, Santa Cruz Biotechnology) were prepared by three washes in PBS and resuspended in 500 μl of PBS. Goat anti-Akt1 or anti-Akt2 antibody (3 μg per sample) was incubated with ExactaCruz C beads (50 μl per sample) and rotated for 3 h at 4°C. The antibody-bead complex was then washed three times with PBS and resuspended to yield a 50% slurry. A 50-μl aliquot of the bead-antibody complex was added to each sample of 200 μg of muscle lysate in 1 ml of PBS and slowly rotated overnight at 4°C. The immunoprecipitation matrix (bead-antibody-antigen) for each sample was washed three times with PBS, with complete aspiration of buffer after the final wash, and 50 μl of 2× Laemmli buffer was added. Samples were boiled for 5 min and centrifuged, and supernatants were subjected to 10% SDS-PAGE (see below) and blotted for pAktThr308 or pAktSer473.
Immunoblotting.
Equal amounts of protein from each sample were mixed with 6× Laemmli buffer (20% of protein sample volume), boiled for 5 min, separated by 7% or 10% SDS-PAGE, and then transferred to nitrocellulose (catalog no. 162-0094) or polyvinylidene difluoride (catalog no. 162-0177) membranes (Bio-Rad). Membranes were blocked in the appropriate buffer for 1 h at room temperature and transferred to buffer with primary antibody overnight at 4°C. After they were washed, the membranes were placed in buffer containing the appropriate secondary antibody (1:20,000 dilution) for 1 h at room temperature. Membranes were then washed and subjected to enhanced chemiluminescence (West Dura Extended Duration Substrate, catalog no. 34075, Pierce) for visualization of protein bands. Immunoreactive proteins were quantified by densitometry (AlphaEase FC, Alpha Innotech, San Leandro, CA).
IRS-1-associated PI3K activity.
IRS1-PI3K activity in epitrochlearis and soleus muscles was determined as previously described (19). After addition of 3 μg of anti-IRS-1 antibody to 600 μg of supernatant protein from each muscle sample, the immunocomplexes were allowed to form overnight at 4°C with slow rotation. Then 100 μl of protein A-Sepharose beads (catalog no. 17-0469-01, GE Healthcare, Piscataway, NJ; 50% slurry) were then added to each aliquot, and samples were rotated for 2 h at 4°C. Samples were centrifuged at 2,000 g to pellet the protein A-Sepharose immunocomplex. Each immunopellet was washed three times with buffer 1 (PBS, pH 7.5, containing 1% NP-40 and 100 μM Na3VO4), three times with buffer 2 (100 mM Tris, pH 7.5, 500 mM LiCl2, and 100 μM Na3VO4), and twice with buffer 3 (10 mM Tris, pH 7.5, 100 mM NaCl, 1 mM EDTA, and 100 μM Na3VO4). After the immunopellet was washed, all the buffer was removed, and the immunopellet was resuspended in 40 μl of the Tris·NaCl, pH 7.5, buffer containing 20 μg of phosphatidylinositol (PI; Avanti Polar Lipids, Alabaster, AL) and 100 mM MgCl2. The reaction was initiated at room temperature by addition of 5 μl of a phosphorylation mixture containing 880 μM ATP and 30 μCi of γ-[32P]ATP (PerkinElmer). After 40 min with continuous rotation, the reaction was stopped by sequential addition of 20 μl of 8 N HCl and 160 μl of chloroform-methanol (1:1). The reaction mixture was vortexed for 5 min and then centrifuged at 15,000 g for 2 min; 50 μl of the organic phase containing the reaction products was spotted onto a TLC plate (Whatman, Piscataway, NJ). The products were resolved in a chloroform-methanol-water-ammonium hydroxide (60:47:11.3:2) solution and visualized by autoradiography. The spots corresponding to the PI phosphorylated product were scraped from the TLC plate and counted in a scintillation counter.
aPKCζ/λ activity.
As previously described (47), aPKC was immunoprecipitated from lysates (500 μg) with a rabbit polyclonal antibody that recognized the COOH terminus of PKCζ and PKCλ. Sepharose-AG beads (Santa Cruz Biotechnology) were added, and the mixture was incubated for 8 min at 30°C in 100 μl of buffer containing 50 mM Tris·HCl (pH 7.5), 100 μM Na3VO4, 100 μM Na4P2O7, 1 mM NaF, 100 μM PMSF, 4 μg of phosphatidylserine, 50 μM γ-[32P]ATP, 5 mM MgCl2, and, as substrate, 40 μM serine analog of PKCε (BioSource, Carlsbad, CA). After incubation, 32P-labeled substrate was trapped on P-81 filter papers, which were placed in scintillation vials with scintillation cocktail, and disintegrations per minute were quantified by liquid scintillation counting.
2-DG uptake.
Aliquots (200 μl) of the supernatants from centrifuged muscle lysates were combined in a vial with 10 ml of scintillation cocktail (Research Products International, Mount Prospect, IL), and a scintillation counter (PerkinElmer) was used to determine 3H and 14C disintegrations per minute. These values were used to determine [3H]2-DG uptake, as previously described (11, 30). To assess insulin-induced effects on insulin signaling and glucose uptake, Δ values were determined by subtraction of the 0 nM (basal) insulin value from the corresponding values for the insulin-stimulated muscle (1.2 or 30 nM) from the same rat.
Statistical analysis.
Student's t-test was used for body mass, epididymal fat pad mass, epididymal fat pad-to-body mass ratio, total protein abundance, and Δinsulin values. For the soleus and epitrochlearis, two-way ANOVA was used to determine significant main effects (diet and insulin concentration) and interactions (SigmaStat, SPSS, Chicago, IL). Bonferroni's t-tests were used for post hoc analysis to identify the source of significant variance. A t-test was used to compare weekly weights between AL and CR groups, the Δinsulin values between AL and CR groups at each insulin concentration, and the association of proteins to Akt between diet groups. Values are means ± SE. P ≤ 0.05 was accepted as statistically significant.
RESULTS
Anthropometric data.
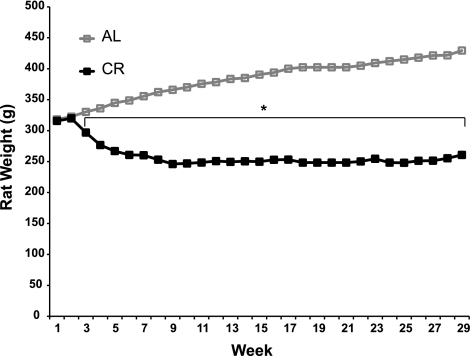
Body mass and food consumption were measured weekly. Prior to initiation of CR, body masses of the AL (318.1 ± 3.3 g, n = 28) and CR (315.7 ± 3.4 g, n = 27) groups were not significantly different (Fig. 1). Final body mass was significantly (P < 0.001) lower in the CR than the AL group (260.8 ± 2.9 vs. 429.4 ± 4.2 g). Epididymal fat pad mass was significantly (P < 0.001) lower in the CR than the AL group (1.09 ± 0.16 vs. 7.25 ± 0.69 g, n = 8). Epididymal fat pad-to-body mass ratio [epididymal fad pad mass (mg)/final body mass (g)] was significantly (P < 0.001) lower in the CR than the AL group (5.0 ± 0.4 vs. 19.0 ± 0.7, n = 8).
Fig. 1.
Weekly average body mass of ad libitum-fed (AL, n = 28) and calorie-restricted (CR, n = 27) rats. Values for week 1 represent baseline body masses. In week 2, CR rats were given 90% of intake of AL rats. In week 3, CR rats were given 75% of intake of AL rats. In week 4 and thereafter, CR rats were given 60–65% of intake of AL rats. Body mass was significantly smaller for CR than AL rats (*P < 0.05) at week 3 and every subsequent week. To improve clarity, SE bars are not included; SE = 3.13–4.41 g for AL group and 2.46–3.84 g for CR group.
2-DG uptake and GLUT4 abundance.
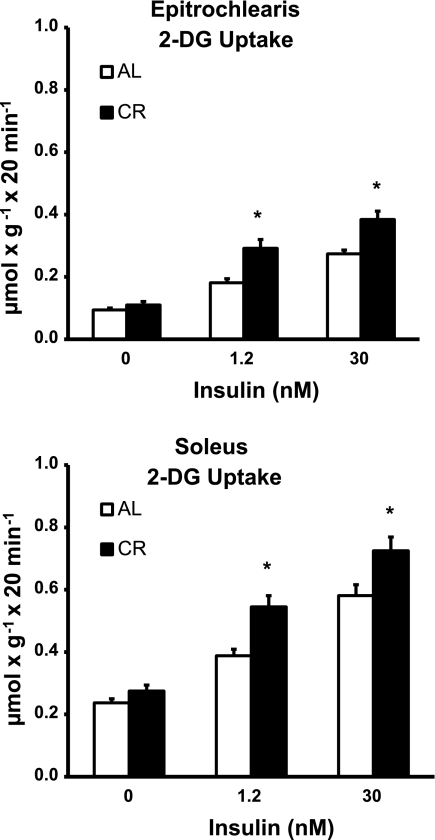
Basal 2-DG uptake of the epitrochlearis was not statistically different between CR and AL rats (Fig. 2). Epitrochlearis 2-DG uptake was significantly increased (P < 0.05) for CR vs. AL rats with 1.2 nM (61% increase) and 30 nM (40% increase) insulin. To assess insulin's effects above baseline (Δinsulin), insulin stimulation of 2-DG uptake above basal values was determined by subtraction of the value of the 0 nM insulin group from the values of the 1.2 and 30 nM insulin groups for each rat (see Supplemental Table S1 in Supplemental Material for this article, available online at the Journal website). The Δinsulin 2-DG uptake values for the epitrochlearis were significantly increased (P < 0.05) for the CR group vs. the AL group with 1.2 nM (110% increase) or 30 nM (52% increase) insulin (see Supplemental Table S1). Basal 2-DG uptake of the soleus was not statistically different between CR and AL rats with 0 nM insulin (Fig. 2). Soleus 2-DG uptake was significantly increased (P < 0.05) in CR vs. AL rats with 1.2 nM (40% increase) and 30 nM (25% increase) insulin. The Δinsulin 2-DG uptake values for the soleus were significantly increased (P < 0.05) for the CR vs. the AL group with 1.2 nM insulin (79% increase), and there was a statistically nonsignificant trend (P = 0.079) for a CR effect with 30 nM insulin (see Supplemental Table S1).
Fig. 2.
2-Deoxy-d-glucose (2-DG) uptake in epitrochlearis and soleus muscles with 0, 1.2, or 30 nM insulin. *P < 0.05, CR vs. AL in the same insulin treatment group. ANOVA P values are as follows: for epitrochlearis, P < 0.001 (diet), P < 0.001 (insulin), and P = 0.012 (interaction); for soleus, P < 0.001 (diet), P < 0.001 (insulin), and P = 0.096 (interaction). Values are means ± SE; n = 16–18 muscles per diet group and insulin concentration.
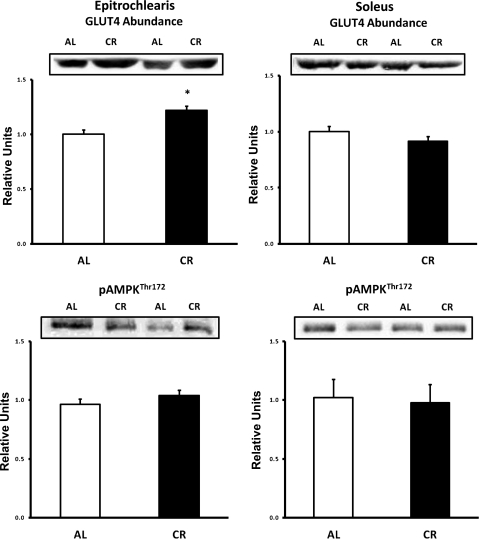
In the epitrochlearis, GLUT4 protein abundance was significantly increased (P < 0.05) in the CR vs. the AL group (Fig. 3). There was no difference in GLUT4 abundance between the diet groups in the soleus.
Fig. 3.
Top: GLUT4 protein abundance in epitrochlearis and soleus muscles. Bottom: 5′-AMP-activated protein kinase (AMPK) phosphorylation (Thr172) in epitrochlearis and soleus muscles. *P < 0.05, CR vs. AL. Values are means ± SE; n = 8–14 muscles per diet group.
AMPK phosphorylation and abundance.
There was no difference in AMPK phosphorylation (Thr172) between the diet groups in the epitrochlearis or soleus (Fig. 3). There was no difference in AMPK protein abundance between the diet groups in the epitrochlearis or soleus (Table 1).
Table 1.
Protein abundance
| Epitrochlearis |
Soleus |
|||
|---|---|---|---|---|
| AL | CR | AL | CR | |
| IR | 1.000 ± 0.090 | 0.999 ± 0.108 | 1.000 ± 0.297 | 0.674 ± 0.152 |
| AMPK | 1.000 ± 0.040 | 1.016 ± 0.040 | 1.000 ± 0.032 | 0.902 ± 0.070 |
| aPKCζ | 1.000 ± 0.083 | 1.067 ± 0.059 | 1.000 ± 0.075 | 0.985 ± 0.037 |
| Akt | 1.000 ± 0.057 | 1.161 ± 0.149 | 1.000 ± 0.081 | 1.193 ± 0.068 |
| Akt1 | 1.000 ± 0.071 | 1.173 ± 0.133 | 1.000 ± 0.050 | 1.006 ± 0.102 |
| Grb2 | 1.000 ± 0.073 | 1.024 ± 0.092 | 1.000 ± 0.047 | 1.010 ± 0.048 |
| Appl1 | 1.000 ± 0.190 | 1.129 ± 0.182 | 1.000 ± 0.135 | 0.980 ± 0.121 |
| HSP90 | 1.000 ± 0.103 | 1.192 ± 0.214 | 1.000 ± 0.090 | 1.166 ± 0.121 |
| PP2A | 1.000 ± 0.040 | 1.030 ± 0.029 | 1.000 ± 0.025 | 0.991 ± 0.036 |
| AS160 | 1.000 ± 0.034 | 0.909 ± 0.049 | 1.000 ± 0.145 | 1.066 ± 0.122 |
| TBC1D1 | 1.000 ± 0.071 | 0.904 ± 0.054 | 1.000 ± 0.097 | 1.008 ± 0.166 |
Values are means ± SE; n = 8–14 per group. AL, ad libitum-fed; CR, calorie-restricted; IR, insulin receptor; AMPK, 5′-AMP-activated protein kinase; aPKCζ, atypical PKCζ; ΗSP90, heat shock protein 90; PP2A, protein phosphatase 2A.
IR phosphorylation and abundance.
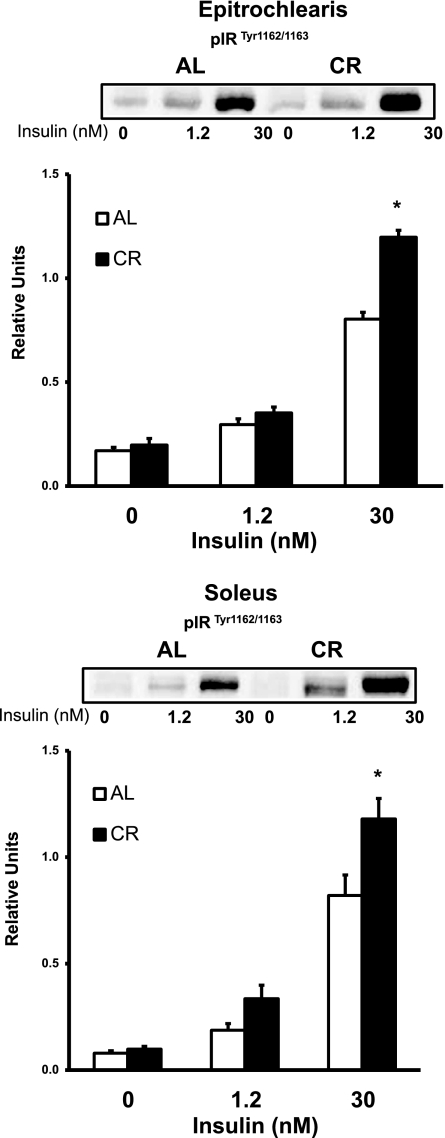
Epitrochlearis IR phosphorylation (Tyr1162/1163) was not different between AL and CR groups with 0 or 1.2 nM insulin (Fig. 4). Epitrochlearis IR phosphorylation was significantly increased (P < 0.05) in the CR vs. the AL group with 30 nM insulin. There was no difference in IR protein abundance between the diet groups in the epitrochlearis (Table 1). In the soleus, IR phosphorylation was not different between the AL and CR groups with 0 or 1.2 nM insulin. IR phosphorylation was significantly increased (P < 0.05) in the CR vs. the AL group with 30 nM insulin. In the soleus, there also was no difference in IR protein abundance between the diet groups.
Fig. 4.
Insulin receptor (IR) tyrosine phosphorylation (Tyr1162/1163) in epitrochlearis and soleus muscles with 0, 1.2, or 30 nM insulin. *P < 0.05, CR vs. AL in the same insulin treatment group. ANOVA P values are as follows: for epitrochlearis, P < 0.001 (diet), P < 0.001 (insulin), and P < 0.001 (interaction); for soleus, P = 0.002 (diet), P < 0.001 (insulin), and P = 0.036 (interaction). Values are means ± SE; n = 6 muscles per diet group and insulin concentration.
IRS1-associated PI3K activity.
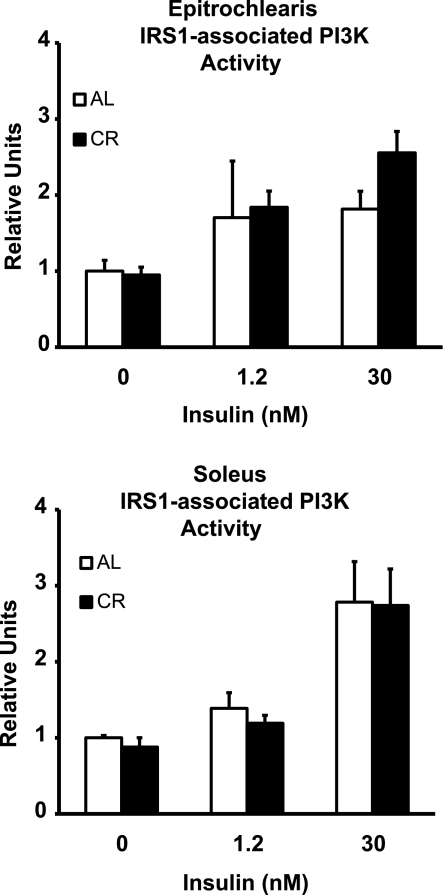
In the epitrochlearis and soleus, there were no significant diet effects on IRS1-PI3K activity, regardless of the insulin concentration (Fig. 5).
Fig. 5.
IR substrate 1 (IRS1)-associated phosphatidylinositol 3-kinase (PI3K) activity in epitrochlearis and soleus muscles with 0, 1.2, or 30 nM insulin. ANOVA P values are as follows: for epitrochlearis, P = 0.630 (diet), P = 0.224 (insulin), and P = 0.838 (interaction); for soleus, P = 0.641 (diet), P < 0.001 (insulin), and P = 0.971 (interaction). Values are means ± SE; n = 6 muscles per diet group and insulin concentration.
aPKCλ/ζ activity.
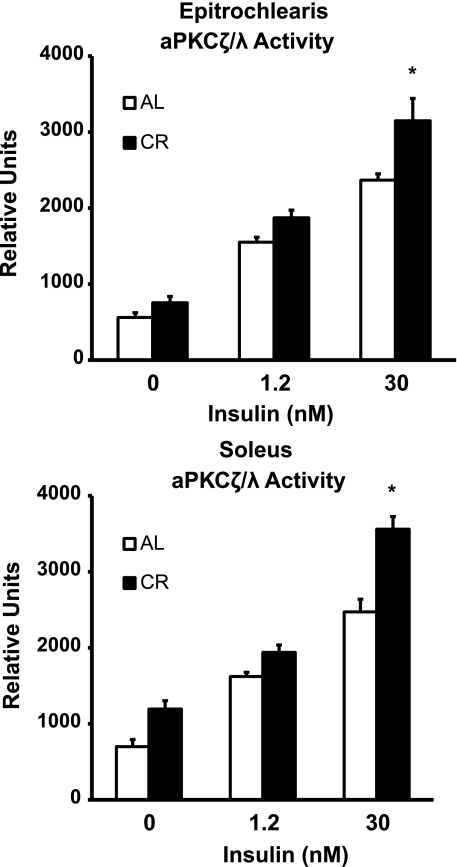
In the epitrochlearis, there were no differences in aPKC activity between AL and CR rats with 0 or 1.2 nM insulin (Fig. 6). There was a significant increase (P < 0.05) in aPKC activity in the CR vs. the AL group with 30 nM insulin. Similarly, in the soleus, there was no dietary effect with 0 or 1.2 nM insulin but a significant increase (P < 0.05) in the CR vs. the AL group with 30 nM insulin. There was no difference in aPKCζ protein abundance with diet in either muscle (Table 1).
Fig. 6.
Atypical PKC (aPKCζ/λ) activity in epitrochlearis and soleus muscles with 0, 1.2, or 30 nM insulin. *P < 0.05, CR vs. AL in the same insulin treatment group. ANOVA P values are as follows: for epitrochlearis, P < 0.001 (diet), P < 0.001 (insulin), and P = 0.081 (interaction); for soleus, P < 0.001 (diet), P < 0.001 (insulin), and P = 0.007 (interaction). Values are means ± SE; n = 8 muscles per diet group and insulin concentration.
Akt phosphorylation, protein abundance, and protein association.
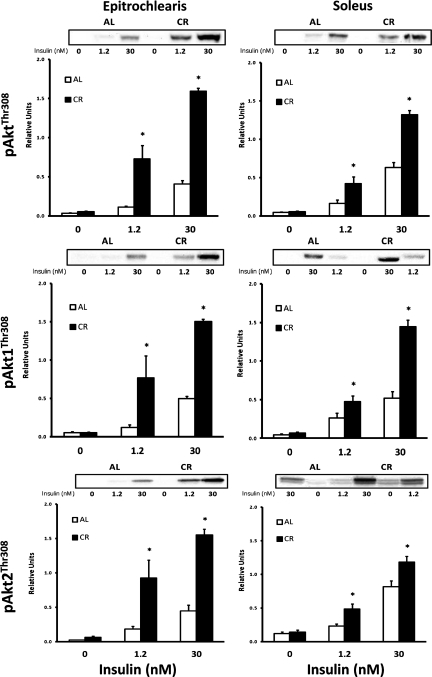
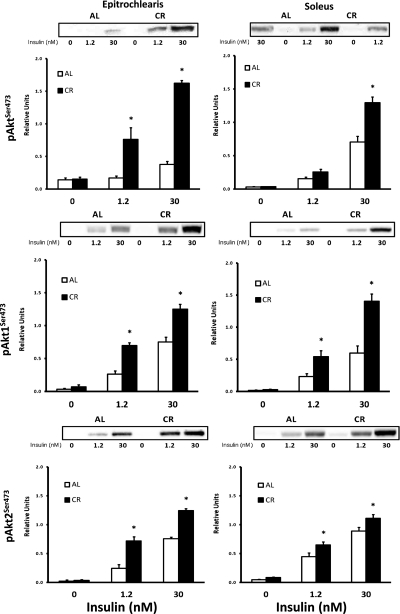
In the epitrochlearis without insulin, there was no diet-related difference in phosphorylation of Akt at Thr308 (pAktThr308; Fig. 7) or Ser473 (pAktSer473; Fig. 8). There was a significant CR-related increase (P < 0.05) in pAktThr308 and pAktSer473 with 1.2 and 30 nM insulin. Muscle lysates were immunoprecipitated with the antibody for Akt1 or Akt2 and immunoblotted with pAktThr308 or pAktSer473 to determine site-specific phosphorylation of Akt1 (pAkt1Thr308 or pAkt1Ser473; Figs. 7 and 8) or Akt2 (pAkt2Thr308 or pAkt2Ser473; Figs. 7 and 8). For the epitrochlearis, without insulin there was no CR-related difference for pAkt1Thr308 or pAkt2Thr308. There was a significant CR-related increase (P < 0.05) in both Akt isoforms at both phosphorylation sites with 1.2 and 30 nM insulin. In the soleus, Akt, Akt1, and Akt2 phosphorylation on each site was significantly greater in the CR than the AL group with 1.2 and 30 nM insulin. In the soleus, total Akt, Akt1, and Akt2 phosphorylation was significantly greater (P < 0.05) in the CR than the AL group at both phosphorylation sites, except there was no significant diet effect (P = 0.179) in pAktSer473 with 1.2 nM insulin.
Fig. 7.
Top: Akt Thr308 phosphorylation (pAktThr308) in epitrochlearis and soleus muscles with 0, 1.2, or 30 nM insulin. Middle: pAkt1Thr308 in epitrochlearis and soleus muscles with 0, 1.2, or 30 nM insulin. Muscle lysate was immunoprecipitated with Akt1 antibody prior to immunoblotting with phospho-AktThr308 antibody. Bottom: pAkt2Thr308 in epitrochlearis and soleus muscles with 0, 1.2, or 30 nM insulin. Muscle lysate was immunoprecipitated with Akt2 antibody prior to immunoblotting with phospho-AktThr308 antibody. *P < 0.05, CR vs. AL in the same insulin treatment group. ANOVA P values are as follows: for epitrochlearis pAktThr308, P = 0.203 (diet), P = 0.012 (insulin), and P = 0.081 (interaction); for pAkt1Thr308, P < 0.001 (diet), P < 0.001 (insulin), and P < 0.001 (interaction); for pAkt2Thr308, P < 0.001 (diet), P < 0.001 (insulin), and P = 0.001 (interaction); for soleus pAktThr308, P < 0.001 (diet), P < 0.001 (insulin), and P < 0.001 (interaction); for pAkt1Thr308, P < 0.001 (diet), P < 0.001 (insulin), and P < 0.001 (interaction); for pAkt2Thr308, P < 0.001 (diet), P < 0.001 (insulin), and P = 0.024 (interaction). Values are means ± SE; n = 6–12 muscles per diet group and insulin concentration.
Fig. 8.
Top: Akt Ser473 phosphorylation (pAktSer473) in epitrochlearis and soleus muscles with 0, 1.2, or 30 nM insulin. Middle: pAkt1Ser473 in epitrochlearis and soleus muscles with 0, 1.2, or 30 nM insulin. Muscle lysate was immunoprecipitated with Akt1 antibody prior to immunoblotting with phospho-AktSer473 antibody. Bottom: pAkt2Ser473 in epitrochlearis and soleus muscles with 0, 1.2, or 30 nM insulin. Muscle lysate was immunoprecipitated with Akt2 antibody prior to immunoblotting with phospho-AktSer473 antibody. *P < 0.05, CR vs. AL in the same insulin treatment group. ANOVA P values are as follows: for epitrochlearis pAktSer473, P < 0.001 (diet), P < 0.001 (insulin), and P < 0.001 (interaction); for pAkt1Ser473, P < 0.001 (diet), P < 0.001 (insulin), and P = 0.002 (interaction); for pAkt2Ser473, P = 0.032 (diet), P < 0.001 (insulin), and P = 0.093 (interaction); for soleus pAktSer473, P < 0.001 (diet), P < 0.001 (insulin), and P < 0.001 (interaction); for pAkt1Ser473, P < 0.001 (diet), P < 0.001 (insulin), and P < 0.001 (interaction); for pAkt2Ser473, P = 0.001 (diet), P < 0.001 (insulin), and P = 0.164 (interaction). Values are means ± SE; n = 8 muscles per diet group and insulin concentration.
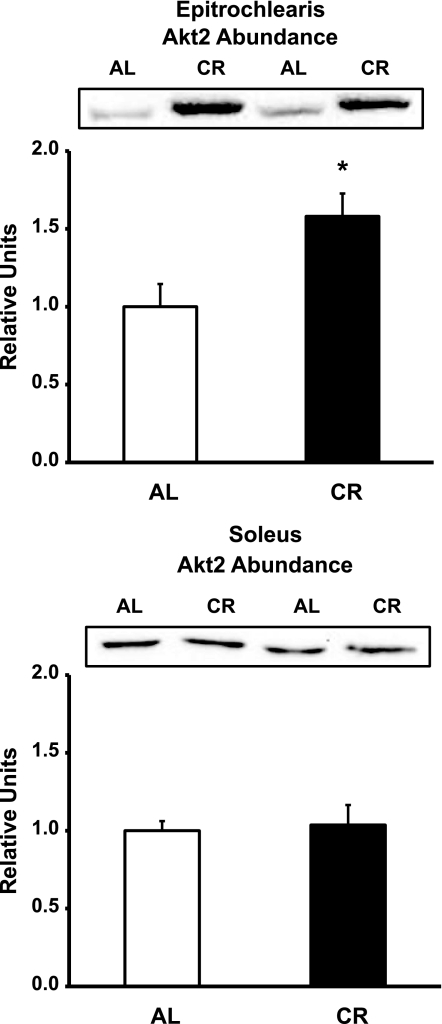
In the epitrochlearis, there was no dietary effect in total Akt or Akt1 abundance (Table 1), but there was a significantly greater (P < 0.05) amount of Akt2 in the CR than the AL group (Fig. 9). In the soleus, there was no difference in total Akt, Akt1, or Akt2 abundance between the AL and CR groups (Table 1).
Fig. 9.
Akt2 protein abundance in epitrochlearis and soleus muscles. *P < 0.05, CR vs. AL. Values are means ± SE; n = 14 muscles per diet group.
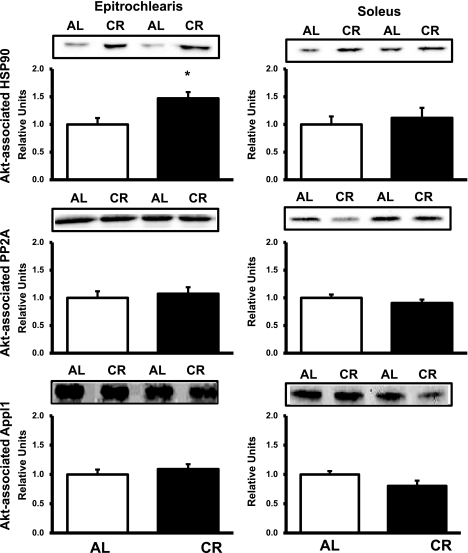
In the epitrochlearis, there was a significantly greater (P < 0.05) association between Akt and HSP90 in the CR than the AL group (Fig. 10). There was no difference in Akt association with PP2A or Appl1 between the AL and CR groups (Fig. 10). In the soleus, there was no difference in Akt association with any of the proteins evaluated between the AL and CR groups (Fig. 10). Protein abundance for Grb2, Appl1, and HSP90 was not different between the AL and CR groups for the epitrochlearis or soleus (Table 1).
Fig. 10.
Akt association with heat shock protein 90 (HSP90, top), protein phosphatase 2A (PP2A, middle), or Appl1 (bottom) in epitrochlearis and soleus muscles. Muscle lysate was immunoprecipitated with Akt antibody prior to immunoblotting with HSP90, PP2A, or Appl1 antibody. *P < 0.05, CR vs. AL in the same insulin treatment group. Values are means ± SE; n = 8–14 muscles per diet group.
AS160 phosphorylation and abundance.
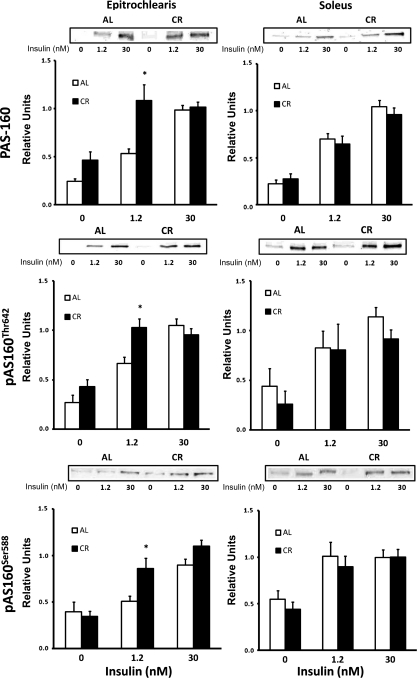
We evaluated AS160 phosphorylation with three different approaches: 1) quantification of the 160-kDa band using the PAS antibody [which recognizes multiple phosphorylation sites on AS160 (pAS160); Fig. 11] and 2) use of phosphorylation site-specific antibodies against Thr642 (pAS160Thr642; Fig. 11) and Ser588 (pAS160Ser588; Fig. 11). In the epitrochlearis, pAS160, pAS160Thr642, and pAS160Ser588 were each significantly greater (P < 0.05) in the CR than the AL group with 1.2 nM insulin, but there was no dietary effect for any of these variables at 0 or 30 nM insulin. In the soleus, there was no significant dietary effect on any of these indicators of AS160 phosphorylation, regardless of the insulin concentration.
Fig. 11.
Top: immunoreactivity of the 160-kDa band after immunoblotting with phospho-Akt substrate (PAS) antibody in epitrochlearis and soleus muscles with 0, 1.2, or 30 nM insulin. Middle: pAS160Thr642 in epitrochlearis and soleus muscles with 0, 1.2, or 30 nM insulin. Bottom: pAS160Ser588 in epitrochlearis and soleus muscles with 0, 1.2, or 30 nM insulin. *P < 0.05, CR vs. AL in the same insulin treatment group. ANOVA P values are as follows: for epitrochlearis PAS-160, P < 0.001 (diet), P < 0.001 (insulin), and P = 0.011 (interaction); for pAS160Thr642, P = 0.02 (diet), P < 0.001 (insulin), and P = 0.01 (interaction); for pAS160Ser588, P = 0.013 (diet), P < 0.001 (insulin), and P = 0.046 (interaction); for soleus PAS-160, P = 0.624 (diet), P < 0.001 (insulin), and P = 0.559 (interaction); for pAS160Thr642, P = 0.303 (diet), P < 0.001 (insulin), and P = 0.813 (interaction); for pAS160Ser588, P = 0.4 (diet), P < 0.001 (insulin), and P = 0.816 (interaction). Values are means ± SE; n = 7–14 muscles per dietary group and insulin concentration.
Total AS160 protein abundance in the epitrochlearis and soleus was unchanged with diet (Table 1).
PAS-150 phosphorylation and TBC1D1 abundance.
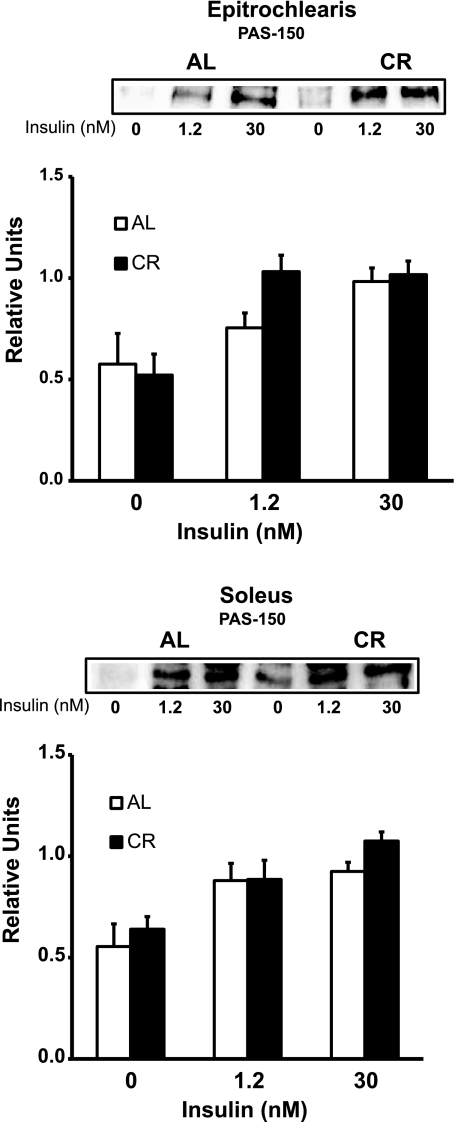
We evaluated total TBC1D1 phosphorylation using the PAS antibody and quantifying the 150-kDa band (PAS-150), which corresponds to phosphorylated TBC1D1 (23). In the epitrochlearis and soleus, there was no significant dietary effect on PAS-150, regardless of the insulin concentration (Fig. 12).
Fig. 12.
Immunoreactivity of the 150-kDa band after immunoblotting with phospho-Akt substrate (PAS) antibody in epitrochlearis and soleus muscles with 0, 1.2, or 30 nM insulin. ANOVA P values are as follows: for epitrochlearis, P = 0.271 (diet), P < 0.001 (insulin), and P = 0.207 (interaction); for soleus, P = 0.215 (diet), P < 0.001 (insulin), and P = 0.661 (interaction). Values are means ± SE; n = 8 muscles per diet group and insulin concentration.
Total TBC1D1 protein abundance in the epitrochlearis and soleus was unchanged with diet (Table 1).
DISCUSSION
Our previous research using rats and Akt2-null mice implied that a combination of Akt2-dependent and -independent mechanisms was involved in the CR effect on glucose uptake (40). We hypothesized that 1) the Akt2-dependent mechanism would require enhanced AS160 phosphorylation on Thr642 and Ser588, 2) the Akt2-independent mechanism would involve an elevated insulin-mediated increase in skeletal muscle aPKC activity, and 3) CR would alter Akt binding to proteins that have been shown to regulate Akt phosphorylation, including HSP90, Appl1, and/or PP2A. In support of hypothesis 1, Akt2 phosphorylation was increased for the CR vs. the AL group in the epitrochlearis and soleus with both insulin doses concomitant with greater glucose uptake and a CR-induced increase in AS160 phosphorylation on Thr642 and Ser588 in the epitrochlearis with the submaximally effective insulin concentration. However, AS160 phosphorylation was not greater for the CR than the AL epitrochlearis with the higher insulin dose or soleus with either dose. In support of hypothesis 2, aPKC activity of both muscles from the CR vs. the AL group was increased with the supraphysiological insulin dose. However, aPKC activity was not different between diet groups with the lower insulin dose in either muscle. In support of hypothesis 3, CR caused an increase in Akt binding to HSP90 in the epitrochlearis, but not the soleus, without altering Appl1 or PP2A binding to Akt in either muscle. These observations suggest that some of the mechanisms accounting for CR-induced increases in insulin-stimulated glucose uptake may be specific to the muscle and the insulin dose, and the regulation of glucose uptake by Akt2 may involve substrates other than AS160.
The most consistent and substantial effect of CR on insulin signaling in skeletal muscle is an increased Akt phosphorylation (8, 10, 38–40). In the current study, Akt1 and Akt2 phosphorylation on the two key regulatory sites (Thr308 and Ser473) were increased by CR in both muscles with both insulin doses. Previous studies with ad libitum-fed animals reported much lower glucose uptake with submaximally effective insulin doses in Akt2-null mice than wild-type controls (16, 39). These results support a key role for Akt2 in insulin-mediated glucose uptake under ad libitum-fed conditions. In wild-type mice, McCurdy and Cartee (39) found significantly increased glucose uptake in the extensor digitorum longus (predominantly fast-twitch fibers) and soleus (predominantly slow-twitch fibers) at a physiological insulin dose with CR compared with ad libitum feeding. However, in Akt2-null mice at the same insulin concentration, there was no CR effect on glucose uptake in the extensor digitorum longus. In the soleus, the effect of CR on glucose uptake was much less for Akt2-null than normal mice. Apparently, Akt2 plays a major role in the CR-induced increase in glucose uptake with submaximally effective insulin levels.
Akt2 abundance was significantly increased for CR vs. AL epitrochlearis, but not soleus, muscles. Bae et al. (5) expressed Akt2 in Akt2-knockout cells to achieve levels of expression two- to threefold greater than endogenous Akt2 levels in wild-type control cells. The Akt2 overexpression restored insulin-stimulated cell surface GLUT4 to values similar to, but not greater than, those in the wild-type cells. In a context more directly relevant to our study, we evaluated CR effects on Akt2 abundance and insulin-stimulated glucose uptake in previous studies and uniformly found increased insulin-stimulated glucose uptake with CR, even though we did not find increased Akt2 abundance in the earlier studies (39, 40). Increased Akt2 expression is not necessary for CR-induced elevation of insulin-stimulated glucose uptake by skeletal muscle, and, at least in cultured cells, elevated Akt2 expression is also not sufficient for greater-than-normal GLUT4 translocation.
The ability of CR to enhance Akt2 phosphorylation and glucose uptake with a submaximally effective insulin dose in the epitrochlearis was accompanied by greater AS160 phosphorylation on Thr642 and Ser588. Akt2 is responsible for AS160 phosphorylation (27, 36), and AS160 phosphorylation on Thr642 and Ser588 is important for insulin-stimulated GLUT4 translocation and glucose uptake (45). Therefore, it seems reasonable to suspect that greater Akt2 phosphorylation in CR rats was responsible for greater AS160 phosphorylation in the epitrochlearis with a submaximally effective insulin dose, which was important for enhanced glucose uptake. Consistent with this interpretation, none of the other insulin-signaling events that were measured were significantly amplified by CR in the epitrochlearis at the lower insulin dose.
There was no evidence that CR caused greater AS160 phosphorylation in the soleus, suggesting that if Akt2 was involved in the elevated glucose uptake in the soleus of CR rats, it acted on an AS160 phosphorylation site other than Thr642 and Ser588 or on an Akt2 substrate other than AS160. AS160 has other insulin-responsive Akt phosphorylation sites, but previous research has found these two sites to be most important for regulating GLUT4 and glucose uptake (45). AS160 is the Akt2 substrate that has been most convincingly linked to the regulation of insulin-mediated glucose transport in skeletal muscle, but Akt2 likely has other substrates that influence glucose transport (12, 14). Skeletal muscle expresses TBC1D1, a paralog protein to AS160, and insulin can regulate TBC1D1 phosphorylation by an Akt-dependent mechanism. In the current study, we did not observe a significant effect of diet on PAS-150, which corresponds to phosphorylated TBC1D1 (23), or TBC1D1 protein abundance. Expression of TBC1D1 with mutations blocking insulin-stimulated phosphorylation of key Akt phosphorylation motifs did not alter glucose uptake by mouse skeletal muscle (1), suggesting that insulin-stimulated phosphorylation of TBC1D1 may not be essential for insulin-induced glucose uptake. In 3T3-L1 adipocytes, synip is an Akt substrate that has been reported by some (42, 50), but not by others (44), to modulate insulin-stimulated GLUT4 translocation. Also in 3T3-L1 adipocytes, myosin 5a has been reported to become phosphorylated by Akt2 in response to insulin stimulation and to regulate insulin-mediated GLUT4 translocation (51). However, the roles of synip and myosin 5a in glucose transport of skeletal muscle have not been reported, and the effects of CR on synip or myosin 5a are unknown.
Insulin-stimulated glucose uptake was reduced in the skeletal muscle of mice with muscle-specific homozygous or heterozygous knockout of aPKCλ compared with normal mice (22). Furthermore, insulin's activation of aPKC is attenuated in the skeletal muscle of a number of insulin-resistant conditions in various species (20, 21). At a supraphysiological insulin concentration, aPKC activity was greater in epitrochlearis and soleus muscles from CR than AL rats. Akt2 phosphorylation was also increased by CR at the higher insulin dose, and it is uncertain if the CR effects on aPKC and/or Akt2 contributed to the enhanced glucose uptake with 30 nM insulin. However, in muscles stimulated by a supraphysiological insulin dose, Akt2-null and wild-type mice attained equal values for glucose uptake (16), indicating that, at high insulin levels, Akt2-independent mechanisms are sufficient for normal insulin-stimulated glucose uptake in AL animals.
Most (6, 7, 15), but not all (48), of the published studies that have evaluated CR effects on muscle insulin receptor function at submaximally effective insulin levels have not found diet-induced differences. At supraphysiological insulin concentrations, approximately equal numbers of publications include data supporting (3, 19, 48, 52, 53) and not supporting (3, 4, 6, 7, 15) CR-associated improvements in receptor function. We found a significant diet effect on IR tyrosine phosphorylation at the supraphysiological, but not at the lower, insulin dose. Earlier studies did not find significant elevations in insulin-stimulated IRS1-PI3K activity of rat muscle with CR (17–19) or IRS2-PI3K activity (17), consistent with the current study. In pursuit of the mechanism for the effect of CR on Akt, we evaluated the abundance of HSP90, Appl1, and PP2A, as well as the association of each protein to Akt. CR did not alter the abundance of any of these proteins, but CR induced an increase in association of HSP90 to Akt in the epitrochlearis. Greater HSP90 binding to Akt has been reported to increase Akt phosphorylation, and there is evidence that HSP90 binding to Akt opposes PP2A-mediated dephosphorylation (46). The effect of CR on Akt binding to HSP90 may contribute to the robust effect of CR on Akt phosphorylation in the epitrochlearis.
Akt is phosphorylated on Thr308 by 3-phosphoinositide-dependent protein kinase-1 (PDK1) and on Ser473 by mammalian target of rapamycin 2 (mTORC2), so it is possible that the effects of CR on both phosphorylation sites were caused by simultaneously enhanced activation of both kinases. A reasonable explanation for simultaneous activation of PDK1 and mTORC2 would be that CR caused greater IRS1-PI3K activity, but IRS1-PI3K activity did not differ between the diet groups. If CR caused enhanced PDK1 activation, another reasonable expectation would be greater activation of other PDK1 substrates, including aPKC. However, in contrast to the large CR effect on Akt Thr308 phosphorylation with 1.2 and 30 nM insulin, aPKC activity was significantly greater for the CR than the AL group only at 30 nM insulin. Regardless, it will be important to assess the possibility of CR effects on PDK1 and mTORC2, as well as on alternative mechanisms, that might lead to greater Akt phosphorylation (e.g., binding to regulatory proteins that make Akt more susceptible to phosphorylation and/or less susceptible to dephosphorylation on Thr308 and Ser473).
Dean et al. (18) found that CR leads to increased cell surface GLUT4 levels in insulin-stimulated skeletal muscle. Most (3, 13, 25, 48, 49), but not all (4, 8), earlier studies have found that CR does not cause increased GLUT4 protein expression in skeletal muscle. In the current study, there was a small, but significant, increase in GLUT4 abundance in the epitrochlearis of CR compared with AL rats (22% based on immunoblot), and soleus GLUT4 protein expression was unaltered by diet. Transgenic mice that overexpress GLUT4 have been reported to have increased insulin-stimulated glucose uptake rates that are roughly proportional to the magnitude of their increased GLUT4 expression (9). The insulin-stimulated glucose uptake above basal (Δinsulin) in the epitrochlearis was increased for the CR vs. the AL group by 110% (with 1.2 nM insulin) and 52% (with 30 nM insulin). The relatively modest increase in GLUT4 abundance in the epitrochlearis would be expected to account for only a portion of the higher insulin-stimulated glucose uptake with CR.
We did not observe any diet-associated changes in AMPK abundance or Thr172 phosphorylation in epitrochlearis or soleus muscle. These observations are consistent with the results of Gonzalez et al. (26), who reported no difference in AMPK activity of gastrocnemius muscle between CR (4 mo duration) and AL mice.
In conclusion, our working hypothesis is that CR elevates the ability of insulin to activate Akt by altering the binding of Akt to proteins (including HSP90 in the epitrochlearis) that favor greater Akt phosphorylation. We further hypothesize that enhanced Akt phosphorylation leads to greater phosphorylation of protein substrates (including AS160 in the epitrochlearis). We propose that greater phosphorylation of Akt substrates, together with Akt-independent mechanisms (possibly including aPKC at higher insulin doses), is likely to be important for the effect of CR on insulin-mediated glucose uptake by epitrochlearis and soleus muscles.
GRANTS
This research was supported by National Institute on Aging Grants AG-010026 and AG-013283.
DISCLOSURES
No conflicts of interest, financial or otherwise, are declared by the authors.
Supplementary Material
ACKNOWLEDGMENTS
We thank Anketse Kassa for technical assistance.
REFERENCES
- 1. An D, Toyoda T, Taylor EB, Yu H, Fujii N, Hirshman MF, Goodyear LJ. TBC1D1 regulates insulin- and contraction-induced glucose transport in mouse skeletal muscle. Diabetes 59: 1358–1365, 2010 [DOI] [PMC free article] [PubMed] [Google Scholar]
- 2. Arciero PJ, Vukovich MD, Holloszy JO, Racette SB, Kohrt WM. Comparison of short-term diet and exercise on insulin action in individuals with abnormal glucose tolerance. J Appl Physiol 86: 1930–1935, 1999 [DOI] [PubMed] [Google Scholar]
- 3. Argentino DP, Dominici FP, Al-Regaiey K, Bonkowski MS, Bartke A, Turyn D. Effects of long-term caloric restriction on early steps of the insulin-signaling system in mouse skeletal muscle. J Gerontol A Biol Sci Med Sci 60: 28–34, 2005 [DOI] [PubMed] [Google Scholar]
- 4. Argentino DP, Dominici FP, Munoz MC, Al-Regaiey K, Bartke A, Turyn D. Effects of long-term caloric restriction on glucose homeostasis and on the first steps of the insulin signaling system in skeletal muscle of normal and Ames dwarf (Prop1df/Prop1df) mice. Exp Gerontol 40: 27–35, 2005 [DOI] [PubMed] [Google Scholar]
- 5. Bae SS, Cho H, Mu J, Birnbaum MJ. Isoform-specific regulation of insulin-dependent glucose uptake by Akt/protein kinase B. J Biol Chem 278: 49530–49536, 2003 [DOI] [PubMed] [Google Scholar]
- 6. Bak JF, Moller N, Schmitz O, Saaek A, Pedersen O. In vivo insulin action and muscle glycogen synthase activity in type 2 (non-insulin-dependent) diabetes mellitus: effects of diet treatment. Diabetologia 35: 777–784, 1992 [DOI] [PubMed] [Google Scholar]
- 7. Balage M, Grizard J, Manin M. Effect of calorie restriction on skeletal muscle and liver insulin binding in growing rat. Horm Metab Res 22: 207–214, 1990 [DOI] [PubMed] [Google Scholar]
- 8. Barger JL, Kayo T, Vann JM, Arias EB, Wang J, Hacker TA, Wang Y, Raederstorff D, Morrow JD, Leeuwenburgh C, Allison DB, Saupe KW, Cartee GD, Weindruch R, Prolla TA. A low dose of dietary resveratrol partially mimics caloric restriction and retards aging parameters in mice. PLoS One 3: e2264, 2008 [DOI] [PMC free article] [PubMed] [Google Scholar]
- 9. Brozinick JT, Jr, McCoid SC, Reynolds TH, Wilson CM, Stevenson RW, Cushman SW, Gibbs EM. Regulation of cell surface GLUT4 in skeletal muscle of transgenic mice. Biochem J 321: 75–81, 1997 [DOI] [PMC free article] [PubMed] [Google Scholar]
- 10. Cartee GD. Exercise and calorie restriction use different mechanisms to improve insulin sensitivity. In: Physical Activity and Type 2 Diabetes, edited by Hawley JA, Zierath JR. Champaign, IL: Human Kinetics, 2008, p. 119–134 [Google Scholar]
- 11. Cartee GD, Bohn EE. Growth hormone reduces glucose transport but not GLUT-1 or GLUT-4 in adult and old rats. Am J Physiol Endocrinol Metab 268: E902–E909, 1995 [DOI] [PubMed] [Google Scholar]
- 12. Cartee GD, Funai K. Exercise and insulin: convergence or divergence at AS160 and TBC1D1? Exerc Sport Sci Rev 37: 188–195, 2009 [DOI] [PMC free article] [PubMed] [Google Scholar]
- 13. Cartee GD, Kietzke EW, Briggs-Tung C. Adaptation of muscle glucose transport with caloric restriction in adult, middle-aged, and old rats. Am J Physiol Regul Integr Comp Physiol 266: R1443–R1447, 1994 [DOI] [PubMed] [Google Scholar]
- 14. Cartee GD, Wojtaszewski JF. Role of Akt substrate of 160 kDa in insulin-stimulated and contraction-stimulated glucose transport. Appl Physiol Nutr Metab 32: 557–566, 2007 [DOI] [PubMed] [Google Scholar]
- 15. Cecchin F, Ittoop O, Sinha MK, Caro JF. Insulin resistance in uremia: insulin receptor kinase activity in liver and muscle from chronic uremic rats. Am J Physiol Endocrinol Metab 254: E394–E401, 1988 [DOI] [PubMed] [Google Scholar]
- 16. Cho H, Mu J, Kim JK, Thorvaldsen JL, Chu Q, Crenshaw EB, 3rd, Kaestner KH, Bartolomei MS, Shulman GI, Birnbaum MJ. Insulin resistance and a diabetes mellitus-like syndrome in mice lacking the protein kinase Akt2 (PKBβ). Science 292: 1728–1731, 2001 [DOI] [PubMed] [Google Scholar]
- 17. Davidson RT, Arias EB, Cartee GD. Calorie restriction increases muscle insulin action but not IRS-1-, IRS-2-, or phosphotyrosine-PI 3-kinase. Am J Physiol Endocrinol Metab 282: E270–E276, 2002 [DOI] [PubMed] [Google Scholar]
- 18. Dean DJ, Brozinick JT, Jr, Cushman SW, Cartee GD. Calorie restriction increases cell surface GLUT-4 in insulin-stimulated skeletal muscle. Am J Physiol Endocrinol Metab 275: E957–E964, 1998 [DOI] [PubMed] [Google Scholar]
- 19. Dean DJ, Cartee GD. Calorie restriction increases insulin-stimulated tyrosine phosphorylation of insulin receptor and insulin receptor substrate-1 in rat skeletal muscle. Acta Physiol Scand 169: 133–139, 2000 [DOI] [PubMed] [Google Scholar]
- 20. Farese RV. Function and dysfunction of aPKC isoforms for glucose transport in insulin-sensitive and insulin-resistant states. Am J Physiol Endocrinol Metab 283: E1–E11, 2002 [DOI] [PubMed] [Google Scholar]
- 21. Farese RV, Sajan MP, Standaert ML. Atypical protein kinase C in insulin action and insulin resistance. Biochem Soc Trans 33: 350–353, 2005 [DOI] [PubMed] [Google Scholar]
- 22. Farese RV, Sajan MP, Yang H, Li P, Mastorides S, Gower WR, Jr, Nimal S, Choi CS, Kim S, Shulman GI, Kahn CR, Braun U, Leitges M. Muscle-specific knockout of PKC-λ impairs glucose transport and induces metabolic and diabetic syndromes. J Clin Invest 117: 2289–2301, 2007 [DOI] [PMC free article] [PubMed] [Google Scholar]
- 23. Funai K, Cartee GD. Contraction-stimulated glucose transport in rat skeletal muscle is sustained despite reversal of increased PAS-phosphorylation of AS160 and TBC1D1. J Appl Physiol 105: 1788–1795, 2008 [DOI] [PMC free article] [PubMed] [Google Scholar]
- 24. Gazdag AC, Dumke CL, Kahn CR, Cartee GD. Calorie restriction increases insulin-stimulated glucose transport in skeletal muscle from IRS-1 knockout mice. Diabetes 48: 1930–1936, 1999 [DOI] [PubMed] [Google Scholar]
- 25. Gazdag AC, Sullivan S, Kemnitz JW, Cartee GD. Effect of long-term caloric restriction on GLUT4, phosphatidylinositol-3 kinase p85 subunit, and insulin receptor substrate-1 protein levels in rhesus monkey skeletal muscle. J Gerontol A Biol Sci Med Sci 55: B44–B48, 2000 [DOI] [PubMed] [Google Scholar]
- 26. Gonzalez AA, Kumar R, Mulligan JD, Davis AJ, Weindruch R, Saupe KW. Metabolic adaptations to fasting and chronic caloric restriction in heart, muscle, and liver do not include changes in AMPK activity. Am J Physiol Endocrinol Metab 287: E1032–E1037, 2004 [DOI] [PubMed] [Google Scholar]
- 27. Gonzalez E, McGraw TE. Insulin-modulated Akt subcellular localization determines Akt isoform-specific signaling. Proc Natl Acad Sci USA 106: 7004–7009, 2009 [DOI] [PMC free article] [PubMed] [Google Scholar]
- 28. Gonzalez E, McGraw TE. Insulin signaling diverges into Akt-dependent and -independent signals to regulate the recruitment/docking and the fusion of GLUT4 vesicles to the plasma membrane. Mol Biol Cell 17: 4484–4493, 2006 [DOI] [PMC free article] [PubMed] [Google Scholar]
- 29. Gupta G, She L, Ma XH, Yang XM, Hu M, Cases JA, Vuguin P, Rossetti L, Barzilai N. Aging does not contribute to the decline in insulin action on storage of muscle glycogen in rats. Am J Physiol Regul Integr Comp Physiol 278: R111–R117, 2000 [DOI] [PubMed] [Google Scholar]
- 30. Hansen PA, Gulve EA, Holloszy JO. Suitability of 2-deoxyglucose for in vitro measurement of glucose transport activity in skeletal muscle. J Appl Physiol 76: 979–985, 1994 [DOI] [PubMed] [Google Scholar]
- 31. Jiang ZY, Zhou QL, Coleman KA, Chouinard M, Boese Q, Czech MP. Insulin signaling through Akt/protein kinase B analyzed by small interfering RNA-mediated gene silencing. Proc Natl Acad Sci USA 100: 7569–7574, 2003 [DOI] [PMC free article] [PubMed] [Google Scholar]
- 32. Kane S, Sano H, Liu SC, Asara JM, Lane WS, Garner CC, Lienhard GE. A method to identify serine kinase substrates. Akt phosphorylates a novel adipocyte protein with a Rab GTPase-activating protein (GAP) domain. J Biol Chem 277: 22115–22118, 2002 [DOI] [PubMed] [Google Scholar]
- 33. Katome T, Obata T, Matsushima R, Masuyama N, Cantley LC, Gotoh Y, Kishi K, Shiota H, Ebina Y. Use of RNA interference-mediated gene silencing and adenoviral overexpression to elucidate the roles of AKT/protein kinase B isoforms in insulin actions. J Biol Chem 278: 28312–28323, 2003 [DOI] [PubMed] [Google Scholar]
- 34. Kemnitz JW, Roecker EB, Weindruch R, Elson DF, Baum ST, Bergman RN. Dietary restriction increases insulin sensitivity and lowers blood glucose in rhesus monkeys. Am J Physiol Endocrinol Metab 266: E540–E547, 1994 [DOI] [PubMed] [Google Scholar]
- 35. Kohn AD, Summers SA, Birnbaum MJ, Roth RA. Expression of a constitutively active Akt Ser/Thr kinase in 3T3-L1 adipocytes stimulates glucose uptake and glucose transporter 4 translocation. J Biol Chem 271: 31372–31378, 1996 [DOI] [PubMed] [Google Scholar]
- 36. Kramer HF, Witczak CA, Fujii N, Jessen N, Taylor EB, Arnolds DE, Sakamoto K, Hirshman MF, Goodyear LJ. Distinct signals regulate AS160 phosphorylation in response to insulin, AICAR, and contraction in mouse skeletal muscle. Diabetes 55: 2067–2076, 2006 [DOI] [PubMed] [Google Scholar]
- 37. Lawler DF, Larson BT, Ballam JM, Smith GK, Biery DN, Evans RH, Greeley EH, Segre M, Stowe HD, Kealy RD. Diet restriction and ageing in the dog: major observations over two decades. Br J Nutr 99: 793–805, 2008 [DOI] [PubMed] [Google Scholar]
- 38. Liu X, Liu M, Zhang J, Bai X, Ramos F, Van Remmen H, Richardson A, Liu FY, Dong LQ, Liu F. Downregulation of Grb2 contributes to the insulin-sensitizing effect of calorie restriction. Am J Physiol Endocrinol Metab 296: E1067–E1075, 2009 [DOI] [PMC free article] [PubMed] [Google Scholar]
- 39. McCurdy CE, Cartee GD. Akt2 is essential for the full effect of calorie restriction on insulin-stimulated glucose uptake in skeletal muscle. Diabetes 54: 1349–1356, 2005 [DOI] [PubMed] [Google Scholar]
- 40. McCurdy CE, Davidson RT, Cartee GD. Brief calorie restriction increases Akt2 phosphorylation in insulin-stimulated rat skeletal muscle. Am J Physiol Endocrinol Metab 285: E693–E700, 2003 [DOI] [PMC free article] [PubMed] [Google Scholar]
- 41. McCurdy CE, Davidson RT, Cartee GD. Calorie restriction increases the ratio of phosphatidylinositol 3-kinase catalytic to regulatory subunits in rat skeletal muscle. Am J Physiol Endocrinol Metab 288: E996–E1001, 2005 [DOI] [PubMed] [Google Scholar]
- 42. Min J, Okada S, Kanzaki M, Elmendorf JS, Coker KJ, Ceresa BP, Syu LJ, Noda Y, Saltiel AR, Pessin JE. Synip: a novel insulin-regulated syntaxin 4-binding protein mediating GLUT4 translocation in adipocytes. Mol Cell 3: 751–760, 1999 [DOI] [PubMed] [Google Scholar]
- 43. Saito T, Jones CC, Huang S, Czech MP, Pilch PF. The interaction of Akt with APPL1 is required for insulin-stimulated Glut4 translocation. J Biol Chem 282: 32280–32287, 2007 [DOI] [PubMed] [Google Scholar]
- 44. Sano H, Kane S, Sano E, Lienhard GE. Synip phosphorylation does not regulate insulin-stimulated GLUT4 translocation. Biochem Biophys Res Commun 332: 880–884, 2005 [DOI] [PubMed] [Google Scholar]
- 45. Sano H, Kane S, Sano E, Miinea CP, Asara JM, Lane WS, Garner CW, Lienhard GE. Insulin-stimulated phosphorylation of a Rab GTPase-activating protein regulates GLUT4 translocation. J Biol Chem 278: 14599–14602, 2003 [DOI] [PubMed] [Google Scholar]
- 46. Sato S, Fujita N, Tsuruo T. Modulation of Akt kinase activity by binding to Hsp90. Proc Natl Acad Sci USA 97: 10832–10837, 2000 [DOI] [PMC free article] [PubMed] [Google Scholar]
- 47. Sharma N, Arias EB, Sajan MP, MacKrell JG, Bhat AD, Farese RV, Cartee GD. Insulin resistance for glucose uptake and Akt2 phosphorylation in the soleus, but not epitrochlearis, muscles of old vs. adult rats. J Appl Physiol 108: 1631–1640, 2010 [DOI] [PMC free article] [PubMed] [Google Scholar]
- 48. Wang ZQ, Bell-Farrow AD, Sonntag W, Cefalu WT. Effect of age and caloric restriction on insulin receptor binding and glucose transporter levels in aging rats. Exp Gerontol 32: 671–684, 1997 [DOI] [PubMed] [Google Scholar]
- 49. Wilkes JJ, Nagy LE. Chronic ethanol feeding impairs glucose tolerance but does not produce skeletal muscle insulin resistance in rat epitrochlearis muscle. Alcohol Clin Exp Res 20: 1016–1022, 1996 [DOI] [PubMed] [Google Scholar]
- 50. Yamada E, Okada S, Saito T, Ohshima K, Sato M, Tsuchiya T, Uehara Y, Shimizu H, Mori M. Akt2 phosphorylates Synip to regulate docking and fusion of GLUT4-containing vesicles. J Cell Biol 168: 921–928, 2005 [DOI] [PMC free article] [PubMed] [Google Scholar]
- 51. Yoshizaki T, Imamura T, Babendure JL, Lu JC, Sonoda N, Olefsky JM. Myosin 5a is an insulin-stimulated Akt2 (protein kinase Bβ) substrate modulating GLUT4 vesicle translocation. Mol Cell Biol 27: 5172–5183, 2007 [DOI] [PMC free article] [PubMed] [Google Scholar]
- 52. Zhu M, de Cabo R, Anson RM, Ingram DK, Lane MA. Caloric restriction modulates insulin receptor signaling in liver and skeletal muscle of rat. Nutrition 21: 378–388, 2005 [DOI] [PubMed] [Google Scholar]
- 53. Zhu M, Miura J, Lu LX, Bernier M, DeCabo R, Lane MA, Roth GS, Ingram DK. Circulating adiponectin levels increase in rats on caloric restriction: the potential for insulin sensitization. Exp Gerontol 39: 1049–1059, 2004 [DOI] [PubMed] [Google Scholar]
Associated Data
This section collects any data citations, data availability statements, or supplementary materials included in this article.


