

Abstract
Various chemopreventive compounds alter gene expression, possibly explaining their biological activity. One gene induced by a variety of chemopreventive compounds is the one coding for the transcription factor activating transcription factor 3 (ATF3). In this study, we performed microarray analysis on mRNA isolated from human colorectal cancer cells overexpressing ATF3 to ascertain the biological activity of this gene in cancer. As a result, 64 genes were induced or repressed. One gene identified by microarray analysis as repressed by overexpression of ATF3 was inhibitor of DNA binding/differentiation-1 (Id1). Id1 is important to cell growth and proliferation and therefore may represent an important downstream target of ATF3 responsible for the biological activity of ATF3. Id1 interacts with ATF3, thereby sequestering its activity, making it an ideal candidate for further study. The induction of ATF3 and repression of Id1 in these cells were confirmed at the mRNA and protein levels by semiquantitative real-time reverse transcription–polymerase chain reaction and western blot analysis, respectively. To determine if the repression of Id1 seen following microarray analysis of these cells occurred following treatment with dietary compounds with known chemotherapeutic activity, human colorectal cancer cells were treated with resveratrol and genistein, and their expression was determined. As a result, ATF3 was induced, and Id1 was repressed, by these compounds and by sulindac sulfide, a positive control, at the mRNA and protein level. Further work is needed to determine the molecular mechanism(s) responsible for the regulation of Id1 and to determine if biological activity of ATF3 overexpression is mediated by repression of Id1 by these compounds.
KEY WORDS: activating transcription factor 3, colorectal cancer, genistein, inhibitor of DNA binding/differentiation-1, microarray, polyphenolics, resveratrol
Introduction
In the United States, colorectal cancer is the third leading cause of cancer with an estimated 142,000 new cases and 51,000 deaths in 2010.1 Diet plays a significant role in the etiology of various diseases, including cancer,2 and recently focus has been placed on the impact of diet on cancer.3 Increasing evidence suggests a decreased risk of colorectal cancer from the consumption of naturally occurring dietary polyphenolic compounds such as resveratrol (an antioxidant and anti-inflammatory with chemopreventive activity found in red grapes and wine)4 and genistein (an isoflavone phytoestrogen, tyrosine kinase inhibitor, and antioxidant with chemopreventive activity found in soybeans, pea pods, and other legumes).5 However, the precise chemopreventive mechanisms of these compounds are unknown. These compounds are well known for their antioxidant and enzyme inhibitory effects; however, another explanation for the chemopreventive effects of these compounds is the alteration of gene expression by these compounds independent of their primary mechanisms of action. For example, dietary compounds alter global patterns of gene expression, including genes related to cancer, which may explain their anticancer activity.
Microarray analysis of PC-3 prostate cancer cells treated with genistein6 revealed changes in the expression of various genes. The gene for activating transcription factor 3 (ATF3) is one gene reportedly with an emerging role in cancer (for a review, see Thompson et al.7). We previously reported that dietary compounds such as genistein altered the expression of ATF3 in colorectal cancer cells,8 whereas others have reported the induction of ATF3 by the dietary compounds genistein9 and indole-3-carbinol and its dimer 3,3′-diindolylmethane (an isoflavone with multiple mechanisms of action).10 Previously, we used microarray analysis of colorectal cancer cells treated with sulindac sulfide to identify several candidate genes potentially involved in the chemopreventive activity of cyclooxygenase (COX) inhibitors independent of their ability to inhibit COX.11
One gene, ATF3, was further studied because its product is a transcription factor and it is an immediate-early gene involved in cell growth, apoptosis, and invasion. ATF3 is a member of the ATF/cyclic AMP-responsive element binding protein family of transcription factors and is linked to the carcinogenic process.12 As a transcription factor ATF3 modulates the expression of genes linked to cancer, including gadd153/Chop1013, matrix metalloproteinase-2,14–16 and the antitumor gene p53.16 The transcription factor ATF3 has anti-invasive activity when overexpressed in colorectal cancer cells as determined with various in vitro biological assays and antitumorigenic activity in vivo in a nude mouse tumor xenograft model.8 ATF3 was first identified as regulated by nonsteroidal anti-inflammatory drugs (NSAIDs) according to microarray analysis in our laboratory.11 ATF3 is induced by NSAIDs and other compounds with chemopreventive activity and is repressed in tumors relative to normal adjacent tissues. ATF3 is up-regulated by various chemopreventive compounds, suggesting that the induction of protein from this gene may be beneficial. ATF3 is regulated by traditional and selective COX inhibitors11,17 and has antitumorigenic activity in mouse tumor xenograft models in vivo and anti-invasive activity in colorectal cancer cells in vitro.8 In addition to COX inhibitors, various dietary compounds such as resveratrol and genistein possess chemopreventive and gene regulatory activity and are reported to induce ATF3.
In this report, we performed microarray analysis on human colorectal cancer cells overexpressing ATF3 to look for potential downstream gene targets of ATF3 related to cancer. The overexpression of ATF3 has been shown to regulate the expression of genes related to invasion.8 We chose to focus on the repression of one gene, inhibitor of DNA binding/differentiation-1 (Id1), because, like ATF3, it is involved in cell growth and invasion, and thus it has a similar biological function as ATF3. Id1 belongs to the inhibitor of differentiation family of genes, whose protein products have been shown to play a role in cell growth, differentiation, proliferation, invasion, and angiogenesis, in part, by their ability to associate with and inhibit the function of various transcription factors involved in cell fate determination, differentiation, and angiogenesis.18 Furthermore, Id1 is regulated by some of the same chemotherapeutic agents as ATF3, and reports indicate ATF3 and Id1 expression might be co-regulated. Apigenin, a common dietary flavonoid with antitumor properties, inhibits Id1 expression through the expression of ATF3, thereby reducing cell growth and proliferation in ovarian cancer cells,19 and ATF3 regulates the expression of Id1 based on Id1 promoter mutagenesis experiments.20 This is the first report to show that Id1 is repressed by ATF3 overexpression and following treatment with the dietary compounds resveratrol and genistein, adding to the potential value of the genes for these proteins as therapeutic targets in cancer while adding to the repertoire of the use of dietary compounds in the prevention of cancer.
Materials and Methods
Cell lines, reagents, and treatment conditions
Human colorectal cancer cells were purchased from the American Type Culture Collection (Manassas, VA, USA) and were maintained at 37°C in an atmosphere of 5% CO2. Cell culture reagents were from Life Technologies (Rockville, MD, USA) unless otherwise indicated. Human colorectal cancer HCT-116 cells were maintained in McCoy's 5A medium, supplemented with 10% fetal bovine serum and 10 mg/L gentamicin (complete medium). Sulindac sulfide, resveratrol, and genistein were from Sigma Chemical Co. (St. Louis, MO, USA). Chemicals were dissolved in dimethyl sulfoxide and prepared fresh weekly. Cells were grown overnight to 60–70% confluency in complete medium and treated in serum-free medium for 24 hours unless otherwise indicated. Vehicle consisted of 0.1% dimethyl sulfoxide after dissolving in medium at a ratio of 1:1,000.
RNA isolation
Following treatments, tissue culture cells were rinsed twice with sterile phosphate-buffered saline for isolation of RNA. Total RNA was isolated using the Qiagen (Valencia, CA, USA) RNeasy MINI kit according to the manufacturer's instructions. Quantitation of the RNA was performed using a small aliquot of RNA dissolved in 10 mM Tris (pH 8.0) using a Beckman DU7400 spectrophotometer (Beckman Coulter, Fullerton, CA, USA). RNA was stored in an ultralow temperature freezer (Thermo Fisher Scientific, Waltham, MA, USA) at −80°C until use. For microarray analysis, quality of the RNA was evaluated using the Agilent Technologies (Palo Alto, CA, USA) Bioanalyzer according to the manufacturer's instructions. RNA was quantitated immediately before use with a NanoDrop Technologies (Wilmington, DE, USA) ND-1000 spectrophotometer.
Microarray analysis
Microarray experiments were performed by the National Institute of Environmental Health Sciences microarray group of the National Center for Toxicogenomics (Research Triangle Park, NC, USA). Gene expression profiling was conducted using the Agilent Technologies (Santa Clara, CA, USA) Human 1Av2 chip, which contains ∼20,000 genes. Microarray experiments were performed using 50 μM concentrations of the compounds indicated and were performed twice for each compound tested (or overexpressing cells) using a fluor reversal relative to time-matched vehicle-treated (or vector-transfected) cells. Five hundred nanograms of total RNA was amplified and labeled using the Agilent Technologies Low RNA Input Fluorescent Linear Amplification Kit, according to the manufacturer's protocol. For each two-color comparison, Cy3- and Cy5-labeled cRNAs (750 ng of each) were mixed and fragmented using the Agilent In Situ Hybridization Kit protocol using a fluor reversal. Hybridizations were performed for 17 hours in a rotating hybridization oven according to the Agilent 60-mer oligo microarray processing protocol prior to washing and scanning with an Agilent Technologies scanner. Data were obtained using the Agilent Feature Extraction software (version 7.5), using defaults for all parameters. The Feature Extraction Software performs error modeling before data are loaded into the Resolver system. Images and GEML files, including error and P values, were exported from the Agilent Feature Extraction software and deposited into Rosetta Resolver (version 5.0) (Rosetta Biosoftware, Kirkland, WA, USA) as indicated below.
Data analysis
The Rosetta Resolver system performs a squeeze operation that creates ratio profiles by combining replicates while applying error weighting. The error weighting consists of adjusting for additive and multiplicative noise. The resultant ratio profiles (two for each comparison, using a fluor reversal) were combined into ratio experiments as described by Dai et al.21 A P value, representing the probability that a gene is differentially expressed, is generated and propagated throughout the system. The Rosetta Resolver system allows users to set thresholds below which genes of a P value are considered to be significantly expressed. In this study, the threshold was set to P<.001 with directionality being maintained. Because of the large number of genes that resulted, a second cutoff was arbitrarily set at 1.3-fold.
Hierarchical cluster analysis
Hierarchical clustering was used to group genes with similar patterns of expression. The dendogram reflects the relatedness between groups of genes or samples based on gene expression profiles. Clustered genes are often mechanistically related, and samples with similar clustering are often biologically related. Hierarchical cluster analysis on significantly regulated genes was performed using the Rosetta Resolver system to systematically determine what genes were concomitantly regulated by ATF3 overexpression.
ATF3 overexpression
A construct containing the entire full-length coding region of the ATF3 gene, including the TATAA region, which is required for translation of the mRNAs, was generated by reverse transcription (RT)–polymerase chain reaction (PCR) using RNA from HCT-116 cells with the following primers as previously described:8 forward, 5′-CGTGAGTCCTCGGTGCTC-3′; reverse, 5′-GACAGCTCTCCAATGGCTTC-3′. In brief, the resulting 721-bp cDNA was cloned into pCRII-Topo® (Invitrogen, Carlsbad, CA, USA) followed by excision at the HindIII/NotI sites and transferred into the expression plasmid pcDNA3.1Zeo+/− (Invitrogen) using T4 DNA ligase (New England Biolabs, Beverly, MA, USA) and then confirmed by DNA sequencing as previously described.8 Transfection experiments were carried out using Lipofectamine™ Plus™ reagent (Invitrogen) according to the manufacturer's instructions. Following transfection of these constructs into HCT-116 cells, the expression of full-length ATF3 protein was evaluated at the protein level by western blot analysis and at the mRNA level by semiquantitative real-time RT-PCR. Stable pools of HCT-116 cells expressing full-length ATF3 sense or vector (pcDNA3.1Zeo)-expressing cells were isolated following 3 weeks of culture in the presence of zeocin, and expression of ATF3 was routinely detected by western blot and semiquantitative real-time RT-PCR.
Western blot analysis
Protein was isolated in 1× radioimmunoprecipitation assay buffer including one Complete-Mini® protease inhibitor tablet from Roche Diagnostics (Indianapolis, IN, USA). Cell lysates were stored at 4°C for 30 minutes followed by centrifugation at 12,000 g at 4°C for 20 minutes to remove cellular debris. Quantitation of protein was performed by BCA assay (Pierce, Rockford, IL, USA). Blots were blocked for 1 hour with 10% skim milk in Tris-buffered saline containing 0.1% Tween-20 (TBS-T) and then probed overnight at 4°C in TBS-T with 5% milk containing primary antibodies for Id1, ATF3, p53, or actin (Santa Cruz Biotechnology, Santa Cruz, CA, USA). Blots were washed in TBS-T, incubated with the appropriate horseradish peroxidase–conjugated secondary antibody (Amersham Biosciences, Piscataway, NJ, USA) for 1 hour at room temperature in TBS-T containing 5% milk, and washed several times in TBS-T. Where necessary, blots were stripped of antibody before reuse while sealed in a plastic bag containing a solution of 62.5 mM Tris-HCl, 2% sodium dodecyl sulfate, and 100 mM β-mercaptoethanol for 30 minutes with constant agitation in a 50°C water bath.
Densitometry measurements
Autoradiograms from blots were scanned using an Umax® Powerlook III® scanner (Techville, Inc., Dallas, TX, USA) equipped with a transparency adapter and scanning software on a PC. Subsequently, blots were quantitated using Scion Image® beta version 4.0.2 (Scion Corp., Frederick, MD, USA), cut to size for publication, and labeled using Adobe® Photoshop® version 5.0 (San Jose, CA, USA). Values shown are adjusted for actin content. Quantitation was performed using Scion Image for Windows release 4.0.3.2. For time course analyses, values are adjusted for actin content and expressed relative to Hour 1. For dose curve analyses, values are adjusted for actin values and expressed relative to vehicle.
Semiquantitative real-time RT-PCR using SYBR Green detection
For semiquantitative real-time RT-PCR analyses, RNA was treated with 1 unit of amplification-grade DNase I (Life Technologies)/μg of RNA at room temperature for 15 minutes to remove genomic DNA. RT was performed using Qiagen's Omniscript RT kit according to the manufacturer's instructions. A negative control containing all of the RT reagents in the absence of RT enzyme (no RT control) was routinely performed. After RT, cDNA was treated with 1 unit of RNase H (Life Technologies)/μg of RNA at 37°C for 20 minutes. Semiquantitative real-time RT-PCR was performed in triplicate two or more times with individual time-matched vehicle-treated controls for each gene tested or relative to vector-expressing cells for overexpression assays. Values are adjusted for actin content. Semiquantitative real-time RT-PCR primer design, DNase treatment, RT, and semiquantitative real-time RT-PCR assays using an ABI Prism 7700 (Applied Biosystems, Foster City, CA, USA) were performed as previously described by this laboratory.11 The following human-specific primers were used: ATF3 forward, AAGAACGAGAAGCAGCATTTGAT; reverse, TTCTGAGCCCGGACAATACAC (71 bp); actin forward, CCTGGCACCCAGCACAAT; reverse, GCCGATCCACACGGAGTACT (70 bp); and Id1 forward, CTACGACATGAACGGCTGTTACTC; Id1 reverse, CTTGCTCACCTTGCGGTTCT (76 bp).
Cell proliferation assay
Cell proliferation was measured using the 3-(4,5-dimethylthiazol-2-yl)-5-(3-carboxymethoxyphenyl)-2-(4-sulfophenyl)-2H-tetrazolium, inner salt (MTS) colorimetric assay from Promega (Madison, WI, USA). In brief, 2,000 cells per well were plated in complete medium in 96-well tissue culture dishes overnight. Cells were treated with various concentrations of vehicle or the compound indicated in complete medium in a final volume of 0.1 mL. Cells were grown in complete medium containing serum to reduce the toxic effects of serum-free medium over a 48-hour incubation, which has produced the best results routinely in our laboratory. Cell viability was measured at the times indicated at 490 nm in an enzyme-linked immunosorbent assay plate reader following addition of 0.02 mL of MTS AQueous One solution per well and a 1-hour incubation at 37°C in a 5% CO2 atmosphere. Each experiment was carried out in quadruplicate and repeated two times. Percentage viability is calculated relative to vehicle-treated controls using the mean±SEM optical density at 490 nm.
Statistical analyses
Values for RT-PCR mRNA analyses are expressed relative to time-matched, vehicle-treated cells and were performed in triplicate and repeated two or more times. Statistical analyses are on raw cycle threshold (Ct) values adjusted for actin (n=3 replicates) relative to vehicle-treated cells. For cell proliferation, multiple comparisons were performed using analysis of variance with Bonferroni's correction to adjust for multiple comparisons each at the P<.05 level of significance relative to vehicle-treated cells. For semiquantitative real-time RT-PCR, a t test was performed on individually treated, time-matched, vehicle-treated cells with Ct values adjusted for actin content.
Results
Microarray analysis
To characterize the downstream gene regulatory role of ATF3, we used microarray analysis with the Agilent Human 1Av2 chip to look for similarities in gene expression patterns by ATF3-overexpressing human colorectal cancer HCT-116 cells. We overexpressed full-length ATF3 protein in HCT-116 colorectal cancer cells. Based on the microarray analysis, 64 genes were regulated by ATF3 overexpression (Table 1): 36 were induced, and 28 were repressed. Based on the microarray analysis, several genes were identified as regulated by ATF3 overexpression in this cell line. Several genes related to cancer were regulated by ATF3 overexpression. For example, the early growth response-1 gene was induced by ATF3 overexpression in this study and as previously reported by this laboratory, and both ATF3 and early growth response-1 are regulated by sulindac sulfide.22 Another gene important in the carcinogenic process is Id1. Id1 was identified as repressed by ATF3 overexpression in this study using microarray analysis. Id1 was chosen for further study because expression of Id1 protein correlates with ATF3 expression based on the literature, and, like ATF3, Id1 is important to cell growth and proliferation. Therefore, Id1 may represent an important downstream target of ATF3 responsible for the biological activity of ATF3.
Table 1.
Genes Induced or Repressed by Activating Transcription Factor 3 Overexpression ≥1.3-Fold
| Fold change | Accession number | Sequence description |
|---|---|---|
| Induced | ||
| 5.24 | I_965766 | Interleukin 7 |
| 4.82 | I_1109783 | Protein of unknown function |
| 4.32 | I_929795 | Distal less homeo box 6 |
| 3.83 | I_1110273 | Solute carrier family 15 member 2 (peptide transporter 2) |
| 3.76 | I_962482 | Glypican 3 |
| 3.4 | NM_052866.2 | Homo sapiens ADAMTS-like 1, transcript variant 2 |
| 3.00 | I_943946 | ras homolog gene family member I, likely acts as a tumor suppressor |
| 2.05 | I_966374 | FXYD domain containing ion transport regulator 3 |
| 1.73 | I_930859 | H2A histone family member O |
| 1.72 | I_959124 | dapper homolog 1, antagonist of β-catenin (Xenopus) |
| 1.65 | I_1109787 | KIAA0152 |
| 1.58 | I_958100 | Early growth response 1 |
| 1.5 | I_943701 | Inhibitor of DNA binding 2, dominant negative helix-loop-helix protein |
| 1.49 | I_931939 | Ki-67 antigen, nuclear protein expressed only in proliferating cells |
| 1.47 | I_960270 | Nuclear receptor subfamily 2 group F member 2 (transcription factor COUP 2) |
| 1.45 | I_958776 | Keratin-associated protein 3-1 |
| 1.44 | I_1109879 | ralA binding protein 1 |
| 1.44 | I_959784 | Neuromedin B |
| 1.4 | I_962934 | Sulfatase 2 |
| 1.39 | I_929428 | Activating transcription factor 3 |
| 1.38 | I_1109553 | Protein of unknown function |
| 1.37 | I_1000105 | Keratin 18 |
| 1.36 | I_939265 | Laminin β 3, a subunit of the heterotrimeric laminin 5 |
| 1.36 | I_957897 | H1 histone family member 2 |
| 1.36 | I_930757 | Transmembrane protein 2 |
| 1.36 | I_1152495 | TBC1 domain family member 2, differentially expressed in cancer cell lines |
| 1.35 | I_932430 | Nuclear receptor subfamily 4 group A member 1 |
| 1.35 | I_935759 | Potassium channel, subfamily K, member 4 |
| 1.35 | I_957576 | KIBRA protein |
| 1.34 | I_957915 | H2B histone family member H |
| 1.33 | NM_003524.2 | H. sapiens histone 1, H2bh |
| 1.33 | NM_021065.2 | H. sapiens histone 1, H2ad |
| 1.33 | I_958007 | H2B histone family member N |
| 1.32 | I_961094 | Melanoma inhibitory activity, inhibits the growth of melanoma cells |
| 1.32 | I_957153 | Polo-like kinase 2 (Drosophila) |
| 1.30 | I_957913 | H1 histone family member 4 |
| Repressed | ||
| −1.31 | I_960970 | Inhibitor of DNA binding 1 |
| −1.31 | I_943989 | ADP-ribosylation factor-like 10C |
| −1.31 | I_966263 | Factor 8-associated gene A |
| −1.31 | I_930454 | Nuclease-sensitive element binding protein 1 |
| −1.33 | I_928387 | Carbamoyl-phosphate synthetase 1, mitochondrial |
| −1.36 | I_957631 | Sin3-associated protein, 30 kDa |
| −1.36 | I_957794 | Heparan sulfate d-glucosaminyl 3-O-sulfotransferase |
| −1.37 | I_957128 | PHD finger protein 17 |
| −1.39 | I_1221822 | PC4 and SFRS1 interacting protein 1 |
| −1.41 | I_932411 | 3-Phosphoglycerate dehydrogenase |
| −1.43 | NM_138385.1 | H. sapiens hypothetical protein BC009331 (LOC92305) |
| −1.45 | NM_032947.2 | H. sapiens putative small membrane protein NID67 |
| −1.46 | I_1109240 | Protein containing a pleckstrin homology domain |
| −1.46 | I_957588 | G protein-coupled receptor 110 |
| −1.48 | I_931537 | SEC31-like 2 (Saccharomyces cerevisiae) |
| −1.49 | I_1221850 | ATP-binding cassette, subfamily C (CFTR/MRP), member 2 |
| −1.51 | I_930183 | Caspase 5, a member of the ICE (CASP1) subfamily of caspases |
| −1.66 | I_960505 | Fibroblast growth factor 9 |
| −1.79 | I_933013 | CGI-116 protein |
| −1.82 | I_958778 | Keratin 23 (histone deacetylase inducible) |
| −1.93 | I_964840 | Branched-chain acyl-coenzyme A oxidase 2 |
| −1.97 | I_928945 | Group IVa calcium-dependent cytosolic phospholipase A2 |
| −2.01 | I_930568 | Guanine nucleotide binding protein 11 |
| −2.25 | I_930184 | Caspase 4, apoptosis-related cysteine protease |
| −5.12 | NM_138963.1 | H. sapiens ribosomal protein S4, Y-linked 2 |
| −5.99 | I_966095 | Ribosomal protein S4, Y-linked 1 |
| −6.02 | I_930152 | PBX/knotted 1 homeobox 2 |
| −9.00 | I_959186 | 4-Aminobutyrate aminotransferase |
| −10.01 | NM_134470.2 | Interleukin-1 receptor accessory protein |
| −13.02 | NM_174975.2 | SEC14-like 3 (S. cerevisiae) |
Stable pools of HCT-116 cells expressing vector (pcDNA3.1Zeo) or ATF3 in the sense orientation were plated for 24 hours in complete medium followed by RNA isolation. Microarray was performed according to the National Institute of Environmental Health Sciences microarray facility using the Agilent Human 1Av2 chip. Values are relative to vector-expressing cells and are at least P<.001 according to microarray analysis. The two subjects of this article are denoted by bold type.
ATF3-overexpressing cells
The induction of ATF3 and repression of Id1 in ATF3-overexpressing cells were confirmed at the mRNA level using semiquantitative real-time RT-PCR. ATF3-overexpressing cells were plated for 24 hours in complete medium as in the microarray experiment. As a result, ATF3 mRNA expression was induced by 4.9±0.37 (P<.001), whereas Id1 was suppressed by 0.22±0.13 (P<.001). Values are expressed as mean fold relative change (±SEM) and performed in triplicate repeated two or more times. This was repeated in the absence of serum with similar results (data not shown). Probability values are according to a t test relative to time-matched, vehicle-treated cells paired with each treatment performed on Ct values adjusted for actin content. Subsequently, the induction of ATF3 and the repression of Id1 in these ATF3-overexpressing cells were confirmed at the protein level at the same time point as the microarray experiment (Fig. 1).
FIG. 1.
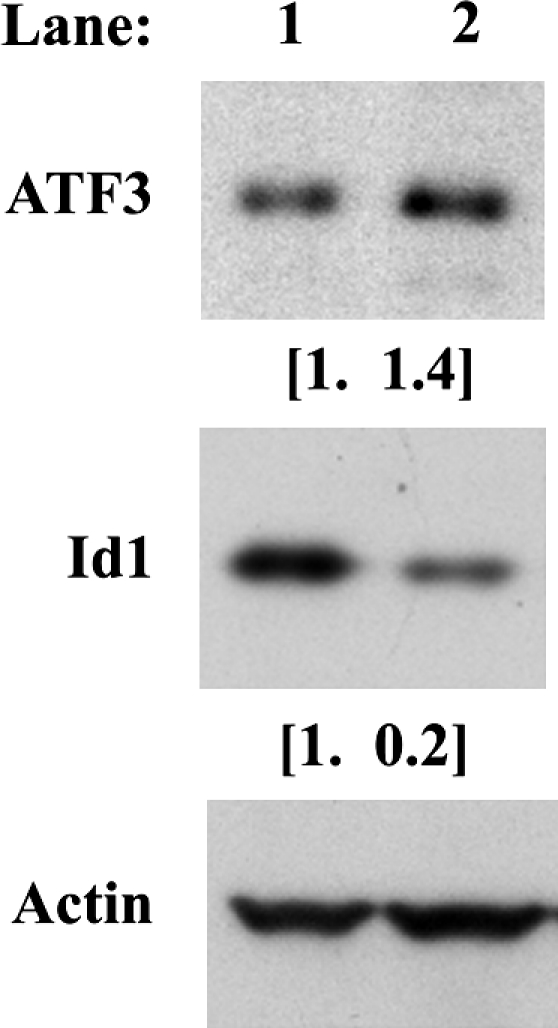
Induction of activating transcription factor 3 (ATF3) and repression of inhibitor of DNA binding 1 (Id1) protein expression were confirmed by western blot analysis of ATF3-overexpressing human colorectal cancer cells relative to vector-transfected cells. Proteins were isolated from vector-transfected (lane 1) or ATF3-overexpressing (lane 2) HCT-116 cells after a 24-hour incubation in complete medium followed by western blot analysis for ATF3, Id1, and actin. Values in parentheses are fold induction or repression adjusted for actin content. The western blot was repeated using protein from the same isolation with similar results.
Dietary compounds regulate the expression of ATF3 and Id1 at the protein and mRNA levels
In an effort to evaluate the regulation of Id1 and ATF3 by various dietary compounds with chemopreventive activity, wild-type HCT-116 colorectal cancer cells were incubated with vehicle, sulindac sulfide, resveratrol, and genistein for 24 hours based on prior studies followed by real-time semiquantitative RT-PCR (Table 2).11 Sulindac sulfide, which is reported to induce ATF3, was used as a positive control because it is well studied, has documented chemopreventive activity in humans and animal models, and illustrates that the concomitant regulation of these genes occurs by a wide variety of compounds.11 It is well established that ATF3 is regulated by sulindac sulfide in various colorectal cancer cell lines.8,17,22 The dietary compounds resveratrol and genistein were chosen based on their reported chemopreventive activity, and each reportedly induces ATF3 in various cell lines.8,23
Table 2.
Fold Change in Activating Transcription Factor 3 and Inhibitor of DNA Binding 1 mRNA Gene Expression in Human Colorectal Cancer Cells According to Semiquantitative Real-Time Reverse Transcription–Polymerase Chain Reaction
| Treatment | ATF3 | Id1 |
|---|---|---|
| Resveratrol | 32.7±4.7*** | 0.63±0.05** |
| Genistein | 4.66±0.15*** | 0.71±0.01** |
| Sulindac sulfide | 11.5±0.44*** | 0.31±0.01*** |
Human colorectal cancer HCT-116 cells were treated in serum-free medium with vehicle, 30 μM sulindac sulfide, or the dietary compounds indicated at 50 μM for 24 hours followed by RNA isolation. Representative data are shown. Values are expressed as mean (±SEM) fold change relative to time-matched, vehicle-treated cells and are adjusted for actin content according to real-time reverse transcription–polymerase chain reaction performed in triplicate and repeated two or more times.
P<.01, ***P<.001 according to a t test relative to time-matched, vehicle-treated cells paired with each treatment performed on Ct values adjusted for actin content (n=3) repeated two or more times.
In an effort to evaluate the regulation of Id1 and ATF3 by various compounds with chemopreventive activity, wild-type HCT-116 colorectal cancer cells were incubated with vehicle or sulindac sulfide to establish the best time point for analysis by western blot. The time course for the induction of ATF3 and the suppression of Id1 using our positive control, sulindac sulfide, is illustrated in Figure 2. A time-dependent increase in ATF3 expression occurred and corresponded with a decrease in Id1 expression. Because of some inconsistencies in vehicle-treated cells at the earlier time points and the fact that the most consistent results were seen at 8 hours and beyond, an 8-hour time point was chosen based on the time course for sulindac sulfide to examine the concentration dependence following treatment with the dietary compounds (Table 3).
FIG. 2.

Evaluation of the time course of ATF3 and Id1 protein regulation. HCT-116 human colorectal cancer cells were treated in serum-free medium with (A) vehicle or (B) 20 μM sulindac sulfide, as indicated, for 1, 2, 3, 4, 5, 6, 8, or 24 hours (lanes 1–8, respectively). This assay was repeated with similar results.
Table 3.
Fold Change in Activating Transcription Factor 3 and Inhibitor of DNA Binding 1 Protein Expression in Human Colorectal Cancer Cells According to Western Blot Analysis
| |
Hours |
|||||||
|---|---|---|---|---|---|---|---|---|
| 1 | 2 | 3 | 4 | 5 | 6 | 8 | 24 | |
| Sulindac sulfide | ||||||||
| ATF3 | 1.0 | 2.2 | 4.1 | 5.6 | 10.5 | 7.3 | 12.6 | 14.9 |
| Id1 | 1.0 | 0.5 | 0.4 | 0.3 | 0.4 | 0.2 | 0.2 | 0.0 |
| Vehicle | ||||||||
| ATF3 | 1.0 | 6.4 | 1.2 | 1.1 | 0.6 | 1.2 | 1.1 | 0.8 |
| Id1 | 1.0 | 5.5 | 2.5 | 2.1 | 2.9 | 3.5 | 2.6 | 2.7 |
In a time-course analysis, HCT-116 human colorectal cancer cells were treated in serum-free medium with vehicle or 20 μM sulindac sulfide as indicated, for 1, 2, 3, 4, 5, 6, 8, or 24 hours as shown in Figure 2 (lanes 1–8).
Subsequently, concentration curves were performed using HCT-116 cells treated for 8 hours in the presence of vehicle or the compounds indicated. Similar to the microarray experiments, induction of ATF3 and repression of Id1 were observed at the protein level in the 25–50 μM range following treatment with these compounds (Fig. 3A). Treatment with sulindac sulfide, even at lower concentrations, resulted in the greatest induction of ATF3 and repression of Id1. These results were quantified, and following adjustment for actin content, relative to vehicle, each of these compounds induced ATF3 and repressed Id1 (Fig. 3B and C).
FIG. 3.

ATF3 and Id1 are concomitantly regulated in a concentration-dependent fashion following treatment with various chemopreventive compounds. (A) Western blot analysis of HCT-116 human colorectal cancer cells treated in serum-free medium with vehicle, 10, 25, 50, or 100 μM resveratrol, genistein, or vehicle, or 10, 20, 30, or 40 μM sulindac sulfide for 8 hours. (B) Quantitation of dose curve for ATF3. Values are adjusted for actin content and expressed relative to vehicle. (C) Quantitation of dose curve for Id1. Values are adjusted for actin content and expressed relative to vehicle.
Inhibition of cell proliferation by dietary compounds
The precise mechanisms for the anticancer effects of these compounds are not fully understood; however, inhibition of cell proliferation, induction of apoptosis, and induction of differentiation are potential pathways. In general, these dietary compounds inhibited cell proliferation by 30–40% or more at 100 μM concentrations (compared with 70% for sulindac sulfide) in serum-containing medium, which is required to prevent cell death due to toxicity at these time points in this cell line (Fig. 4). The presence of serum generally requires higher concentrations than serum-free medium. The dietary compounds used in this study have unique chemical characteristics. Nevertheless, one thing they have in common is their ability to regulate gene expression. The ability of compounds such as COX inhibitors (i.e., sulindac sulfide) and antioxidants (i.e., resveratrol and genistein) to regulate gene expression independent of their established mechanisms of action demonstrates that the regulation of gene expression by these compounds occurs through an alternate pathway as described elsewhere by this laboratory.11 For example, the regulation of ATF3 in human colorectal cancer cell lines by NSAIDs is independent of the ability of these compounds to inhibit COX activity.11 In the case of ATF3, it is likely that its activity as a transcription factor is responsible for the regulation of downstream genes, which might explain, at least in part, the chemopreventive effects of compounds that regulate ATF3. The overexpression of ATF3 alone did not inhibit cell proliferation, indicating that, in addition to ATF3, other factors are likely involved (data not shown). Furthermore, as published elsewhere, the overexpression of ATF3 alone in this cell line did not induce apoptosis.8
FIG. 4.

Cell proliferation in HCT-116 colorectal cancer cells treated with the compounds used in this study. These compounds inhibit cell proliferation of HCT-116 cells following treatment for 48 hours in complete medium. Representative data are shown from 100 μM treatments in medium containing serum, which generally requires higher concentrations than serum-free medium. Each treatment was performed with a matching control and was done in triplicate, two or more times. Data are mean±SEM values. Statistical significance was calcualted by analysis of variance with Bonferroni's correction for multiple comparisons relative to vehicle-treated cells: *P<.05, ***P<.001.
Discussion
In this report, we reveal for the first time that overexpression of ATF3 in colorectal cancer cells modulates various downstream genes as determined by microarray analysis and that the expression of Id1 is suppressed following treatment with resveratrol and genistein. We chose to focus on the concomitant regulation of Id1 because, like ATF3, Id1 is a modulator of cell growth and proliferation in cancer cells, and the repression of Id1 has reported anticancer activity. Furthermore, Id1 is a reported downstream target of ATF3, and it interacts with the promoter of ATF3, indicating the activity of the proteins for these genes is closely regulated.19,24,25 Three ATF3 transcription factor binding sites are present in the Id1 gene. Therefore, Id1 may represent an important downstream target of ATF3 responsible for the biological activity of this gene.25 We chose to estimate the regulation of Id1 by various dietary compounds with reported chemopreventive activity to help elucidate the biological significance of the Id1 gene. Id1 is involved in cell growth, proliferation, angiogenesis, and differentiation, whereas repression of Id1 has reported anticancer activity. Thus, the biological significance of Id1 in the literature, the cluster analysis of our microarray data, and a scan of the Id1 gene promoter sequence led us to pursue the concomitant regulation of ATF3 and Id1.
In this study, we attempted to evaluate the biological significance of the concomitant expression of ATF3 and Id1. We hypothesized that, similar to sulindac sulfide, dietary compounds with cancer chemopreventive activity act, in part, by increasing the expression of, among other genes, that for the transcription factor ATF3, which in turn might regulate the expression of various biologically relevant downstream target genes such as Id1. ATF3 and Id1 were concomitantly regulated following overexpression of ATF3 and following treatment with various dietary compounds and sulindac sulfide as reported herein. Sulindac sulfide induced ATF3 and repressed Id1 at lower concentrations than the dietary compounds; however, these compounds were equally effective or more potent at higher doses. Cells treated with these compounds had reduced cell proliferation. Sulindac sulfide was the most potent inhibitor of cell proliferation in this cell line, indicating that the inhibition of cell proliferation by these compounds does not directly correlate with the ability of these compounds to regulate the expression of ATF3 or Id1. Thus, it is likely that alternate or multiple pathways are involved in the inhibition of cell proliferation by these compounds. The precise mechanism regulating ATF3 and Id1 by these compounds is complex and likely involves multiple, overlapping, and/or alternate mechanisms. The HCT-116 cell line contains wild-type p53, and these genes reportedly are regulated by p53 under certain conditions. Therefore, further research is needed to establish if there is a correlation between the regulation of ATF3 and Id1 and the mechanism involved.
Id1 forms an inactive heterodimer with transcription factors such as ATF3, thereby preventing their binding to DNA and subsequent ability to alter gene expression.25 Thus, repression of Id1 would result in an enhancement of ATF3 expression and potentially its downstream biological activity such as inhibition of invasion. Further evidence that ATF3 is involved in the regulation of Id1 exists. ATF3 is induced by curcumin,26 whereas in other reports Id1 is suppressed by curcumin,27 indicating a possible link to the regulation of ATF3 and Id1 by other dietary compounds. Similar to resveratrol,28 curcumin is a dietary compound with chemopreventive activity.5 Therefore, the biological significance of Id1 reported in the literature indicates ATF3 is likely involved in the repression of Id1 by various dietary compounds. However, the precise mechanism regulating ATF3 and subsequently Id1 by these compounds is not known.
The inhibitor of differentiation family of genes plays an important role in cell growth, differentiation, proliferation, invasion, and angiogenesis.29 The overexpression of Id1 is seen in gastric cancers relative to adjacent normal tissue and is associated with decreased differentiation in human clinical samples.30 Expression of Id1 is elevated in colorectal cancer tissues compared with normal mucosa and is correlated with an increased mitotic index, and proliferation of colorectal cancer cells is blocked by antisense Id1.31 However, the control of these processes is often lost in cancer, making them ideal targets for anticancer treatments.32 Id1 is a transcription factor, and its gene is a potential protooncogene known to repress the biological activity of proteins such as ATF3.20,33 Id1 and ATF proteins reportedly interact based on pull-down assays and sodium dodecyl sulfate–polyacrylamide gel electrophoresis in human prostate cancer cells.24 Id1 is involved in cell growth, differentiation, angiogenesis, proliferation, and invasion,29 and the expression of Id1 is deregulated in various cancers, including gastrointestinal cancers (for a review, see Sikder et al.33). Id1 is also associated with various biological activities such as invasion.18,34 Lastly, the expression of ATF3 is induced,26 whereas that of Id1 is suppressed, by curcumin,27,35 a dietary compound with chemopreventive activity. Therefore, suppression of Id1 may explain the inhibition of invasion by ATF3 or by treatment with dietary compounds with anti-invasive activity such as genistein and resveratrol.23,36 Thus, the induction of ATF3 and repression of Id1 in cancer cells appear linked; however, the possibility that their expression is coincidental remains.
This work provides the first evidence that the transcription factor Id1 is repressed by numerous dietary compounds with cancer chemopreventive activity, thereby providing a potential explanation for the antitumorigenic activity of these compounds. Furthermore, this work provides insight into the complex nature of gene regulation by various compounds and indicates that multiple, overlapping mechanism are likely involved in the regulation of Id1 and potential downstream effects such as inhibition in cell proliferation by these compounds. This is a novel, first report demonstrating that the expression of Id1, a gene involved in cellular differentiation and correlated with a poor clinical outcome in patients with cancer, is repressed by a wide variety of compounds, from NSAIDs to polyphenolic dietary compounds, potentially through multiple mechanisms. Further work is needed to determine the molecular mechanism or mechanisms responsible for the regulation of Id1 and to determine if biological activity of ATF3 overexpression is mediated by repression of Id1 following exposure to polyphenolic and other dietary compounds and if this occurs in cancer cells of other origins.
Acknowledgments
The authors would like to thank the following persons from the National Institute of Environmental Health Sciences: Thomas E. Eling, Ph.D., for review of this manuscript; Jong Sik Kim, Ph.D. and Jennifer B. Collins for assistance with the microarray analysis.
Author Disclosure Statement
The authors affirm that no competing financial interests exist.
References
- 1.American Cancer Society. American Cancer Society, Dallas. Cancer Facts Figures. 2010. www.cancer.org/Research/CancerFactsFigures/CancerFactsFigures/cancer-facts-and-figures-2010 www.cancer.org/Research/CancerFactsFigures/CancerFactsFigures/cancer-facts-and-figures-2010
- 2.Michels KB. The role of nutrition in cancer development and prevention. Int J Cancer. 2005;114:163–165. doi: 10.1002/ijc.20662. [DOI] [PubMed] [Google Scholar]
- 3.Aggarwal BB. Takada Y. Oommen OV. From chemoprevention to chemotherapy: common targets and common goals. Expert Opin Investig Drugs. 2004;13:1327–1338. doi: 10.1517/13543784.13.10.1327. [DOI] [PubMed] [Google Scholar]
- 4.Seaver B. Smith JR. Inhibition of COX isoforms by nutraceuticals. J Herb Pharmacother. 2004;4:11–18. [PubMed] [Google Scholar]
- 5.Dorai T. Aggarwal BB. Role of chemopreventive agents in cancer therapy. Cancer Lett. 2004;215:129–140. doi: 10.1016/j.canlet.2004.07.013. [DOI] [PubMed] [Google Scholar]
- 6.Li Y. Sarkar FH. Gene expression profiles of genistein-treated PC3 prostate cancer cells. J Nutr. 2002;132:3623–3631. doi: 10.1093/jn/132.12.3623. [DOI] [PubMed] [Google Scholar]
- 7.Thompson MR. Xu D. Williams BR. ATF3 transcription factor and its emerging roles in immunity and cancer. J Mol Med. 2009;87:1053–1060. doi: 10.1007/s00109-009-0520-x. [DOI] [PMC free article] [PubMed] [Google Scholar]
- 8.Bottone FG., Jr Moon Y. Kim JS. Alston-Mills B. Ishibashi M. Eling TE. The anti-invasive activity of cyclooxygenase inhibitors is regulated by the transcription factor ATF3 (activating transcription factor 3) Mol Cancer Ther. 2005;4:693–703. doi: 10.1158/1535-7163.MCT-04-0337. [DOI] [PubMed] [Google Scholar]
- 9.Ise R. Han D. Takahashi Y. Terasaka S. Inoue A. Tanji M. Kiyama R. Expression profiling of the estrogen responsive genes in response to phytoestrogens using a customized DNA microarray. FEBS Lett. 2005;579:1732–1740. doi: 10.1016/j.febslet.2005.02.033. [DOI] [PubMed] [Google Scholar]
- 10.Carter TH. Liu K. Ralph W., Jr Chen D. Qi M. Fan S. Yuan F. Rosen EM. Auborn KJ. Diindolylmethane alters gene expression in human keratinocytes in vitro. J Nutr. 2002;132:3314–3324. doi: 10.1093/jn/132.11.3314. [DOI] [PubMed] [Google Scholar]
- 11.Bottone FG., Jr Martinez JM. Collins JB. Afshari CA. Eling TE. Gene modulation by the cyclooxygenase inhibitor, sulindac sulfide, in human colorectal carcinoma cells: possible link to apotosis. J Biol Chem. 2003;278:25790–25801. doi: 10.1074/jbc.M301002200. [DOI] [PubMed] [Google Scholar]
- 12.Liang G. Wolfgang CD. Chen BP. Chen TH. Hai T. ATF3 gene. Genomic organization, promoter, and regulation. J Biol Chem. 1996;271:1695–1701. doi: 10.1074/jbc.271.3.1695. [DOI] [PubMed] [Google Scholar]
- 13.Fawcett TW. Martindale JL. Guyton KZ. Hai T. Holbrook NJ. Complexes containing activating transcription factor (ATF)/cAMP-responsive-element-binding protein (CREB) interact with the CCAAT/enhancer-binding protein (C/EBP)-ATF composite site to regulate Gadd153 expression during the stress response. Biochem J. 1999;339:135–141. [PMC free article] [PubMed] [Google Scholar]
- 14.Chen HH. Wang DL. Nitric oxide inhibits matrix metalloproteinase-2 expression via the induction of activating transcription factor 3 in endothelial cells. Mol Pharmacol. 2004;65:1130–1140. doi: 10.1124/mol.65.5.1130. [DOI] [PubMed] [Google Scholar]
- 15.Stearns ME. Kim G. Garcia F. Wang M. Interleukin-10 induced activating transcription factor 3 transcriptional suppression of matrix metalloproteinase-2 gene expression in human prostate CPTX-1532 cells. Mol Cancer Res. 2004;2:403–416. [PubMed] [Google Scholar]
- 16.Yan C. Wang H. Boyd DD. ATF3 represses 72-kDa type IV collagenase (MMP-2) expression by antagonizing p53-dependent trans-activation of the collagenase promoter. J Biol Chem. 2002;277:10804–10812. doi: 10.1074/jbc.M112069200. [DOI] [PubMed] [Google Scholar]
- 17.Bottone FG., Jr Martinez JM. Alston-Mills B. Eling TE. Gene modulation by Cox-1 and Cox-2 specific inhibitors in human colorectal carcinoma cancer cells. Carcinogenesis. 2004;25:349–357. doi: 10.1093/carcin/bgh016. [DOI] [PubMed] [Google Scholar]
- 18.Gautschi O. Tepper CG. Purnell PR. Izumiya Y. Evans CP. Green TP. Desprez PY. Lara PN. Gandara DR. Mack PC. Kung HJ. Regulation of Id1 expression by SRC: implications for targeting of the bone morphogenetic protein pathway in cancer. Cancer Res. 2008;68:2250–2258. doi: 10.1158/0008-5472.CAN-07-6403. [DOI] [PubMed] [Google Scholar]
- 19.Li ZD. Hu XW. Wang YT. Fang J. Apigenin inhibits proliferation of ovarian cancer A2780 cells through Id1. FEBS Lett. 2009;583:1999–2003. doi: 10.1016/j.febslet.2009.05.013. [DOI] [PubMed] [Google Scholar]
- 20.Kashiwakura Y. Ochiai K. Watanabe M. Abarzua F. Sakaguchi M. Takaoka M. Tanimoto R. Nasu Y. Huh NH. Kumon H. Down-regulation of inhibition of differentiation-1 via activation of activating transcription factor 3 and Smad regulates REIC/Dickkopf-3-induced apoptosis. Cancer Res. 2008;68:8333–8341. doi: 10.1158/0008-5472.CAN-08-0080. [DOI] [PubMed] [Google Scholar]
- 21.Dai H. Meyer M. Stepaniants S. Ziman M. Stoughton R. Use of hybridization kinetics for differentiating specific from non-specific binding to oligonucleotide microarrays. Nucleic Acids Res. 2002;30:e86. doi: 10.1093/nar/gnf085. [DOI] [PMC free article] [PubMed] [Google Scholar]
- 22.Bottone FG., Jr Moon Y. Alston-Mills B. Eling TE. Transcriptional regulation of activating transcription factor 3 involves the early growth response-1 gene. J Pharmacol Exp Ther. 2005;315:668–677. doi: 10.1124/jpet.105.089607. [DOI] [PubMed] [Google Scholar]
- 23.Lee WY. Huang SC. Tzeng CC. Chang TL. Hsu KF. Alterations of metastasis-related genes identified using an oligonucleotide microarray of genistein-treated HCC1395 breast cancer cells. Nutr Cancer. 2007;58:239–246. doi: 10.1080/01635580701328636. [DOI] [PubMed] [Google Scholar]
- 24.Yu XL. Xie JX. [Isolation of Id1 interaction protein in human prostate cancer] Zhonghua Nan Ke Xue. 2008;14:796–799. [PubMed] [Google Scholar]
- 25.Kang Y. Chen CR. Massague J. A self-enabling TGFbeta response coupled to stress signaling: Smad engages stress response factor ATF3 for Id1 repression in epithelial cells. Mol Cell. 2003;11:915–926. doi: 10.1016/s1097-2765(03)00109-6. [DOI] [PubMed] [Google Scholar]
- 26.Yan C. Jamaluddin MS. Aggarwal B. Myers J. Boyd DD. Gene expression profiling identifies activating transcription factor 3 as a novel contributor to the proapoptotic effect of curcumin. Mol Cancer Ther. 2005;4:233–241. [PubMed] [Google Scholar]
- 27.Berse M. Bounpheng M. Huang X. Christy B. Pollmann C. Dubiel W. Ubiquitin-dependent degradation of Id1 and Id3 is mediated by the COP9 signalosome. J Mol Biol. 2004;343:361–370. doi: 10.1016/j.jmb.2004.08.043. [DOI] [PubMed] [Google Scholar]
- 28.Jang M. Cai L. Udeani GO. Slowing KV. Thomas CF. Beecher CW. Fong HH. Farnsworth NR. Kinghorn AD. Mehta RG. Moon RC. Pezzuto JM. Cancer chemopreventive activity of resveratrol, a natural product derived from grapes. Science. 1997;275:218–220. doi: 10.1126/science.275.5297.218. [DOI] [PubMed] [Google Scholar]
- 29.Lee KT. Lee YW. Lee JK. Choi SH. Rhee JC. Paik SS. Kong G. Overexpression of Id-1 is significantly associated with tumour angiogenesis in human pancreas cancers. Br J Cancer. 2004;90:1198–1203. doi: 10.1038/sj.bjc.6601684. [DOI] [PMC free article] [PubMed] [Google Scholar]
- 30.Han S. Gou C. Hong L. Liu J. ZheyiHan Liu C. Wang J. Wu K. Ding J. Fan D. Expression and significances of Id1 helix-loop-helix protein overexpression in gastric cancer. Cancer Lett. 2004;216:63–71. doi: 10.1016/j.canlet.2004.07.035. [DOI] [PubMed] [Google Scholar]
- 31.Wilson JW. Deed RW. Inoue T. Balzi M. Becciolini A. Faraoni P. Potten CS. Norton JD. Expression of Id helix-loop-helix proteins in colorectal adenocarcinoma correlates with p53 expression and mitotic index. Cancer Res. 2001;61:8803–8810. [PubMed] [Google Scholar]
- 32.Norton JD. ID helix-loop-helix proteins in cell growth, differentiation and tumorigenesis. J Cell Sci. 2000;113:3897–3905. doi: 10.1242/jcs.113.22.3897. [DOI] [PubMed] [Google Scholar]
- 33.Sikder HA. Devlin MK. Dunlap S. Ryu B. Alani RM. Id proteins in cell growth and tumorigenesis. Cancer Cell. 2003;3:525–530. doi: 10.1016/s1535-6108(03)00141-7. [DOI] [PubMed] [Google Scholar]
- 34.Takai N. Miyazaki T. Fujisawa K. Nasu K. Miyakawa I. Id1 expression is associated with histological grade and invasive behavior in endometrial carcinoma. Cancer Lett. 2001;165:185–193. doi: 10.1016/s0304-3835(01)00433-5. [DOI] [PubMed] [Google Scholar]
- 35.Goel A. Boland CR. Chauhan DP. Specific inhibition of cyclooxygenase-2 (COX-2) expression by dietary curcumin in HT-29 human colon cancer cells. Cancer Lett. 2001;172:111–118. doi: 10.1016/s0304-3835(01)00655-3. [DOI] [PubMed] [Google Scholar]
- 36.Ishiguro T. Nagawa H. ATF3 gene regulates cell form and migration potential of HT29 colon cancer cells. Oncol Res. 2001;12:343–346. doi: 10.3727/096504001108747792. [DOI] [PubMed] [Google Scholar]