Abstract
Objective
Chylothorax resulting from damage to the thoracic duct is often difficult to identify and repair. We hypothesized that near-infrared (NIR) fluorescent light could provide sensitive, real-time, high-resolution intraoperative imaging of thoracic duct anatomy and function.
Methods
In 16 rats (n=16), four potential NIR fluorescent lymphatic tracers were compared in terms of signal strength and imaging time: indocyanine green (ICG), the carboxylic acid of CW800, ICG adsorbed to human serum albumin (HSA), and CW800 conjugated covalently to HSA (HSA800). The optimal agent was validated in eight pigs approaching the size of humans, n = 6 by open surgery using the Fluorescence-Assisted Resection and Exploration (FLARE) imaging system and n = 2 by video-assisted thoracoscopic surgery (VATS) using the minimally invasive imaging system (m-FLARE). Lymphatic tracer injection site, dose, and timing were optimized.
Results
For signal strength, sustained imaging time, and clinical translatability, the best lymphatic tracer was ICG, which is already FDA-approved for other indications. In pigs, a simple subcutaneous injection of ICG into the lower leg, at a dose ≥36 μg/kg, provided thoracic duct imaging with an onset of 5 min after injection, sustained imaging for at least 60 min after injection, and a signal-to-background ratio ≥2. Using this technology, normal thoracic duct flow, collateral flow, injury models, and repair models could all be observed under direct visualization.
Conclusions
NIR fluorescent light could provide sensitive, sustained, real-time imaging of thoracic duct anatomy and function during both open surgery and VATS in animal models.
Keywords: Thoracic duct imaging, image-guided surgery, near-infrared fluorescence, indocyanine green
INTRODUCTION
Thoracic duct injury is a rare but serious complication following chest surgery and major neck dissections, with high mortality in untreated patients.1–3 Intraoperative identification of the thoracic duct can be difficult, especially during re-operation. Because traditional conservative treatment of thoracic duct injury has a high failure rate,1 intraoperative image guidance is essential for proper surgical management.4
Currently, lymphangiography and lymphoscintigraphy are available to preoperatively identify the site of thoracic duct damage; however, these techniques do not permit precise localization of the injured site.5–7 In addition, preoperative anatomical information is difficult to transfer directly to the intraoperative situation. In the past, blue dyes or indocyanine green (ICG) injections have been used,8–10 as well as an invasive injection procedure in which popliteal lymph nodes, testicular parenchyma, or the mesenteric lymph duct are used as the injection site. Although oral administration of heavy cream before surgery is sometimes performed to visualize chylous leakage or to prevent injury to the thoracic duct, the contrast provided is low and identification of the thoracic duct can be difficult.11 Optical imaging using near-infrared (NIR) fluorescence has the potential to solve all of these problems (reviewed in 12,13). Indeed, thoracic duct NIR fluorescence imaging using ICG has been reported previously for the detection of chyle fistulae in the thoracic cavity.14
Intraoperative, real-time NIR fluorescence imaging has been used in many areas of surgery to visualize surgical anatomy and tissue function simultaneously and non-invasively with high spatial resolution. The enabling technology for our study is the Fluorescence-Assisted Resection and Exploration (FLARE) NIR optical imaging system,15 which provides simultaneous acquisition of color video and two independent channels of invisible NIR fluorescence, one centered at 700 nm and the other at 800 nm, and the new, minimally invasive version of FLARE, the m-FLARE, for video-assisted thoracoscopic surgery (VATS). In this study, we hypothesized that these NIR imaging systems might provide adequate contrast for anatomical and functional assessment of thoracic duct after a simple subcutaneous injection. We also sought to optimize the lymphatic tracer, injection site, dose, and timing for the intraoperative assessment of the thoracic duct.
MATERIALS AND METHODS
Lymph Tracer Preparation
Pharmaceutical grade ICG was purchased from Akorn (Decatur, IL). ICG has been widely used in clinical applications such as liver function testing, cardiac output monitoring, and ophthalmic angiography. Recently, it has also been used in image-guided surgery studies to assess vessel patency after anastomoses in coronary artery bypass grafting (CABG; 16) and to evaluate perforator location and flap perfusion in breast reconstructive surgery after mastectomy 17. The carboxylic acid form of IRDye 800CW (CW800-CA) was purchased from LI-COR (Lincoln, NE). Both were diluted in phosphate buffered saline (PBS), pH 7.4 prior to injection. The non-covalent adsorption of ICG to human serum albumin (HSA), at a molar ratio of 1:1 (ICG:HSA), was performed as described previously.18 The covalent conjugation of CW800 to HSA, at a fluorophore to protein substitution ratio of 3.0 (HSA800), was prepared as described previously.18 The optical properties of all agents were measured in fetal bovine serum (FBS). The quantum yield (QY) of contrast agents in FBS were calculated using ICG in dimethyl sulfoxide (DMSO) (QY 13%19) as the calibration standard. For in vitro optical property measurements, on-line fiberoptic HR2000 absorbance (200-1100 nm) and USB2000FL fluorescence (350-1000 nm) spectrometers (Ocean Optics, Dunedin, FL) were used. NIR excitation was provided by a 770 nm NIR laser diode light source (Electro Optical Components, Santa Rosa, CA) set to 8 mW and coupled through a 300 μm core diameter, 0.22 NA fiber (Fiberguide Industries, Stirling, NJ).
Animal Studies
Animals studies were performed under the supervision of approved institutional protocols. Sixteen male 300-g Sprague-Dawley rats (Taconic Farms, Germantown, NY) were anesthetized with 65 mg/kg intraperitoneal pentobarbital and were ventilated by tracheotomy. Eight female Yorkshire pigs (E.M. Parsons and Sons, Hadley, MA) averaging 36.1 kg were induced with 4.4 mg/kg intramuscular Telazol , intubated, and maintained with 2% isoflurane. Selective ventilation of the left lung was used to deflate the right lung and help provide better visualization of the thoracic duct. ECG, heart rate, oxygen saturation, and body temperature were monitored throughout the experiment.
Optimization of Lymphatic Tracer in Rat
In 16 anesthetized rats, 50 μL of 10 μM contrast agent (1.5 μg/kg administered dose) was injected into mesenteric lymph nodes. For visualization of the thoracic duct, a right thoracotomy was performed under controlled ventilation to expose the posterior mediastinum near the spinal column. The FLARE imaging system15 was employed for quantification of NIR fluorescence images. Intensities of the thoracic duct were measured at 3, 5, 10, and 15 min following injection. The signal-to-background ratio (SBR) was defined as the NIR fluorescence intensity of a region of interest over the thoracic duct divided by that of the same size and shape region of interest over the thoracic wall.
Optimization of ICG Injection Site, Dose, and Imaging Time in Pig
Eight pigs were anesthetized as described above and placed in a left lateral decubitus position. A right thoracotomy was performed for open surgery (n = 6). Three small (2 to 3 cm) incisions were made in the right costal interspaces for VATS surgery (n = 2). The incision positions included the mid-axillary line at the 5th intercostal space, anterior axillary line at the 7th intercostal space, and posterior axillary line at the 7th intercostal space. The thoracoscope and surgical instruments were inserted through these incisions. An additional incision was made to retract the lung lobe or diaphragm if necessary.
After the inferior pulmonary ligament was divided, the thoracic duct was visualized using the FLARE or m-FLARE imaging systems. Fluorophore was injected subcutaneously into the groin (near, but not in groin lymph nodes), the thigh (near the great saphenous vein [GSV] detected by ultrasonography or palpation), and the shin (near the GSV). Control injections were made directly into groin lymph nodes exposed by dissection. Fluorophore injections (n = 3 per condition) could be repeated every 2 hr to minimize the number of animals needed. In n = 3 pigs per condition, 50 g of heavy cream was administered into the stomach or 1 cc of undiluted methylene blue was administered directly into a groin lymph node, and the thoracic duct was imaged over time.
To assess the affect of injected dose on SBR, the dose specified below was injected into the optimal injection site (n = 3 per dose). After each injection, gentle massage was performed for 5 min to cause smooth migration of fluorophore. For quantitative assessment, images were recorded at the time of injection (T = 0 min), then at 5, 10, 15, 30, 45, and 60 min post-injection. At each time point, the fluorescence intensity (FI) of a region of interest (ROI) over the thoracic duct and thoracic wall were quantified using custom software. The performance metric was the SBR, where the thoracic wall was used as background (BG). SBR = FI of ROI / FI of BG. For the injury and treatment model, the pleura between the azygos vein and the spine was opened and the thoracic duct was exposed. Next, thoracic duct injury was induced using a 20-gauge spinal needle and repaired by ligation with a 3-0 silk suture above and below the injury site.
NIR Fluorescence Imaging System
The FLARE imaging system has been described in detail previously.20 Our experiments employed 40,000 lx of white light (400–650 nm), 4.0 mW/cm2 of 670 nm near-infrared (NIR) fluorescence excitation light, and 11.0 mW/cm2 of 760 nm NIR fluorescence excitation light. NIR fluorescence camera exposure time was 67 msec or less. In the color-NIR merge images, 800 nm NIR fluorescence was pseudo-colored green and overlaid on top of the color video image.
m-FLARE Imaging System Components
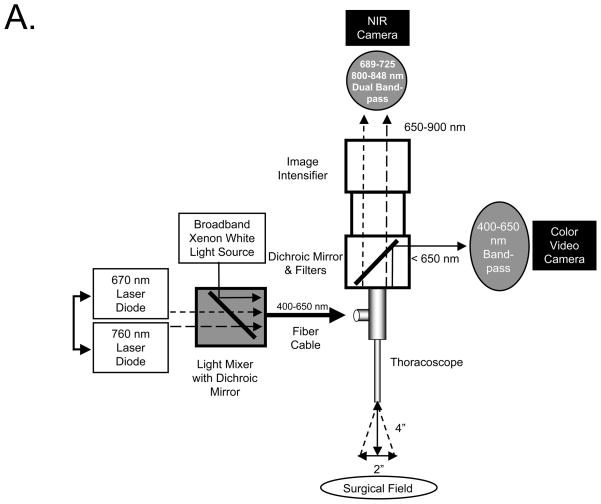
The initial endoscopic imaging system has been described in detail previously.21,22 The current version of m-FLARE introduced in this study utilized white light from a custom 300-W Xenon light source (Wilson Associates, Weymouth, MA) equipped with filtration to remove all NIR, NIR excitation light from a 1 W 670 nm and 2.5 W 760 nm laser diode assembly (OZ Optics, Quebec, CA) combined using a custom light mixer (Qioptiq Imaging Solutions, Fairport, NY), and a 0.6 NA fiber optic cable connected to a standard rigid laparoscope (10 mm diameter, 0°; Storz, Tuttlingen, Germany). Optimal distance between laparoscope and the surgical field was 10 cm. Through the laparoscope 30,000 lx of white light (400–650 nm), 6.0 mW/cm2 of 670 nm NIR fluorescence excitation light, and 20.0 mW/cm2 of 760 nm NIR fluorescence excitation light were generated over a 5 cm diameter field of view (FOV). The eyepiece of the laparoscope was attached to custom optics (Qioptiq Imaging Solutions), which permitted simultaneous acquisition of color video and NIR light using a scA640-74gc (Basler, Ahrensburg, Germany) color CCD camera and a GC655 (Prosilica, Stadtroda, Germany) NIR camera. Only the 800 nm emission channel was needed to image ICG.
Statistical Analysis
An analysis of variance (ANOVA) and Tukey’s Multiple Comparison Test were employed to determine the statistical difference between multiple groups. Tukey’s Multiple Comparison Test and ANOVA were used to show the pair that displays significant difference among the group. Statistical significance was set at p < 0.05. The analyzed values were described as mean ± SEM. All analyses were performed with GraphPad Prism software (version 4.0, GraphPad Software Inc., La Jolla, CA).
RESULTS
Optical Properties
The physical and optical properties of the NIR fluorescent lymphatic tracers tested for thoracic duct imaging are detailed in Table 1. ICG is a disulfonated heptamethine indocyanine small molecule, which is already FDA-approved for cardiac output and hepatic function studies, as well as ophthalmic angiography. It has an extremely small hydrodynamic diameter, which allows it to travel through lymph nodes and into the thoracic duct. CW800-CA is a new and improved heptamethine indocyanine small molecule with higher quantum yield and lower protein binding.18 ICG:HSA is the adsorption of ICG to a moderate-affinity binding site on human serum albumin (HSA). This complex is stable enough to permit sentinel lymph node mapping, but at only 7.3 nm in hydrodynamic diameter it can also pass through lymph nodes over time.18 We studied this complex with the hope that a larger hydrodynamic diameter would slow the rate of travel through the lymphatic system and permit thoracic duct imaging over a longer period of time. HSA800 is an improved NIR fluorescent albumin derivative with higher QY and stability.18
Thoracic Duct Imaging and Lymphatic Tracer Performance in Rats
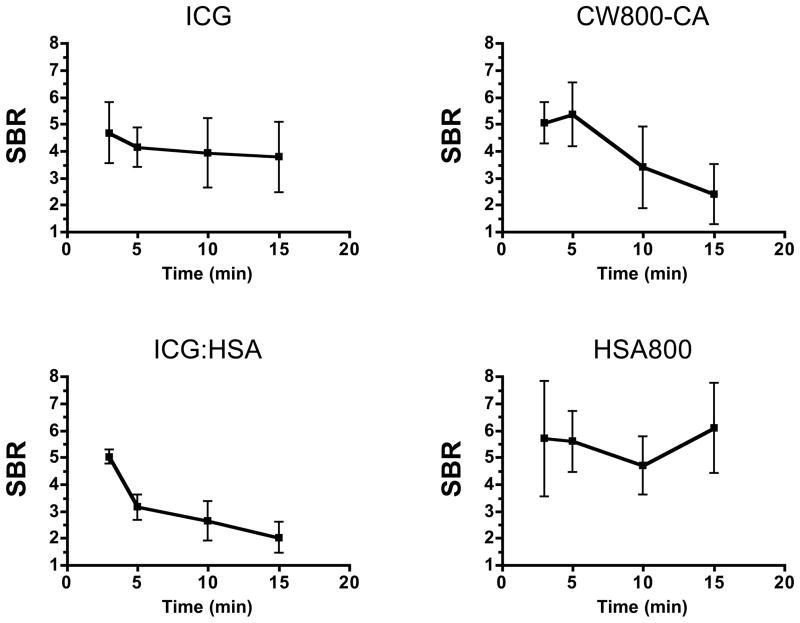
We found several differences among the NIR fluorescent contrast agents with respect to SBR of the thoracic duct and the period of optimal visualization. Over a 15 min visualization period, ICG demonstrated an SBR of 4 to 5, which remained relatively constant (Figure 1). Despite a higher QY of CW800-CA, which is supposed to cause higher fluorescence intensity, or the larger hydrodynamic diameter of ICG:HSA, the SBR of both at 3 min post-injection was close to that of ICG and decayed significantly over the 15 min imaging interval (Figure 1). These results are likely explained by rapid uptake into the bloodstream (CW800-CA) and/or desorption of ICG from albumin (ICG:HSA). We found that HSA800 shows the highest SBR, although not statistically significant when compared to ICG. Because HSA800 is not available for clinical translation, ICG was used in all subsequent experiments.
Figure 1. Quantitative Assessment of Various NIR Lymphatic Tracers for Thoracic Duct Imaging.
Signal-to-background ratio (SBR; mean ± SEM) over time in the thoracic duct of rats after injection of 1.5 μg/kg of the specified lymphatic tracer into mesenteric lymph nodes. N = 4 independent animals for each contrast agent studied.
Quantitative Assessment of ICG Injection Site, Dose, and Imaging Period in Pigs
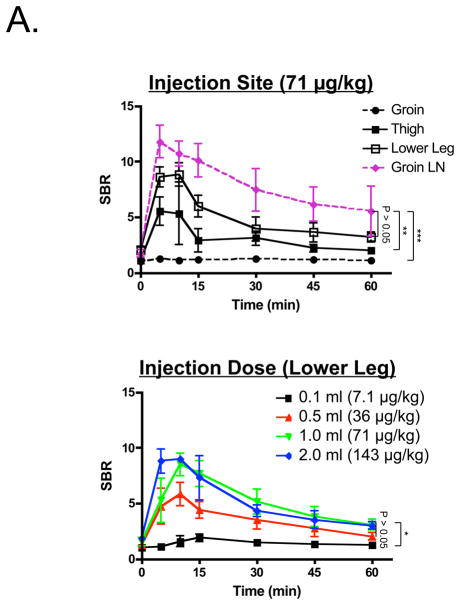
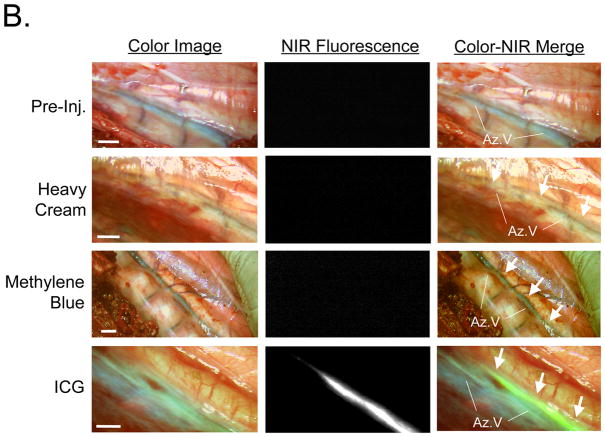
Because mesenteric lymph node injection is not a viable clinical option, we attempted to find a more suitable injection site. We injected 1 ml of a 3.2 mM ICG solution (71 μg/kg) into the groin, thigh, or lower leg of pigs. As shown in Figure 2A, injection into the groin worked poorly without pre-exposure of groin lymph nodes and direct injection. Direct injection into pre-exposed groin lymph nodes served as a control and provided rapid and bright thoracic duct imaging (Figure 2A). Simple subcutaneous injection into the thigh or lower leg (Figures 2A and Supplemental Figure 1), however, provided acceptably high SBR for up to 120 min post-injection (Supplemental Figure 2). Although there was no statistically significant difference between the thigh and lower leg sites (P >0.05), the lower leg site produced a higher SBR and was chosen for further study. In comparison to ICG, oral administration of heavy cream or injection of methylene blue directly into a groin lymph node provided relatively poor contrast (Figure 2B). In the latter case, differentiation of the thoracic duct from the azygos vein was difficult.
Figure 2. Thoracic Duct Imaging during Open Surgery in Pigs.
A. SBR (mean ± SEM) of the thoracic duct over time for different injection sites (top; n = 3 per condition) and different injection doses (bottom; n = 3 per condition). Statistical assessments of the groin lymph node vs. the lower leg, groin lymph node vs. the thigh, and groin lymph node vs. the groin subcutaneum (top) are shown. Statistical assessment of the various doses (36, 71, 143 μg/kg), and the difference between 7.1 μg/kg and 71 μg/kg (right) are also shown. *P < 0.05, **P < 0.01, and ***P < 0.001, using Tukey’s Multiple Comparison Test.
B. Comparison of typical contrast achieved with orally administered heavy cream, methylene blue, and ICG. Prior to injection (top row) the thoracic duct is not visible. After heavy cream (second row), the thoracic duct (white arrows) appears milky white. After methylene blue injection into a groin lymph node (third row), the thoracic duct (white arrows) has a bluish tint, much like the azygos vein. After subcutaneous injection of 71 μg/kg of ICG into the lower leg (bottom row), the thoracic duct (arrows) is visualized with high contrast using NIR fluorescence. Shown are representative images from n = 3 pigs per condition: color video (left), NIR fluorescence (middle), and a pseudo-colored (lime green) merge of the two (right). Az: azygos vein. Scale bar = 1 cm.
To optimize the dose, 0.1 ml of 3.2 mM ICG (7.1 μg/kg), 0.5 ml of 3.2 mM ICG (36 μg/kg), 1.0 ml of 3.2 mM ICG (71 μg/kg), and 2.0 ml of 3.2 mM ICG (143 μg/kg) were injected subcutaneously into the lower leg and the thoracic duct was imaged over time. All doses provided an SBR ≥2 except for 7.1 μg/kg. Although SBR trended higher with increasing dose (Figure 2A), there was no statistically significant difference among 36 μg/kg, 71 μg/kg, and 143 μg/kg (P >0.05).
Real-Time Imaging of Normal Flow, Injury, and Repair in the Thoracic Duct of Pigs
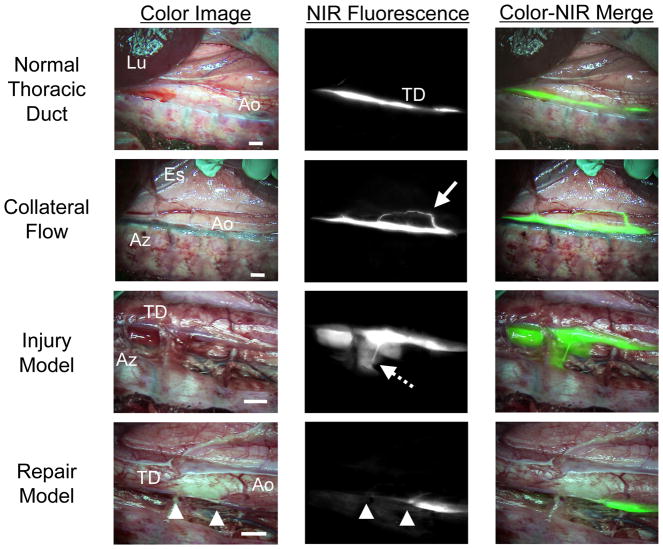
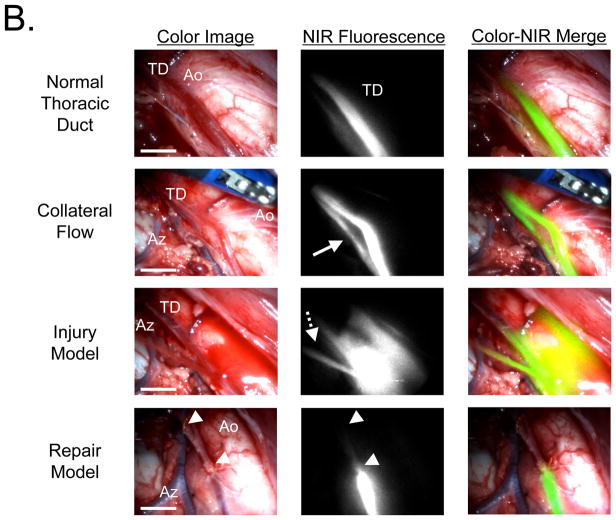
Using injection of 36 μg/kg of ICG into the lower leg, pulsatile flow and collateral flow within the thoracic duct could be assessed in real-time (Figure 3). Similarly, if the thoracic duct was injured, intraoperative NIR fluorescence imaging provided immediate localization of the injury, and repair could be performed under image guidance (Figure 3). Additionally, in the color image, ICG did not stain the surgical field even after injury, because it was significantly diluted during the long migration from the injection site.
Figure 3. High-Resolution Imaging of Thoracic Duct Anatomy and Function.
Shown are representative images 30 min after injection of 36 μg/kg ICG into the lower leg of pigs. Conditions included normal flow (top row), collateral flow (second row; solid arrow), an injury model (third row; dotted arrow), and image-guided repair of the thoracic duct (bottom row; arrowheads). Shown are color video (left), NIR fluorescence (middle), and a pseudo-colored (lime green) merge of the two (right). Lu: lung; Ao: aorta; TD: Thoracic duct: Es: esophagus; and Az: azygos vein. Scale bar = 1 cm.
NIR Fluorescence VATS Imaging of the Thoracic Duct
The minimally invasive m-FLARE imaging system (Figure 4A) provided similar imaging capabilities as seen during open surgery with FLARE. As shown in Figure 4B, m-FLARE permitted real-time visualization of the thoracic duct under conditions of normal flow, collateral flow, injury, and repair.
Figure 4. NIR Fluorescence Imaging of the Thoracic Duct using m-FLARE and VATS.
A. Light paths and system components of the m-FLARE imaging system for VATS.
B. VATS-based m-FLARE imaging of the thoracic duct. Shown are representative images 30 min after injection of 36 μg/kg ICG into the lower leg of pigs (n = 2). Conditions included normal flow (top row), collateral flow (second row; solid arrow), an injury model (third row; dotted arrow), and image-guided repair of the thoracic duct (bottom row; arrowheads). Shown are color video (left), NIR fluorescence (middle), and a pseudo-colored (lime green) merge of the two (right). Ao: aorta, TD: thoracic duct, and Az: azygos vein. Scale bar = 1 cm.
DISCUSSION
This study exploits invisible NIR fluorescent light and the contrast agent ICG, which is already FDA-approved for other indications, to provide surgeons with real-time, intraoperative identification of the thoracic duct during both open and minimally invasive surgeries. Currently, preoperative administration of heavy cream is used to detect fistulae during VATS ligation of the thoracic duct; however, heavy cream provides poor contrast (Figure 2B). On the contrary, a properly chosen NIR fluorescent lymphatic tracer, used in conjunction with an appropriate imaging system, can provide highly sensitive visualization.
In this study, ICG provided an excellent SBR and a long visualization time after a single subcutaneous injection of at least 36 μg/kg into the lower leg without changing surgical field. Due to the availability of near-infrared imaging systems, such as the FLARE, m-FLARE, SPY (Novadaq Technologies, Inc., Ontario, Canada),16 and PDE (Hamamatsu Photonics, Hamamatsu, Japan),23 and the existing FDA approval for ICG in other indications, future clinical trials should focus on optimizing dose and injection site in patients using our data from swine as a starting point.
A key variable in lymphatic tracer optimization is the tradeoff between contrast agent concentration at the injection site and dilution as the tracer flows through lymphatic channels. The higher the injected concentration, the lower the total fluorescence due to quenching. However, as the tracer travels through lymphatic channels and gets diluted in lymph, the NIR fluorescence signal becomes brighter and brighter. The key to successful imaging in patients will require delineation of a volume of ICG that does not cause tattooing at the injection site, a concentration of ICG that results in maximal SBR in the thoracic duct, and proper timing after injection for optimal thoracic duct contrast.
The best injection site in patients remains to be determined. The webbed space between the first and second toes of the foot is often used as the injection site for lymphangiography.24 However, such a long distance from the thoracic duct will cause significant dilution of ICG, and will result in a lower SBR. However, injection into the upper leg could be problematic because Schacht et al. reported that there exists a narrow and deep plane of subcutaneous fat, which is not present in the lower leg or dorsum of the foot.25 Such subcutaneous fat could impede the flow of ICG into lymphatic channels (see, for example, the groin injection in Figure 2A).
In summary, we demonstrate high sensitivity, real-time visualization of the thoracic duct using invisible NIR fluorescence light. Imaging is performed with an agent already FDA-approved for other indications, making translation to the clinic both practical and feasible.
Supplementary Material
Lymphatic flow away from the injection site for 71 μg/kg of ICG injected subcutaneously into the groin (top row), thigh (middle row), and lower leg (bottom row). Shown are color video images (left), NIR fluorescence images (middle), and a pseudo-colored (lime green) merge of the two (right). Arrowhead indicates the injection site. Scale bar = 1 cm.
Visualization of the thoracic duct over time in pig after subcutaneous injection of 71 μg/kg of ICG into the lower leg. Shown are representative images from pre-injection (Pre-Inj.) up to 120 min post-injection: Color video (left), NIR fluorescence (middle), and a pseudo-colored (lime green) merge of the two (right). Scale bar = 1 cm.
Acknowledgments
This work was funded by NIH grant #R01-CA-115296 (JVF). We thank Rita G. Laurence for assistance with animal surgery, Lindsey Gendall and Lorissa A. Moffitt for editing, and Eugenia Trabucchi and Linda Keys for administrative assistance.
Sources of Funding: This study was funded by National Institutes of Health (National Cancer Institute) Bioengineering Research Partnership grant #R01-CA-115296.
Footnotes
Conflicts of Interest: All FLARE technology is owned by BIDMC, a teaching hospital of Harvard Medical School. As inventor, Dr. Frangioni may someday receive royalties if products are commercialized. Dr. Frangioni is the founder and unpaid director of The FLARE Foundation, a non-profit organization focused on promoting the dissemination of medical imaging technology for research and clinical use.
References
- 1.Lapp GC, Brown DH, Gullane PJ, McKneally M. Thoracoscopic management of chylous fistulae. Am J Otolaryngol. 1998;19:257–262. doi: 10.1016/s0196-0709(98)90128-4. [DOI] [PubMed] [Google Scholar]
- 2.Wurnig PN, Hollaus PH, Ohtsuka T, Flege JB, Wolf RK. Thoracoscopic direct clipping of the thoracic duct for chylopericardium and chylothorax. Ann Thorac Surg. 2000;70:1662–1665. doi: 10.1016/s0003-4975(00)01921-4. [DOI] [PubMed] [Google Scholar]
- 3.Fahimi H, Casselman FP, Mariani MA, van Boven WJ, Knaepen PJ, van Swieten HA. Current management of postoperative chylothorax. Ann Thorac Surg. 2001;71:448–450. doi: 10.1016/s0003-4975(00)02033-6. discussion 450–441. [DOI] [PubMed] [Google Scholar]
- 4.Noel AA, Gloviczki P, Bender CE, Whitley D, Stanson AW, Deschamps C. Treatment of symptomatic primary chylous disorders. J Vasc Surg. 2001;34:785–791. doi: 10.1067/mva.2001.118800. [DOI] [PubMed] [Google Scholar]
- 5.Sachs PB, Zelch MG, Rice TW, Geisinger MA, Risius B, Lammert GK. Diagnosis and localization of laceration of the thoracic duct: usefulness of lymphangiography and CT. AJR Am J Roentgenol. 1991;157:703–705. doi: 10.2214/ajr.157.4.1892021. [DOI] [PubMed] [Google Scholar]
- 6.Stavngaard T, Mortensen J, Brenoe J, Svendsen LB. Lymphoscintigraphy using technetium-99m human serum albumin in chylothorax. Thorac Cardiovasc Surg. 2002;50:250–252. doi: 10.1055/s-2002-33099. [DOI] [PubMed] [Google Scholar]
- 7.Qureshy A, Kubota K, Ono S, Sato T, Fukuda H. Thoracic duct scintigraphy by orally administered I-123 BMIPP: normal findings and a case report. Clin Nucl Med. 2001;26:847–855. doi: 10.1097/00003072-200110000-00008. [DOI] [PubMed] [Google Scholar]
- 8.Enwiller TM, Radlinsky MG, Mason DE, Roush JK. Popliteal and mesenteric lymph node injection with methylene blue for coloration of the thoracic duct in dogs. Vet Surg. 2003;32:359–364. doi: 10.1053/jvet.2003.50044. [DOI] [PubMed] [Google Scholar]
- 9.Tsuruno A, Shibazaki A, Kanda N, Shibata H. Visualization of the thoracic duct with injections of dyes or contrast media into the testicular parenchyma in the rabbit. J Vet Med Sci. 2009;71:759–762. doi: 10.1292/jvms.71.759. [DOI] [PubMed] [Google Scholar]
- 10.Nakayama H, Ito H, Kato Y, Tsuboi M. Ultrasonic scalpel for sealing of the thoracic duct: evaluation of effectiveness in an animal model. Interact Cardiovasc Thorac Surg. 2009;9:399–401. doi: 10.1510/icvts.2009.206706. [DOI] [PubMed] [Google Scholar]
- 11.Nair SK, Petko M, Hayward MP. Aetiology and management of chylothorax in adults. Eur J Cardiothorac Surg. 2007;32:362–369. doi: 10.1016/j.ejcts.2007.04.024. [DOI] [PubMed] [Google Scholar]
- 12.Frangioni JV. In vivo near-infrared fluorescence imaging. Curr Opin Chem Biol. 2003;7:626–634. doi: 10.1016/j.cbpa.2003.08.007. [DOI] [PubMed] [Google Scholar]
- 13.Gioux S, Choi HS, Frangioni JV. Image-guided surgery using invisible near-infrared light: fundamentals of clinical translation. Mol Imaging. 2010;9:237–255. [PMC free article] [PubMed] [Google Scholar]
- 14.Kamiya K, Unno N, Konno H. Intraoperative indocyanine green fluorescence lymphography, a novel imaging technique to detect a chyle fistula after an esophagectomy: report of a case. Surg Today. 2009;39:421–424. doi: 10.1007/s00595-008-3852-1. [DOI] [PubMed] [Google Scholar]
- 15.Troyan SL, Kianzad V, Gibbs-Strauss SL, Gioux S, Matsui A, Oketokoun R, et al. The FLARE intraoperative near-infrared fluorescence imaging system: a first-in-human clinical trial in breast cancer sentinel lymph node mapping. Ann Surg Oncol. 2009;16:2943–2952. doi: 10.1245/s10434-009-0594-2. [DOI] [PMC free article] [PubMed] [Google Scholar]
- 16.Reuthebuch O, Haussler A, Genoni M, Tavakoli R, Odavic D, Kadner A, et al. Novadaq SPY: intraoperative quality assessment in off-pump coronary artery bypass grafting. Chest. 2004;125:418–424. doi: 10.1378/chest.125.2.418. [DOI] [PubMed] [Google Scholar]
- 17.Lee BT, Hutteman M, Gioux S, Stockdale A, Lin SJ, Ngo LH, et al. The FLARE intraoperative near-infrared fluorescence imaging system: a first-in-human clinical trial in perforator flap breast reconstruction. Plast Reconstr Surg. 2010;126:1472–1481. doi: 10.1097/PRS.0b013e3181f059c7. [DOI] [PMC free article] [PubMed] [Google Scholar]
- 18.Ohnishi S, Lomnes SJ, Laurence RG, Gogbashian A, Mariani G, Frangioni JV. Organic alternatives to quantum dots for intraoperative near-infrared fluorescent sentinel lymph node mapping. Mol Imaging. 2005;4:172–181. doi: 10.1162/15353500200505127. [DOI] [PubMed] [Google Scholar]
- 19.Benson C, Kues HA. Absorption and fluorescence properties of cyanine dyes. J Chem Eng Data. 1977;22:379–383. [Google Scholar]
- 20.Gioux S, Kianzad V, Ciocan R, Gupta S, Oketokoun R, Frangioni JV. High-power, computer-controlled, light-emitting diode-based light sources for fluorescence imaging and image-guided surgery. Mol Imaging. 2009;8:156–165. [PMC free article] [PubMed] [Google Scholar]
- 21.Matsui A, Tanaka E, Choi HS, Kianzad V, Gioux S, Lomnes SJ, et al. Real-time, near-infrared, fluorescence-guided identification of the ureters using methylene blue. Surgery. 2010;148:78–86. doi: 10.1016/j.surg.2009.12.003. [DOI] [PMC free article] [PubMed] [Google Scholar]
- 22.Matsui A, Tanaka E, Choi HS, Winer JH, Kianzad V, Gioux S, et al. Real-time intra-operative near-infrared fluorescence identification of the extrahepatic bile ducts using clinically available contrast agents. Surgery. 2010;148:87–95. doi: 10.1016/j.surg.2009.12.004. [DOI] [PMC free article] [PubMed] [Google Scholar]
- 23.Unno N, Suzuki M, Yamamoto N, Inuzuka K, Sagara D, Nishiyama M, et al. Indocyanine green fluorescence angiography for intraoperative assessment of blood flow: a feasibility study. Eur J Vasc Endovasc Surg. 2008;35:205–207. doi: 10.1016/j.ejvs.2007.09.001. [DOI] [PubMed] [Google Scholar]
- 24.Guermazi A, Brice P, Hennequin C, Sarfati E. Lymphography: an old technique retains its usefulness. Radiographics. 2003;23:1541–1558. doi: 10.1148/rg.236035704. discussion 1559–1560. [DOI] [PubMed] [Google Scholar]
- 25.Schacht V, Luedemann W, Abels C, Berens von Rautenfeld D. Anatomy of the subcutaneous lymph vascular network of the human leg in relation to the great saphenous vein. Anat Rec (Hoboken) 2009;292:87–93. doi: 10.1002/ar.20765. [DOI] [PubMed] [Google Scholar]
Associated Data
This section collects any data citations, data availability statements, or supplementary materials included in this article.
Supplementary Materials
Lymphatic flow away from the injection site for 71 μg/kg of ICG injected subcutaneously into the groin (top row), thigh (middle row), and lower leg (bottom row). Shown are color video images (left), NIR fluorescence images (middle), and a pseudo-colored (lime green) merge of the two (right). Arrowhead indicates the injection site. Scale bar = 1 cm.
Visualization of the thoracic duct over time in pig after subcutaneous injection of 71 μg/kg of ICG into the lower leg. Shown are representative images from pre-injection (Pre-Inj.) up to 120 min post-injection: Color video (left), NIR fluorescence (middle), and a pseudo-colored (lime green) merge of the two (right). Scale bar = 1 cm.


