Abstract
Repetitive mild or “concussive” traumatic brain injury (TBI) can cause substantial neurological impairment, but the pathology of TBI is not well understood. We report an experimental model of TBI in which the closed skulls of anesthetized male C57BL/6J mice are struck with an electromagnetically controlled rubber impactor twice with an interval of 24 hours between impacts. The mice had deficits in Morris water maze performance in the first week after injury that only partially resolved 7 weeks later. By routine histology there was no apparent bleeding, neuronal cell loss, or tissue disruption and amyloid precursor protein immunohistochemistry demonstrated very few immunoreactive axonal varicosities. In contrast, silver staining revealed extensive abnormalities in the corpus callosum and bilateral external capsule, the ipsilateral cortex and thalamus, and the contralateral hippocampal CA1 stratum radiatum and stratum oriens. Electron microscopy of white matter regions demonstrated axonal cytoskeletal disruption, intra-axonal organelle compaction and irregularities in axon caliber. Reactive microglia were observed in the same areas as the injured axons by both electron microscopy and Iba1 immunohistochemistry. Quantitative analyses of silver staining and Iba1 immunohistochemistry at multiple time points demonstrated transient cortical and thalamic abnormalities; white matter axonal cytoskeletal abnormalities and microglial reaction persisted to 7 weeks after injury. Thus, prominent and long-lasting abnormalities in this TBI model were underestimated using conventional approaches. The model may be useful for mechanistic investigations and preclinical assessment of candidate therapeutics.
Keywords: Axonal injury, Electron microscopy, Microglia, Mouse, Repetitive concussion, Silver staining, Traumatic brain injury
INTRODUCTION
Concussive traumatic brain injury (TBI) has been defined in many ways, but common elements include temporary impairment in cerebral function following traumatic biomechanical forces without evidence of gross structural injury to the brain. The majority of the 1.7 million or more TBIs that occur each year in the United States are “mild,” uncomplicated injuries (1-3). While most patients with concussion recover well, growing evidence indicates that multiple concussions are less benign (4-8). Perhaps the best-documented examples are in chronic traumatic encephalopathy patients. These are typically athletes in contact sports who sustain several concussive brain injuries and subsequently demonstrate cognitive deterioration, emotional instability and other symptoms (7, 9). The problem of repetitive concussive TBI is also of great interest to the military because many military personnel sustain multiple combat-related concussive injuries during their service (10, 11).
Little is known about the pathology of concussion or the mechanisms underlying the adverse effects of multiple concussions. To begin to address this gap, several groups have produced animal models of repeated mild TBI. In an early study involving 7 injuries repeated at 24 hours intervals in rats, neuronal cytoskeletal protein abnormalities were prominent (12). A single closed-skull injury caused subtle and transient behavioral and immunohistochemical abnormalities in mice, whereas 2 such injuries 24 hours apart caused more persistent behavioral impairments and axonal injury in the thalamus but no gross pathological injury or neuronal cell loss (13). In another mouse model there were behavioral deficits but no apparent neuronal loss observed following 4 mild injuries at 24-hour intervals (14). Repetitive mild TBI was shown to accelerate β-amyloid deposition in Tg2576 transgenic mice, a model of Alzheimer disease-related amyloidosis (15). Vitamin E pretreatment prevented this β-amyloid deposition and improved behavioral performance (16). A window of vulnerability lasting approximately 5 days between injuries was described (17). Contra-coup histological abnormalities were found after 3 mild impacts accompanying deficits in spatial learning in another mouse model (18). In all of these studies, the pathological features of the injury were relatively subtle in comparison to the extent of the behavioral deficits.
This mismatch between structural injury and performance suggests 2 non-mutually exclusive hypotheses: 1) functional disturbances in electrical or chemical signaling could underlie the performance impairments; or 2) previously employed histological assessments may not be sufficiently sensitive to detect structural injuries responsible for the impairments. The primary objective of the current study was to elucidate the structural consequences of closed-skull mild repetitive TBI. We hypothesized specifically that traumatic axonal injury might be more severe and widespread than has been previously recognized. This hypothesis was based on recent imaging-based findings of white matter abnormalities in human patients with mild TBI (19, 20). Silver staining, Iba1 immunohistochemistry, and electron microscopy following 2 impacts were used to test this hypothesis. Mice subjected to 1 impact and 1 sham procedure, or 2 sham procedures were used as controls. Using these methods we found extensive and persistent multifocal argyrophilic abnormalities, ultrastructural evidence for axonal cytoskeletal injury, and marked reactive microgliosis following 2 impacts. Conventional histological methods markedly underestimated these pathologies.
MATERIALS AND METHODS
Animals
All experiments were approved by the Washington University Animal Studies Committee. Male C57BL/6J wild type mice were purchased from Jackson Labs (Bar Harbor, ME) at 6 to 8 weeks of age. They were housed with siblings at 2 to 5 mice per standard cage for at least 1 week before experiments. They were fed standard mouse chow and given water ad libitum. Ambient temperature was controlled at 20°C to 22°C with 12-hour light / 12-hour dark cycles. A total of 147 mice were used.
Electromagnetic Repetitive Closed-Skull TBI
When mice were 2 to 3 months of age they were anesthetized with 5% isoflurane and placed in a stereotaxic frame with rounded Kopf head holders (David Kopf Instruments, Tujunga, CA). Pointed ear bars were not used. Temperature was controlled at 37°C using a feedback temperature controller (Cell Microcontrols, Norfolk, VA). Isoflurane was delivered by nose cone at 2% in air. The heads were shaved and prepped with Betadine. A midline skin incision was made and the skull was exposed. No craniotomy was performed.
A rubber tip (Precision Associates, Inc., Minneapolis, MN) was mounted on an electromagnetic stereotaxic impact device in place of the metal tip used in previous controlled cortical impact studies (21). The rubber tip was 9 mm in diameter and the rubber had a spring constant of 3.01 N/mm. The tip was fully extended and lowered at a 20° angle until the vertex touched the skull at 1.8 mm caudal to bregma and 3.0 mm left of midline. This was confirmed with a hand lens in all cases. The tip was then retracted automatically. The stereotaxic device was moved down by 3.3 mm and the electromagnetic device was triggered, driving the tip 3.3 mm into the exposed skull at 5.0 m/s with a dwell time of 100 milliseconds. The deformation of the rubber tip spread the impact force over the skull. There were <3% skull fractures and no immediate fatalities after these injuries. Mice with skull fractures were killed and were not used in any experiments. After impact, the skin was sutured and the mice were allowed to recover from anesthesia on a warming pad and then returned to their home cages. After 24 ± 1 hour, a second identical closed-skull TBI procedure was performed. For sham injuries, the same procedure was performed except that the impact device was discharged in the air; the handling of the mice and duration of anesthesia were the same for TBI and sham procedures.
Impacts and sham procedures were performed by 2 independent investigators (Y.S. and R.E.B.) without direct contact during the procedures. Behavioral performance, silver staining, and Iba1 immunohistochemical appearance were essentially indistinguishable for injuries performed by the 2 investigators. The mice used for behavioral assessments were not used for histological analyses. Nonetheless, after completion of behavioral testing these mice were killed and their brains were examined for hemorrhage. Mice with hemorrhages were excluded from the behavioral analyses.
Behavioral Testing using the Morris Water Maze
In the first experiment, a total of 26 mice were randomly assigned to TBI-TBI, TBI-Sham or Sham-Sham groups and tested 2 days after the second TBI or sham procedure. In the second experiment, a total of 20 mice were randomly assigned to TBI-TBI or Sham-Sham groups and tested 2 days after the second TBI or sham procedure. In the third experiment, 18 mice were randomly assigned to TBI-TBI or Sham-Sham groups and tested 7 weeks after the second TBI or sham procedure. The examiners were blinded to group identity and all mice had indistinguishable sutures on their heads.
The water maze was 109 cm in diameter and the platform was 11 cm in diameter (21). Hidden platform testing was performed on 4 days with 3 trials per days lasting a maximum of 60 seconds per trial. At the end of day 4, a single 30-second probe trial was performed with the platform removed. On the following day, visible platform testing was performed, again with 3 trials per mouse, with the platform above the surface of the water, marked with a pole, and placed in a different location of the pool.
Histopathology
Mice were killed by deep isoflurane anesthesia and cardiac perfusion with ice-cold phosphate-buffered saline with 0.3% heparin. Brains were removed and examined for subdural or subarachnoid hemorrhage. Hemorrhages that usually underlay the impact site were observed in <5% of mice and these brains were not used for analysis. The remaining brains were fixed in 4% paraformaldehyde for 24 hours and equilibrated in 30% sucrose for 3 days. Coronal slices were made every 50 μm using a freezing sliding microtome from the most anterior portion of the corpus callosum to the most posterior portion of the hippocampus.
Gross contusions, tissue loss and selective cell loss were assessed using cresyl violet staining. Amyloid-precursor protein immunohistochemistry was performed as previously described (22, 23). The 3, 3’ diaminobenzidine (DAB) chromogen is also very sensitive to blood and the presence of DAB-positive red blood cells was used to assess for intraparenchymal hemorrhage.
Silver staining was performed using the FD NeuroSilver Kit II (FD NeuroTechnologies, Ellicott City, MD) according to the manufacturer's instructions with the following modification. The protocol was made more sensitive using 2-minute incubations instead of 4-minute incubations in step 6 and constant vigorous agitation from steps 5 to 7. This also resulted in slightly increased background. Brain sections were stained in batches such that each batch had brain sections from each post-injury time point or experimental group. Thus, there were no systematic biases introduced by variability in staining intensity from batch to batch.
Iba1 immunohistochemistry was performed using a rabbit polyclonal anti-Iba1 antibody (Wako Chemicals USA, Richmond, VA). Free-floating sections were blocked with 3% normal goat serum in Tris-buffered saline (TBS) containing 0.25% Triton X (TBS-X) for 30 minutes to eliminate non-specific binding. Sections were incubated overnight in TBS-X solution containing anti-Iba1 antibody (0.5 μg/ml) and 1% normal goat serum. Sections were washed with TBS 3 times for 5 minutes each between applications of antibody solutions. Bound antigen-antibody complexes were detected with biotinylated goat anti-rabbit secondary antibody. Horseradish peroxidase method (ABC Elite kit, PK6100, Vector Laboratories, Burlingame, CA) and DAB were used for visualization.
Quantitative Analyses of Histopathology
Densitometric analysis of silver staining was performed on 4 sections per mouse separated by 400 μm for ipsilateral cortex and ipsilateral thalamus. Three sections per mouse were used for ipsilateral dentate gyrus, midline corpus callosum plus ipsilateral external capsule, and contralateral hippocampal CA1. These sections spanned approximately bregma -1.1 to -2.3 mm (24). The ipsilateral cortical region quantified was defined as dorsal to a horizontal line extending from the dorsal-most portion of the thalamus and lateral to a vertical line extending through the tip of the cingulum. Images were acquired and digitized using a Nanozoomer HT system (Hamamatsu Photonics, Hamamatsu City, Japan). ImageJ (NIH, Bethesda, MD) was used for quantitation of the staining on these digitized images. Silver staining was expressed in arbitrary units, ranging from 0 (minimum) to 255 (maximum). Group sizes between 5 and 8 mice were killed at each time point for histological analyses. These were separate groups of mice from those used for behavioral assessments.
StereoInvestigator version 8.2 software (MBF Bioscience, Williston, VT) was used for stereological estimation. All assessments were made by a single investigator blinded to injury status and survival time of experimental animals. The optical fractionator method was employed for quantification of total numbers of Iba1-positive cells with activated microglial morphology per cubic mm of tissue. Details on these stereological methods have been described (22). Briefly, 4 sections per mouse (each separated by 400 μm) were used for ipsilateral cortex and thalamus and sections per mouse were used for estimations in corpus callosum, dentate gyrus and hippocampal CA1 regions. For estimation of Iba1-positive cells in the cortex and thalamus, a grid of 400 μm × 400 μm and a counting frame of 80 μm × 80 μm were used. For the corpus callosum, dentate gyrus and CA1, a grid of 180 μm × 180 μm and a counting frame of 80 μm × 80 μm were used.
The optical fractionator method was also used to count cresyl violet stained cells in the polymorphic region of the dentate gyrus, excluding the densely packed granule cells and CA3 cells (25) in 4 sections per mouse. A grid of 100 μm × 100 μm and a counting frame of 50 μm × 50 μm were used. Gunderson coefficients of error were less than 0.1.
Electron Microscopy
Separate mice were injured or underwent sham procedures for electron microscopic analysis. They were perfused for 5 minutes with 2% glutaraldehyde plus 2% paraformaldehyde in 0.1 M sodium cacodylate 2 mM Calcium chloride buffer (pH 7.4). Brains were removed, sectioned into 1-mm-thick coronal slabs and further fixed in the same solution for 24 hours. After dehydration the slabs were embedded in plastic and ultrathin sections were prepared for electron microscopy as described (22)
Statistical Methods
All analyses were performed using Statistica 6.0 (StatSoft, Tulsa, OK). Repeated measures ANOVA was used to compare hidden platform Morris water maze performance between groups. One-way ANOVAs with Tukey post-hoc pairwise comparisons were used to compare Morris water maze probe performance, visible platform performance and quantitative histological parameters between groups. Dunnett's post-hoc tests were used to compare quantitative histological parameters at each time point after injury to control (Sham-Sham) groups. Even though both the silver staining intensity and Iba1-immunoreactive microglial counts were approximately normally distributed, the correlation between these variables did not satisfy the assumptions required for Pearson correlation; the residuals following linear regression were not normally distributed. Therefore, nonparametric Spearman correlations were used to test for correlations between silver staining intensity and Iba1-immunoreactive microglial counts. P values less than 0.05 were considered significant. Error bars represent SEM.
RESULTS
A Stereotaxic Electromagnetic Impact Model of Repetitive Closed-Skull TBI
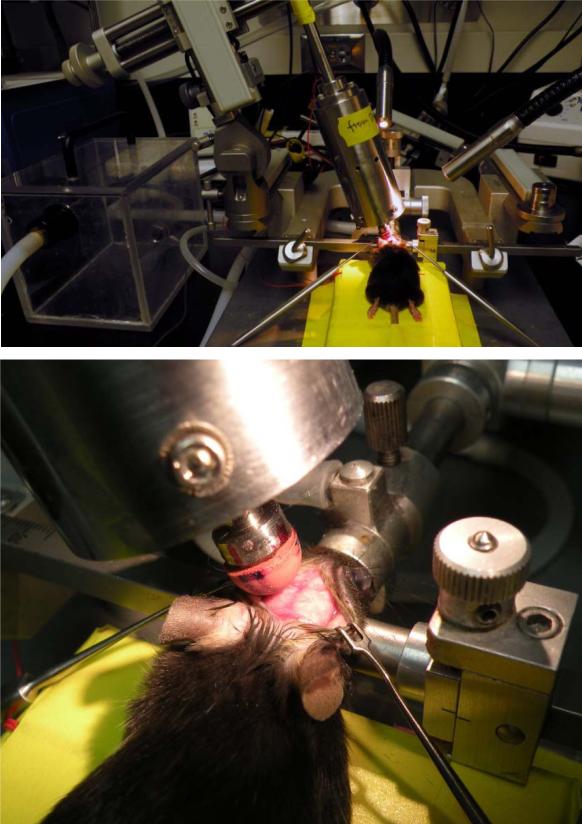
We adapted the repetitive impact injury model of Laurer et al (13) to a stereotaxic format with an electromagnetic impact device (Fig. 1). Using a rubber tip and an impact depth of 3.3 mm below the surface of the exposed skull, mild injuries were consistently produced. Smaller impact depths did not cause significant behavioral impairments and larger impact depths increased the incidence of skull fractures (data not shown).
Figure 1.
Closed-skull traumatic brain injury in mice using an electromagnetic controlled stereotaxic impact device. Top: A mouse in the stereotaxic frame with the stereotaxic electromagnetic impactor aligned above the skull. Bottom: A mouse in the stereotaxic frame with exposed skull and the rubber tip touching the surface of the skull.
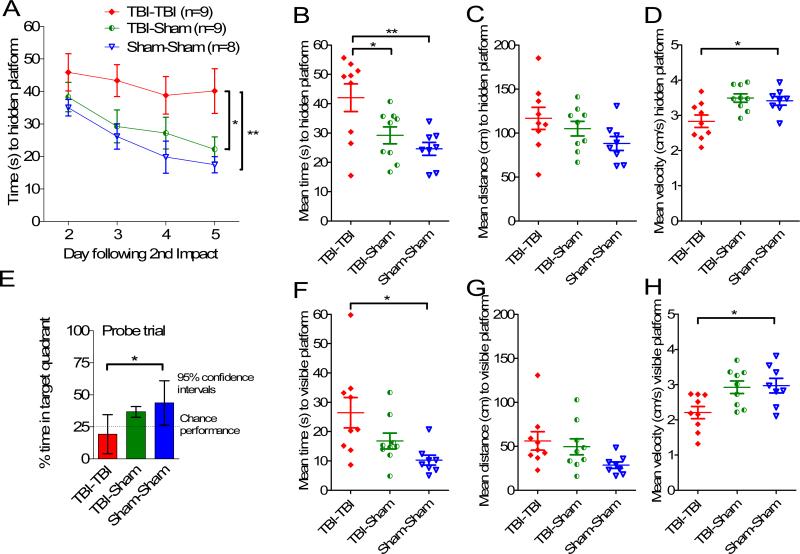
The TBI-TBI mice had significant impairments in the Morris water maze test (Fig. 2). Impacts were performed on days 0 and 1; testing was performed on days 3 to 6. In hidden platform testing there were significant main effects of injury status (F = 6.57, p = 0.0055, repeated measures ANOVA) and day of training (F = 6.72, p = 0.00048), but no interaction between injury status and day of training (p = 0.78) (Fig. 2A-D). In pre-specified post-hoc testing, the TBI-TBI mice had 71% longer mean latencies over all 4 days to find the hidden platform vs. Sham-Sham mice (42.1 ± 3.5 vs. 24.6 ± 3.7 sec) (Fig. 2A, B, p = 0.006, Tukey post-hoc test). Similarly, TBI-TBI mice had longer latencies than TBI-Sham mice (29.2 ± 3.5 sec, p = 0.039). There was no difference between Sham-Sham and TBI-sham mice (p = 0.63). Mean distance to the hidden platform was 32% longer (116 ± 12 cm vs. 88 ± 8 cm) in TBI-TBI vs. Sham-Sham mice, but this was not statistically significant in this experiment (Fig. 2C, p = 0.13, Tukey post-hoc test). Swim speed was 20% slower in the TBI-TBI vs. Sham-Sham mice (Fig. 2D, p = 0.024, Tukey post-hoc test). This likely accounts for the larger magnitude change in latency measurements compared with distance measurements.
Figure 2.
Repetitive closed-skull traumatic brain injury (TBI) caused behavioral impairments in the Morris water maze. Male C57BL/6J mice at 2 to 3 months of age were randomly assigned to receive 2 impacts (TBI-TBI), 1 impact and 1 sham (TBI-Sham) or 2 sham procedures (Sham-Sham) on day 0 and day 1. Mice were tested in the Morris water maze 2 to 5 days later in a blinded fashion. (A) Time to hidden platform as a function of day of training. TBI-TBI mice performed worse than either Sham-Sham (** p = 0.006) or TBI-Sham (*p = 0.039) mice. (B) Mean time to hidden platform across all 4 days of hidden platform training (** p = 0.006, *p = 0.039). (C) Mean distance to hidden platform across all 4 days of hidden platform training. No difference between groups. (D) Mean swimming velocity across all 4 days of hidden platform training. TBI-TBI mice swam more slowly than Sham-Sham mice (*p = 0.024). (E) Probe trial. After hidden platform training on day 5, a 30-second probe trial was performed. TBI-TBI mice performed at no better than chance and worse than Sham-Sham mice (p = 0.012). (F) Mean time to visible platform. On day 6 a single day of visible platform training was performed. TBI-TBI mice performed worse than sham-sham mice (*p = 0.013). (G) Mean distance to visible platform. No differences between groups. (H) Mean swimming velocity to visible platform. TBITBI mice swam more slowly than Sham-Sham mice (*p = 0.02).
Probe test performance was markedly impaired in the TBI-TBI mice (Fig. 2E). These mice spent no more time in the target quadrant than the 25% that would be expected by chance (mean 19.2%, 95% confidence interval: 4.0%–34.5%). In contrast, TBI-Sham mice spent more time in the target quadrant than would be expected by chance (mean 36.7%, 95% confidence interval: 26.3%–47.1%) as did the Sham-Sham mice (mean 43.6%, 95% confidence interval: 32.5%– 54.7%). The difference between TBI-TBI and Sham-Sham mice was significant (p = 0.012, Tukey post-hoc test).
Visible platform performance was also impaired in the TBI-TBI mice (Fig. 2F-H), with significantly longer latencies (Fig. 2F, p = 0.013), a trend towards longer distances (Fig. 2G, p = 0.08), and significantly slower velocities (Fig. 2H, p = 0.02) vs. the Sham-sham mice. There were no differences in visible platform performance between TBI-Sham and Sham-Sham mice.
The scatter plots of the Morris water maze performance for individual mice suggested that some aspects of the data were not normally distributed. The sample sizes were modest, so direct testing for normalcy (e.g. Shapiro-Wilk) was not performed. However, using non-parametric Mann-Whitney U tests to compare the TBI-TBI and Sham-Sham mice resulted in similar conclusions. Specifically, time to the hidden platform was longer (Fig. 2B, p = 0.02); hidden platform swim speed was slower (Fig. 2D, p = 0.034); probe test target quadrant occupancy was lower (Fig. 2E, p = 0.016); time to the visible platform was longer (Fig. 2F, p = 0.007); distance to the visible platform was greater (Fig. 2G, p = 0.012); and visible platform swim speed was slower (Fig. 2H, p = 0.012).
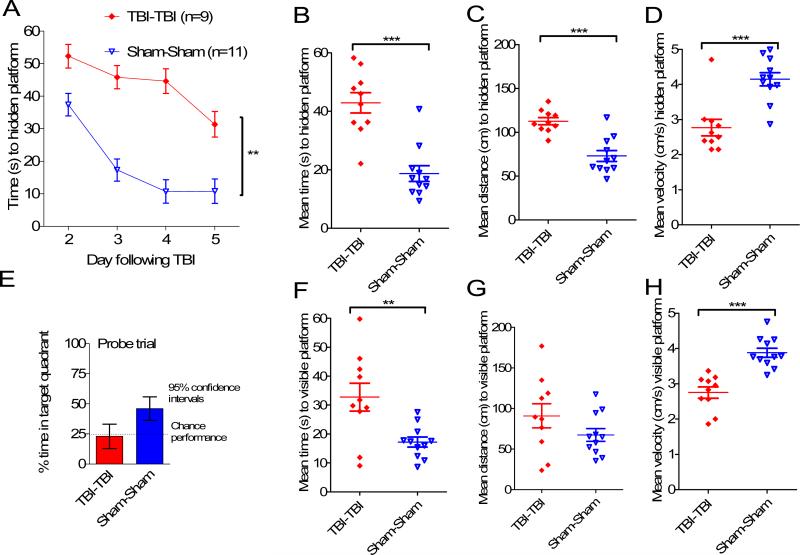
In a second experiment performed by an independent investigator, Morris water maze performance deficits after 2 impacts were very similar to those in the first experiment, indicating reproducibility (Fig. 3). Notably, in the second experiment the mean distances to reach the hidden platform were statistically significantly longer in the TBI-TBI mice than the Sham-Sham mice (p < 0.001). There were some differences in absolute performance between experiments, as has been reported by others (26).
Figure 3.
Independent replication of behavioral impairments. A second, independent investigator performed either 2 closed-skull impacts (TBI-TBI) or 2 sham procedures (Sham-Sham) and tested mice in the Morris water maze. (A) Time to hidden platform as a function of day of training. (B) Mean time to hidden platform across all 4 days of hidden platform training. (C) Mean distance to hidden platform across all 4 days of hidden platform training. (D) Mean swimming velocity across all 4 days of hidden platform training. (E) Probe trial. (F) Mean time to visible platform. (G) Mean distance to visible platform. (H) Mean swimming velocity to visible platform (*p < 0.05, **p < 0.005, ***p < 0.0005).
In summary, the behavioral performance of TBI-TBI mice was worse than that of either TBI-Sham (Fig. 2A, B) or Sham-Sham mice (Figs. 2A, B, 3). Differences between TBI-TBI and TBI-Sham mice were not always statistically significant, but this was likely due to the relative insensitivity of some of the behavioral measures. These results indicate impairments in spatial learning and memory as well as procedural and motor dysfunction in the TBI-TBI mice. The longer times to reach the hidden platform are likely due to both spatial learning and motor impairments, whereas the probe test is a relatively pure indicator of spatial memory impairment. The reduced swim speeds suggest a motor impairment. The visible platform deficits could be related to motor impairments, visual dysfunction, or other motivational factors.
Few Gross or Histopathological Abnormalities in TBI-TBI Mice
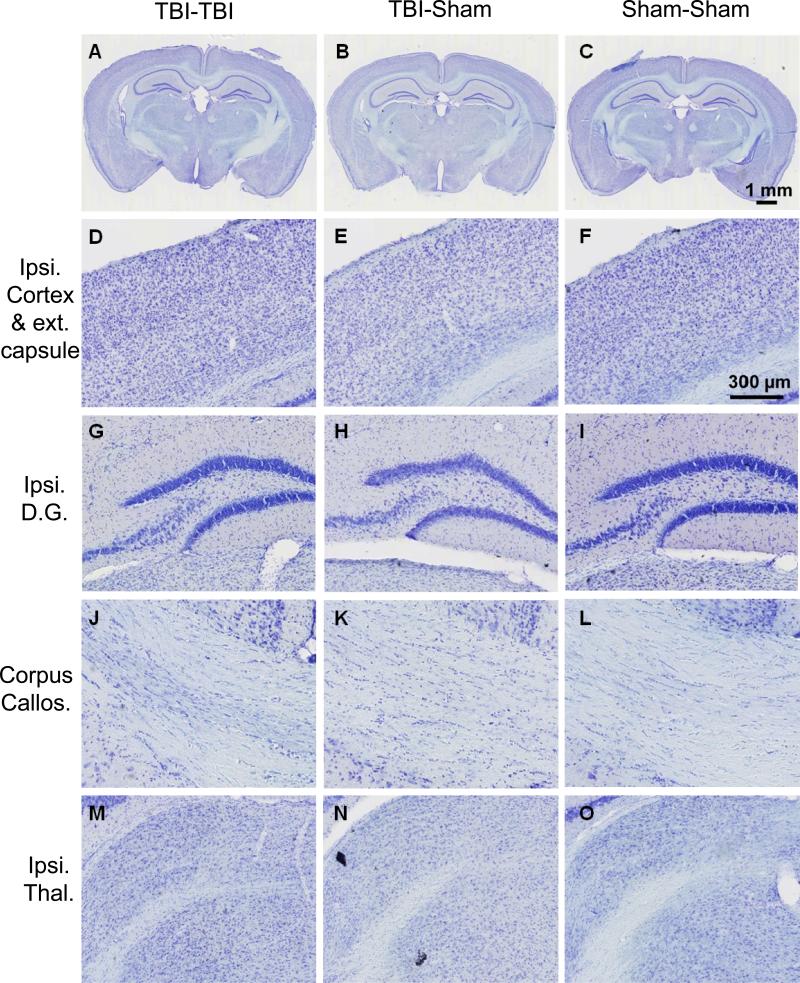
The brains of mice killed at 7 days following the first of 2 impacts, 1 impact plus 1 sham, or 2 sham procedures were typically indistinguishable on gross pathological examination. Cresyl violet staining revealed no contusions (Fig. 4A-C), no cortical cell loss underlying the site of impact (Fig. 4D-F), no ipsilateral dentate gyrus cell loss (Fig. 4G-I), no corpus callosum abnormalities (Fig. 4J-L) and no ipsilateral thalamic cell loss (Fig. 4M-O). No intraparenchymal hemorrhages were detected microscopically. We performed stereological counts of cresyl violet-stained cells in the polymorphic region of the dentate gyrus, excluding the densely packed granule cells and CA3 cells (25). This revealed no difference between TBI-TBI and Sham-Sham mice (8316 ± 2275 vs. 8884 ± 1239 cells, p = 0.53, Mann-Whitney U test). Thus, the behavioral impairments and absence of obvious structural injury indicate that this model shares essential features with human repetitive mild traumatic brain injury.
Figure 4.
Cresyl violet staining revealed no abnormalities in the brains from 2 closed-skull impact (TBI-TBI) mice, traumatic brain injury (TBI)-sham mice, or sham-sham mice 7 days after the first impact. (A-C) Low-power views of coronal sections at approximately bregma – 2.18 mm (24). (D-F) Higher-power view of the cortex underlying the impact site. (G-I) Ipsilateral hippocampal dentate gyrus. (J-L) Corpus callosum. (M-O) Ipsilateral thalamus. Scale bar in panel F refers to panels D-O.
APP Immunohistochemistry
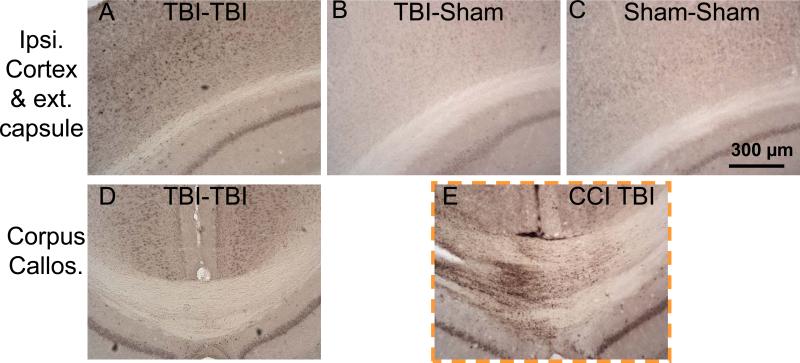
There were subtle abnormalities on APP immunohistochemistry in serial brain sections from mice subjected to 2 impacts at 7 days following injury. These included a few punctate immunoreactive swellings in the ipsilateral cortex and external capsule and increased perinuclear cytoplasmic staining of cortical neurons (Fig. 5A). TBI-Sham and Sham-Sham mice did not show these abnormalities (Fig. 5B, C). The corpus callosum was entirely unremarkable in the TBI-TBI mice (Fig. 5D). As a positive control, immunohistochemistry on brain sections from a mouse subjected to controlled cortical impact TBI (23) revealed extensive APP-immunoreactive axonal varicosities (Fig. 5E). There was no difference in APP immunoreactivity between TBITBI and TBI-Sham mice at 24 and 72 hours after the second injury/procedure (not shown). Therefore, although APP immunohistochemistry can detect injured axons in many contexts, it revealed only minor abnormalities following mild, repetitive closed-skull TBI in mice. This is consistent with previous findings (13, 17)
Figure 5.
Amyloid precursor protein (APP) immunohistochemistry demonstrated APP upregulation in cortex and subtle signs of axonal injury in 2 closed-skull impacts (TBI-TBI) mice 7 days after the first impact. (A-C) Ipsilateral cortex and external capsule. (D) Corpus callosum. E: Positive control for APP immunohistochemistry, pericontusional corpus callosum from a mouse that sustained controlled cortical impact (CCI) TBI (23). TBI = traumatic brain injury.
Silver Staining and Electron Microscopy
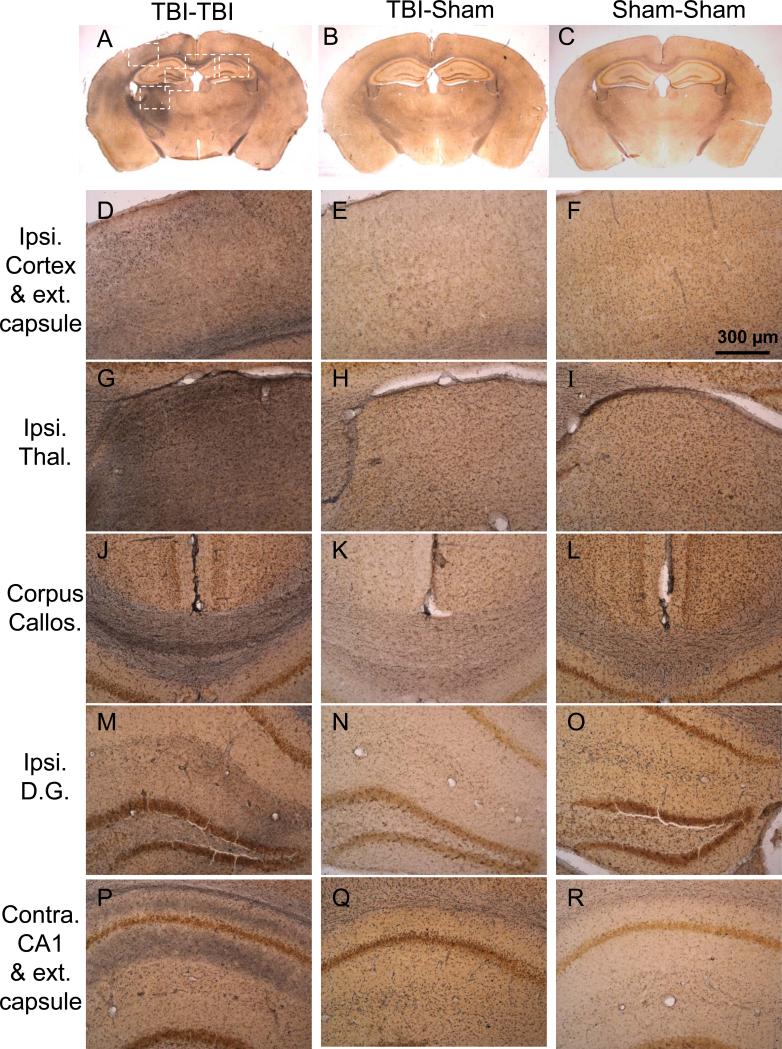
Silver staining revealed extensive abnormalities in the brains of TBI-TBI mice (Fig. 6). Specifically, at day 7 there was prominent argyrophilia in the ipsilateral superficial cortex underlying the impact site (Fig. 6A, D), ipsilateral thalamus (Fig. 6A, G), bilateral corpus callosum (Fig. 6A, J), and bilateral external capsule (Fig. 6A, D, P). Notable, but less consistent changes were observed in the ipsilateral dentate gyrus (Fig. 6A, M) and contralateral CA1 stratum oriens and stratum radiatum (Fig. 6A, P). Most of the argyrophilia was distributed in a pattern that suggested axonal and dendritic localizations but there were also some cortical neurons underlying the impact site with somatic silver staining as well (not shown).
Figure 6.
Silver staining reveals extensive, multifocal argyrophilic abnormalities in 2 closed-skull impacts (TBI-TBI) mice 7 days after the first impact (A, D, G, J, M, P) in comparison to TBI-Sham (B, E, H, K, M, Q), and Sham-Sham (C, F, I, L, O, R) mice. (A-C) Low-power views of coronal sections at approximately bregma –2.18 mm (24). White boxes indicate areas of interest, shown at higher magnification in lower panels. (D-F) Ipsilateral cortex and external capsule underlying the impact site. Silver staining is prominent in scattered cortical regions and the external capsule in TBI-TBI mice. (G-I) Ipsilateral thalamus. There is intense silver staining in the lateral and dorsolateral portions in TBI-TBI mice. (J-L) Corpus callosum. Prominent silver staining bilaterally in TBI-TBI mice. (M-O) Ipsilateral dentate gyrus. More subtle but clearly abnormal silver staining is seen in the neuropil in TBI-TBI mice. (P-R) Contralateral hippocampal CA1 and external capsule. There is more prominent silver staining in the external capsule, CA1 stratum oriens and stratum radiatum in TBI-TBI mice.
There were generally minimal argyrophilic abnormalities in the brains of TBI-Sham mice (Fig. 6B, E, H, K, N, Q), but a minority of these mice (2 of 8) had abnormalities that were similar to those in TBI-TBI mice. No abnormalities were seen in the brains of Sham-Sham mice (Fig. 6C, F, I, L, O, R).
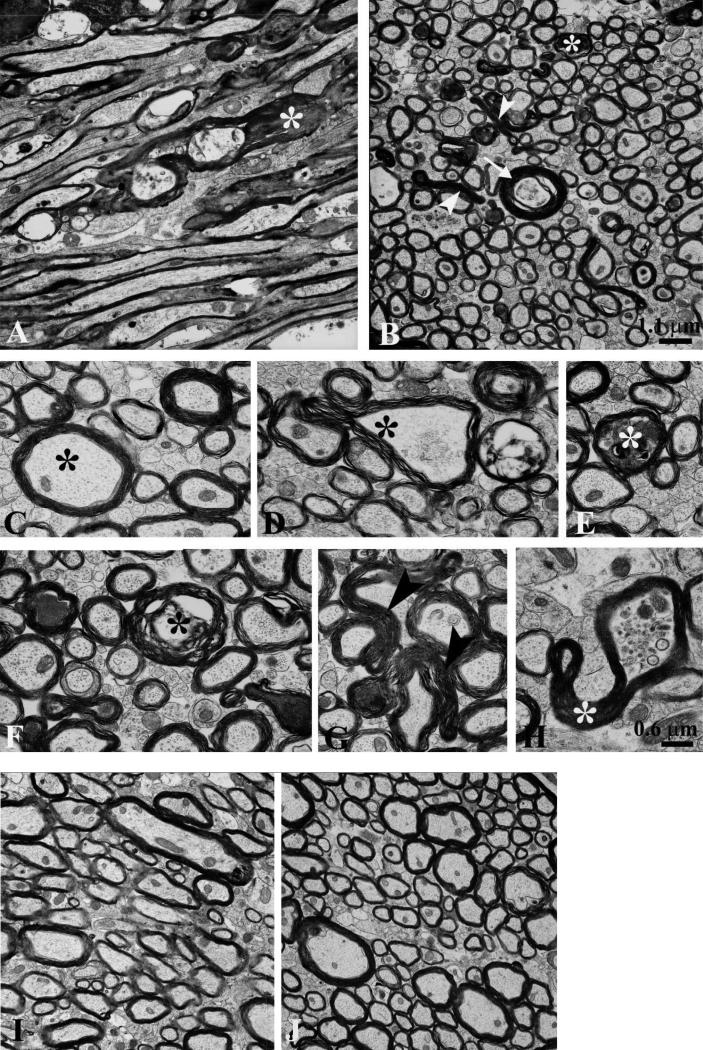
Electron microscopic examination of several brain regions identified based on abnormal silver staining revealed axonal pathology in the TBI-TBI mice (Fig. 7). Four mice were examined: 2 were killed at 4 days after the second impact and 2 were killed at day 7 after the second impact. There were consistent cytoskeletal abnormalities (Fig. 7A, B, D, F), axoplasmic collapse (Fig 7B, D, H), aggregation of intra-axoplasmic electron dense material (Fig. 7A, B, E, F, G), and organelle compaction (Fig. 7H) in myelinated axons in these mice. The dystrophic axons were scattered among many normal-appearing axons (Fig. 7A-H). Images from the ipsilateral cortex, external capsule, lateral geniculate nucleus of the thalamus, stria medullaris, and contralateral external capsule all showed similar abnormalities. We did not detect injury to unmyelinated axons, nor did we observe demyelination or microvascular pathologies. We observed very few massively dilated axons, consistent with the relatively subtle abnormalities found on APP immunohistochemistry. This contrasts with the ultrastructural findings in peri-contusional white matter following controlled cortical impact, characterized by massively dilated axons and secondary demyelination (22). We interpret these observations to indicate that repeated closed-skull TBI primarily causes a relatively isolated cytoskeletal disruption in large axons, which then leads to axoplasmic collapse and partial impairment of axonal transport.
Figure 7.
Electron microscopy reveals prominent axonal cytoskeletal injury in 2 closed-skull impacts (TBI-TBI) mice. Images from the ipsilateral external capsule 7 days after the second of 2 impacts. (A) In a section parallel to the predominant direction of axonal fibers individual myelinated axons are dilated and contained intra-axoplasmic electron dense material (*) with cytoskeletal disruption. Many preserved myelinated and unmyelinated axons are also present. (B) A transverse section shows dystrophic myelinated axons (*), axoplasmic collapse (arrowheads), and cytoskeletal disruption (arrow). (C) High magnification cross-sectional view of a normal myelinated axon with intact cytoskeleton (*). (D) Axon with partial axoplasmic collapse and cytoskeletal compaction (*). (E) Dystrophic myelinated axon with intra-axoplasmic abnormal electron dense material (*). (F) Multiple abnormal axons, including double concentric myelin sheaths (*) suggesting possible invagination. (G) Axoplasmic collapse across 2 myelinated axons (arrowheads). (H) Partial axoplasmic collapse (*) and abnormal accumulation of organelles. (I, J) No axonal cytoskeletal abnormalities in the external capsule of control mice prepared for electron microscopy 4 days after the second of 2 sham impacts. Scale bar (1.1 μm) in panel B also applies to panels A, I and J. Scale bar (0.6 μm) in panel H also applies to panels C–G.
Brains from 2 control animals killed 4 days after the second of 2 sham procedures that were prepared identically of electron microscopy revealed no abnormalities (Fig. 7I-J). Both large myelinated and small unmyelinated axons appeared normal with intact axoplasm and no cytoskeletal derangements. This indicates that the ultrastructural changes observed following 2 impacts were not likely to have been artifacts due to tissue preparation.
Microglial Activation in Regions with Injured Axons
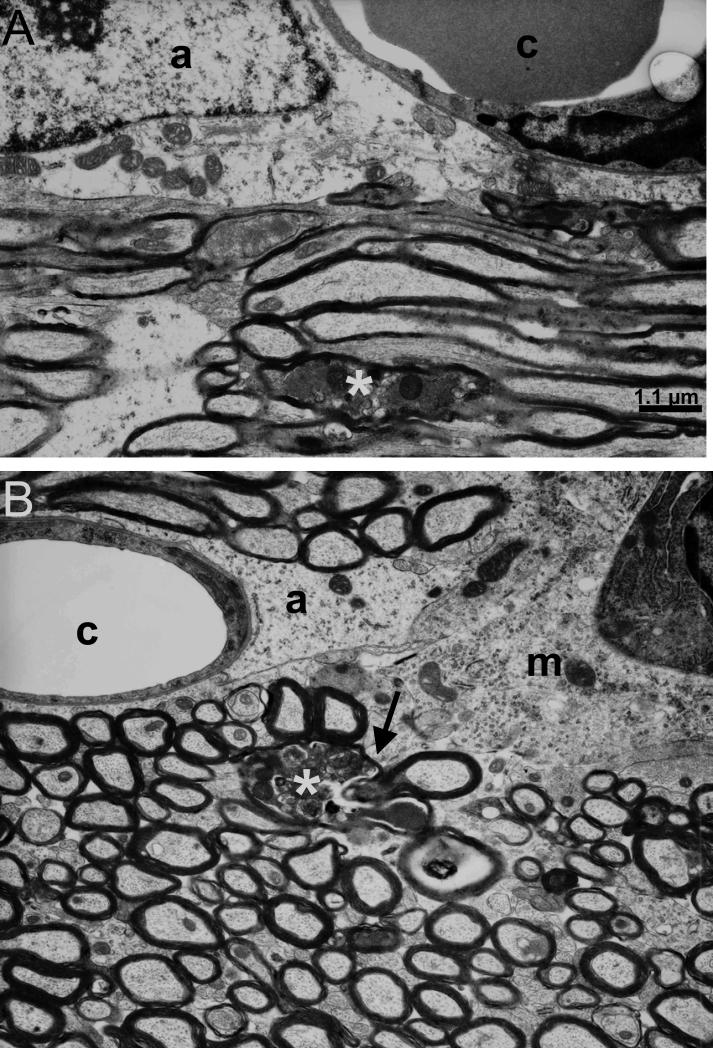
In all regions examined, cells with the ultrastructural characteristics of activated microglia were observed in close proximity to injured axons (Fig. 8). These cells were often located near capillaries and had dense heterochromatin near the nuclear envelope, granular cytoplasm, and extended cytoplasmic processes. In some cases these cytoplasmic processes were in direct contact with dystrophic axons, suggesting that they are a microglial response to axonal injury (Fig. 8B).
Figure 8.
Electron microscopy demonstrates the glial response at 7 days after the second of 2 impacts. (A) Astrocyte (a) near a brain capillary (c) in the injured ipsilateral external capsule with dystrophic axons (*). (B) Microglial cell (m) with cytoplasmic process (arrow) contacting a dystrophic axon (*). Note also the normal-appearing astrocyte (a) near a brain capillary (c). Scale bar (1.1 μm) in panel A also applies to panel B.
Iba1 immunohistochemistry was performed on sections adjacent to those used for silver staining in several brain regions. There were marked increases in Iba1-immunoreactivity after 2 impacts in the same regions with abnormalities on silver staining (Fig. 9A). The TBI-Sham and Sham-Sham mice had less Iba1 immunoreactivity (Fig. 9B, C).
Figure 9.
Iba1 immunohistochemistry indicates multifocal microglial activation following 2 closed-skull impacts (TBI-TBI). (A) Iba1 immunoreactivity in a TBI-TBI mouse 7 days after the first impact is extensive in the ipsilateral cortex, hippocampus, and thalamus, the corpus callosum and the contralateral hippocampus. (B, C) There is markedly less prominent Iba1 immunoreactivity in TBI-Sham and Sham-Sham mice.
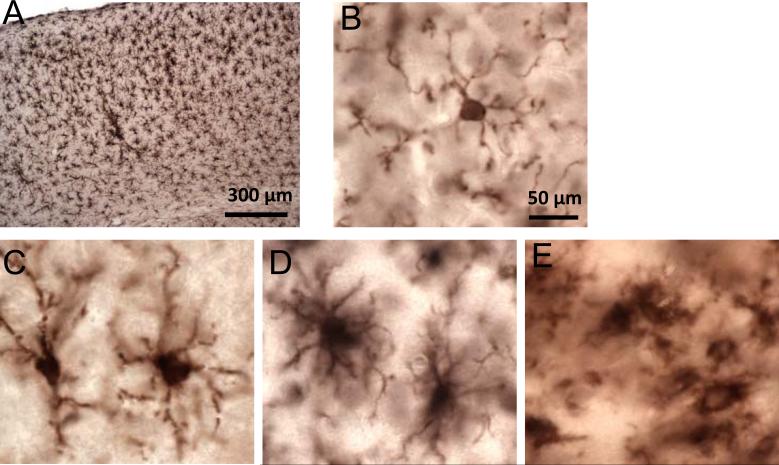
After 2 impacts, the Iba1-immunoreactive cells often had the characteristic uniform distribution (Fig. 10A) and morphologies (Fig. 10C-E) of activated microglia, including hypertrophic (Fig. 10C), bushy (Fig. 10D) and amoeboid (Fig. 10E) appearances with thick, densely labeled processes and large cell bodies. Iba1-immunoreactive cells with resting microglial morphologies (i.e. thin, highly ramified processes and a small cell body, Fig. 10B) were seen in all experimental groups, independent of injury.
Figure 10.
High-power views of the distribution and morphology of Iba1-immunoreactive cells following 2 closed-skull impacts (TBI-TBI). (A) There are uniformly distributed Iba1-positive microglia in the ipsilateral cortex at 7 days after the first of 2 impacts. (B) Ramified morphology (resting) morphology. (C) Hypertrophic morphology (activated). (D) Bushy morphology (activated). (E) Ameboid morphology (activated). Scale bar (50 = μm) in panel B applies also to panels C-E.
Quantitative Analysis of the Time Course of Silver Staining Abnormalities and Iba1-Immunoreactive Activated Microglial Cell Counts
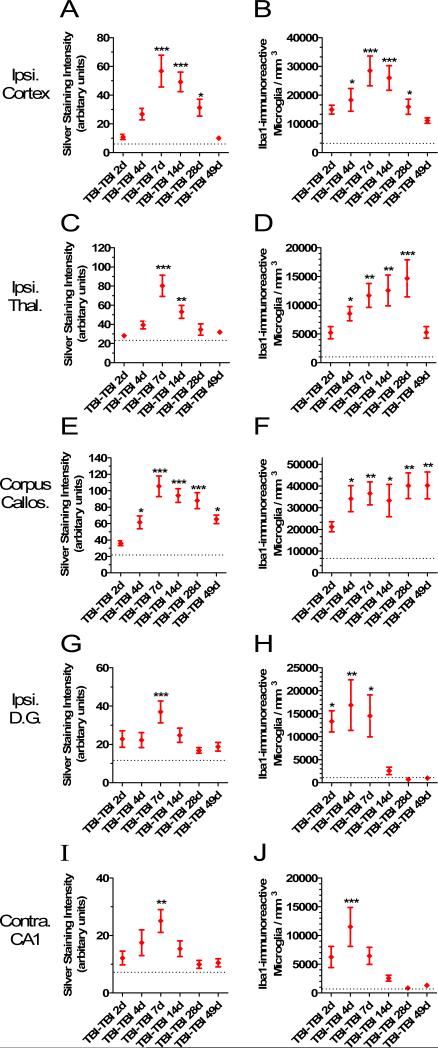
We next explored the relationship between the silver staining abnormalities and the Iba1-immunoreactive activated microglia. To do this we killed separate groups of 5 to 8 mice at 2, 4, 7, 14, 28 and 49 days after repetitive closed-skull injury. We assessed adjacent sections from the same mice with silver staining and Iba1 immunohistochemistry. Densitometric methods were used to quantify the extent of silver staining. This revealed that the silver staining abnormalities were most prominent and persistent in the corpus callosum, with high levels of staining as late as 49 days after injury (Fig. 11E). The staining was statistically significantly elevated in the corpus callosum at 4, 7, 14, 28 and 49 days. At peak, the silver staining was 5-fold greater than that in Sham-Sham mice. The silver staining was more transient in the ipsilateral cortex (Fig. 11A), ipsilateral thalamus (Fig. 11C), ipsilateral dentate gyrus (Fig. 11G) and contralateral hippocampal CA1 (Fig. 11I), with nearly complete resolution by 28 to 49 days after injury. In all regions examined, densitometric analysis demonstrated statistically significant increases in silver staining above control at 7 days.
Figure 11.
Quantitative analysis of silver staining intensity and Iba1-immunoreactive activated microglial cell counts. Separate groups of 5 to 8 mice were killed at each time point. Silver staining was quantified using densitometric analysis (arbitrary units: range 0-255); Iba1-positive cells with activated microglial morphology were counted using stereological methods. Dashed lines indicated levels in Sham-Sham mice. (A, B) Ipsilateral cortex. (C, D) Ipsilateral thalamus. (E, F) Corpus callosum. (G, H) Ipsilateral dentate gyrus. (I, J) Contralateral hippocampal stratum oriens and stratum radiatum (*p < 0.05, **p < 0.005, ***p < 0.0005, Dunnett's post-hoc test compared to Sham-Sham levels).
The time course of microglial activation was compared to that of the silver staining. Stereological methods were used to quantify the numbers of Iba1-immunoreactive microglia with activated morphologies in each region of interest at the same time points. Iba1-immunoreactive microglial activation was persistent as late as 49 days in the corpus callosum (Fig. 11F). The microglial activation in the corpus callosum was detectible as early as 2 days, statistically significant by 4 days, and undiminished out to 49 days at approximately 5- to 6-fold higher than control levels (Fig. 11F, p = 0.008 to 0.0007, 1 way ANOVA followed by Dunnett's post-hoc test). Thus, the time course of microglial activation was similar to that of silver staining abnormalities in the corpus callosum (Fig. 11E vs. F).
Microglial activation was more transient in the gray matter regions (Fig. 11B, D, H, J). Increases in Iba1-immunoreactive activated microglia were detectible as early as 2 days and were statistically significant in all regions examined by 4 days (Fig. 11B, D, H, J). The peak of the microglial response occurred at 7 days in the cortex (Fig. 11B), 28 days in the thalamus (Fig. 11D), and 4 days in the hippocampus (Fig. 11H, J). In the cortex, the peak was more than 8-fold higher than in control mice (p = 0.00005, Fig. 11B). In the contralateral hippocampal CA1 there was a sharp spike as evidenced by an 18-fold elevation at 4 days (p = 0.0002, Fig. 11J). In the thalamus, the delayed rise reached a 15-fold increase (p = 0.0001, Fig. 11D). In the ipsilateral dentate gyrus, the elevations ranged from 13- to 17-fold (p = 0.02 to 0.003, Fig. 11H). By 49 days after injury, the numbers of Iba1-immunoreactive activated microglia were not statistically different from control in any of the gray matter regions. At day 2 to day 7 after injury, Iba1-immunoreactive activated microglia in the cortex were typically uniformly distributed. However, at 14 to 49 days after injury the activated microglia tended to be clustered together in cortical layers 2 and 5 (not shown). Thus, in the gray matter regions examined, microglial activation became statistically significant at earlier times than silver staining abnormalities (Fig. 11A vs. B, C vs. D, G vs. H, I vs. J).
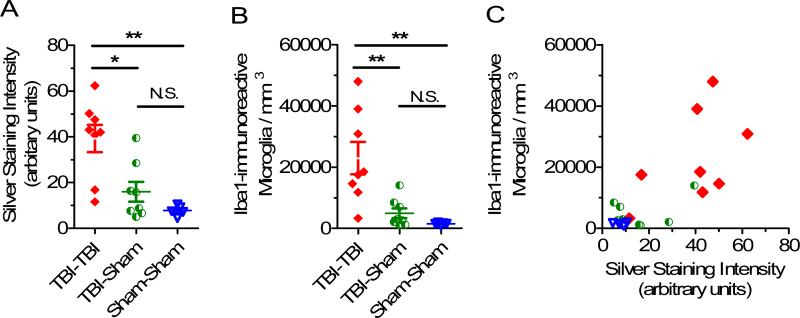
There were both greater silver staining (Fig. 12A) and more Iba1-immunoreactive activated microglia (Fig. 12B) in the TBI-TBI mice than in TBI-Sham and Sham-Sham mice. The distributions of data sets passed Shapiro-Wilk normality tests; therefore, parametric statistics were performed for primary analyses but the results were not substantially changed when non-parametric Mann-Whitney U-tests were performed. There was a moderately strong positive correlation between the extent of silver staining and the number of Iba1-immunoreactive activated microglia in individual mice. Across all 3 experimental groups the mice with more extensive silver staining also had more numerous Iba1-immunoreactive activated microglia (Fig. 12C, Spearman r = 0.64, p = 0.0018). Taken together, these findings indicate that the silver staining and microglial reactivity were closely related but not completely parallel processes.
Figure 12.
Relationship between silver staining intensity and Iba1 immunoreactive, activated microglial cell counts. (A) Silver staining intensity in ipsilateral cortex 7 days after 2 closed-skull impacts (TBI-TBI), traumatic brain injury (TBI) -Sham or Sham-Sham procedures. (*p = 0.007, **p = 0.0019, unpaired 2-sided t-tests) (B) Iba1 immunoreactive, activated microglial cell counts in the same ipsilateral cortical region from the same mice (*p = 0.006, **p = 0.0013, unpaired 2-sided t-tests). (C) Quantitative correlation between silver staining intensity and Iba1-immunoreactive, activated microglial cell counts. Scatter plot of silver staining intensity vs. Iba1-immunoreactive activated microglia cell counts in ipsilateral cortex at 7 days. Each symbol represents one mouse. Spearman r = 0.64, p = 0.0018.
Recovery of Behavioral Performance at 7 Weeks in TBI-TBI Mice
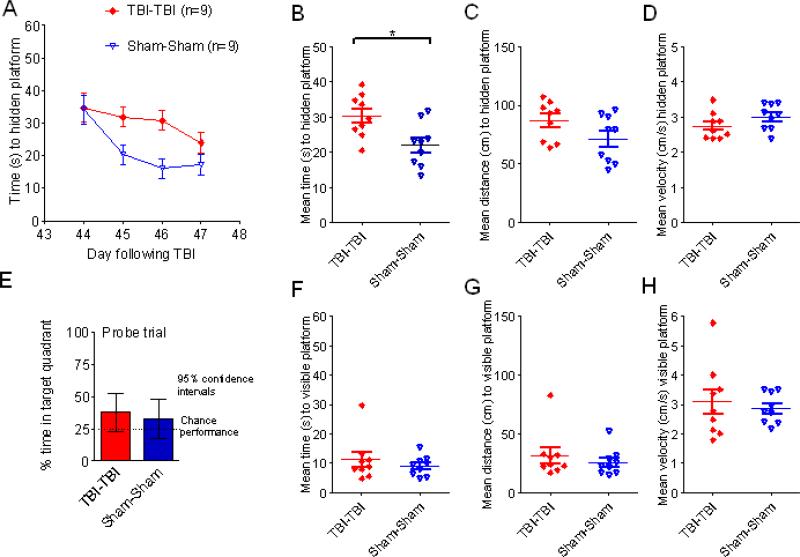
Morris water maze performance had improved but did not completely return to normal at 7 weeks in the mice subjected to 2 impacts (Fig. 13). Specifically, mean time to reach the hidden platform was longer in the TBI-TBI vs. Sham-Sham mice (Fig. 13A, B, p = 0.01). In contrast, distance to the hidden platform (Fig. 13C, p = 0.08), swim speed (Fig. 13D), probe trial performance (Fig. 13E), and visible platform performance (Fig. 13F-H) were not different between groups.
Figure 13.
Morris water maze performance at 7 weeks after either 2 closed-skull impacts (TBITBI) or 2 sham procedures (Sham-Sham). (A) Time to hidden platform as a function of day of training. (B) Mean time to hidden platform across all 4 days of hidden platform training (* p = 0.01). (C) Mean distance to hidden platform across all 4 days of hidden platform training (p = 0.08). (D) Mean swimming velocity across all 4 days of hidden platform training. (E) Probe trial. (F) Mean time to visible platform. (G) Mean distance to visible platform. (H) Mean swimming velocity to visible platform.
DISCUSSION
We found that repetitive closed-skull TBI in mice causes behavioral performance deficits, extensive argyrophilic abnormalities indicative of multifocal axonal injury, ultrastructural evidence of axonal injury, and reactive microgliosis. The use of silver staining, electron microscopy and immunohistochemistry for microglia revealed these abnormalities in brains that appeared largely uninjured on gross examination and by conventional histology. Even APP immunohistochemistry, which is felt to be a sensitive marker of traumatic axonal injury, revealed only subtle abnormalities in the TBI-TBI mice. This may be due to the fact that many of the injured axons were not extensively swollen and therefore not readily distinguishable at the light microscopic level. Our findings suggest that standard histological assessments may not be sufficiently sensitive to detect structural injuries following repetitive mild TBI. However, this study does not represent a comprehensive assessment of the differential sensitivity of the various methods for assessing structural brain injury. The persistence of abnormal silver staining and microglial activation in white matter as late as 7 weeks following TBI indicates that the effects of repetitive mild TBI can be long-lasting.
Several limitations of the current study should be noted. First, the injuries were produced by direct impact with the skull of anesthetized mice. In contrast, many human concussive injuries involve rotational acceleration of the head. Nonetheless, the fundamental responses of the brain to trauma may be similar. Injured axons with activated microglia in close proximity have been described in a pig rotational injury model with features consistent with concussive TBI (28). In a primate model involving controlled rotational acceleration, axonal injury and white matter microglial clusters were observed in more severe injuries, but not in those that caused “concussion,” defined as unconsciousness for <15 minutes (29). However, the effects of repeated injury were not assessed, nor were sensitive methods for the detection of axonal injury or microglial activation employed.
Second, we have not systematically assessed the effects of varying the interval between impacts. Longhi et al found that behavioral impairments were present with 3- and 5-day intervals but not a 7-day interval between impacts (17). The mechanisms underlying the period of vulnerability following a first impact are of great interest because interventions that shorten this period might improve outcomes in persons at high risk of recurrent injury such as military personnel and athletes. Biochemical and electron microscopic analysis of axonal integrity at early times following initial injury (30) represent an important area for future investigation.
Third, the full-time course of the behavioral deficits in this model has not been determined. It is also possible that a sham-TBI group could have shown impairments not seen in our TBI-sham control group. We observed partial normalization of behavioral performance by 7 weeks after 2 impacts. At this time point the abnormal silver staining and microglial activation in gray matter had largely resolved, whereas these abnormalities were persistent in the corpus callosum. These findings suggest, but do not prove, that both abnormalities in gray matter structures and white matter structure contribute to these behavioral deficits. To assess the consequences of the axonal injury and microglial activation in white matter, additional behavioral or electrophysiological assessments may be required (31). While white matter is a quantitatively small part of the mouse brain, it is a much larger fraction (nearly 50%) of the human brain. Human post-TBI cognitive performance may be particularly sensitive to traumatic axonal injury in major white matter tracts (32-37), thereby underscoring the potential relevance of the axonal injury and persistent microglial activation in white matter.
Finally, we have not fully investigated the possibility of subtle neuronal degeneration in this model. Longhi et al reported Fluoro-Jade-stained cells and loss of MAP2 immunoreactivity in a similar experimental model (17). Our preliminary data reveal similar findings (not shown). Indeed, the silver staining abnormalities and Iba1-immunoreactive microglia were present in gray as well as white matter structures.
The precise origins of the specific spatial distribution of silver staining and microglial activation we observed are not known. There may be primary regions of injury in which mechanical forces are highest, and secondary regions of injury in response to the primary injuries. The thalamic injury appeared to involve the lateral geniculate nucleus and ventroposterior nuclei, areas related to the primary visual cortex and somatosensory cortex, respectively. The primary visual cortex and somatosensory cortex, in turn, were directly beneath the impact site (24). Thus, the thalamic abnormalities could be a secondary response to cortical or subcortical white matter injury. Likewise, the abnormalities in the contralateral hippocampal stratum radiatum and stratum oriens may be related to the connections of this region to the injured ipsilateral dentate gyrus or entorhinal cortex. Alternatively, biomechanical vulnerability of these ipsilateral thalamic and contralateral hippocampal regions could underlie the pattern of abnormalities observed.
There are several possibilities regarding the relationship between the axonal injury and activated microglia. We favor the hypothesis that the Iba1-immunoreactive cells with activated microglial morphology represent a response to primary traumatic axonal injury. It is also possible that the axonal injury is secondary to toxic factors secreted by the activated microglia, or that both the axonal injury and activated microglia are responses to some additional unknown pathophysiological factor. These possibilities are not mutually exclusive. While the microglial activation became statistically significant before the silver staining abnormalities, the descriptions of time courses are not sufficient to resolve this issue. Direct experimental manipulations of microglial responses will be required to address these possibilities.
The prominent and persistent microglial activation following repetitive closed-skull TBI may lead to advances in diagnostic strategies. For example, PET or SPECT ligands that bind to activated microglia may be useful to assess immunological response to brain injury in a noninvasive fashion. The 5- to 18-fold increases in microglial activation suggests that high signal-to-noise should be achievable with this approach. Microglial-targeted ligands such as [11C] DAA1106, [11C] PK11195, [18F] FEPPA, or others (38) could be tested in the setting of concussive TBI. While microglial responses in isolation are unlikely to be specific for TBI, their spatial distribution and time course in relation to the clinical history might be useful for diagnostic and prognostic purposes.
On the therapeutic front, modulation of microglial activation or specific microglial signaling could be tested following experimental TBI. However, it is not known whether persistent microglial activation is beneficial, harmful, or neutral on the whole in this context. We recognize that morphological evidence of microglial activation may fail to account for functional differences among subsets of microglia (39). Pharmacological and genetic manipulations of specific aspects of microglial signaling (40) after repetitive closed-skull TBI will be required to address this issue and identify targets for candidate therapeutics. It is unlikely that global immune suppression will be a net benefit (41). However, microglial inhibition with minocycline has been shown to improve outcomes in several experimental injury models (42, 43).
Microglial activation and traumatic axonal injury have previously been described in relatively mild ‘concussive’ human TBI with death from other causes. Multifocal clusters of reactive microglia were found in a case of concussion with 13-day survival (44). These were present in the white matter, thalamus, and brainstem. Likewise, APP immunohistochemical evidence for axonal injury has been reported in several cases of mild TBI (45, 46). Our findings using more sensitive methods raise the intriguing hypothesis that axonal injury and microglial activation may be much more widespread and intense than previously believed. Other experimental animal studies using sensitive silver staining support this possibility (47-49). Further characterization of human pathological material from patients who have sustained both single and repetitive concussive brain injuries using the sensitive methods described here may help to address this hypothesis. The axonal pathology and sustained activation of microglia for many days to weeks after injury might underlie some of the persistent symptoms (e.g. fatigue, cognitive impairment, mood instability) that follow mild brain injuries in a subset of patients. Future investigations into the role of gender, age, genetic factors such as ApoE, and post-TBI care will be of great interest.
ACKNOWLEDGMENTS
We would like to thank L. Longhi for providing an original closed-skull TBI impact tip, P. Bayly for performing spring constant measurements, C. Mac Donald for providing brain sections from mice with controlled cortical impact TBI, D. Holtzman for allowing use of the stereology system, and J. Olney for allowing use of his EM sample preparation equipment. We appreciate valuable discussions with T.J. Esparza, C. Mac Donald, T. Malone, K. Schwetye, and J. Willie.
Support: Burroughs Wellcome Fund, NIH K08 NS049237 and R01 NS065069. Yoshitsugu Shitaka's effort was supported by Astellas Pharma Inc. while he was a visiting scientist.
Footnotes
Publisher's Disclaimer: This is a PDF file of an unedited manuscript that has been accepted for publication. As a service to our customers we are providing this early version of the manuscript. The manuscript will undergo copyediting, typesetting, and review of the resulting proof before it is published in its final citable form. Please note that during the production process errors may be discovered which could affect the content, and all legal disclaimers that apply to the journal pertain.
REFERENCES
- 1.Thurman DJ, Alverson C, Dunn KA, et al. Traumatic brain injury in the United States: A public health perspective. J Head Trauma Rehab. 1999;14:602–15. doi: 10.1097/00001199-199912000-00009. [DOI] [PubMed] [Google Scholar]
- 2.Langlois JA, Rutland-Brown W, Wald MM. The epidemiology and impact of traumatic brain injury: a brief overview. J Head Trauma Rehabil. 2006;21:375–8. doi: 10.1097/00001199-200609000-00001. [DOI] [PubMed] [Google Scholar]
- 3.Faul M, L X, Wald MM, et al. Traumatic brain injury in the United States: emergency department visits, hospitalizations, and deaths. Centers for Disease Control and Prevention, National Center for Injury Prevention and Control; Atlanta, GA: 2010. [Google Scholar]
- 4.Belanger HG, Spiegel E, Vanderploeg RD. Neuropsychological performance following a history of multiple self-reported concussions: a meta-analysis. J Int Neuropsychol Soc. 2010;16:262–7. doi: 10.1017/S1355617709991287. [DOI] [PubMed] [Google Scholar]
- 5.Guskiewicz KM, McCrea M, Marshall SW, et al. Cumulative effects associated with recurrent concussion in collegiate football players: the NCAA Concussion Study. JAMA. 2003;290:2549–55. doi: 10.1001/jama.290.19.2549. [DOI] [PubMed] [Google Scholar]
- 6.DeKosky ST, Ikonomovic MD, Gandy S. Traumatic brain injury--football, warfare, and long-term effects. N Engl J Med. 2010;363:1293–6. doi: 10.1056/NEJMp1007051. [DOI] [PubMed] [Google Scholar]
- 7.Jordan BD. Chronic traumatic brain injury associated with boxing. Seminars in Neurology. 2000;20:179–85. doi: 10.1055/s-2000-9826. [DOI] [PubMed] [Google Scholar]
- 8.Jordan BD, Relkin NR, Ravdin LD, et al. Apolipoprotein E epsilon4 associated with chronic traumatic brain injury in boxing. JAMA. 1997;278:136–40. [PubMed] [Google Scholar]
- 9.McKee AC, Cantu RC, Nowinski CJ, et al. Chronic traumatic encephalopathy in athletes: progressive tauopathy after repetitive head injury. J Neuropathol Exp Neurol. 2009;68:709–35. doi: 10.1097/NEN.0b013e3181a9d503. [DOI] [PMC free article] [PubMed] [Google Scholar]
- 10.Ling G, Bandak F, Armonda R, et al. Explosive blast neurotrauma. J Neurotrauma. 2009;26:815–25. doi: 10.1089/neu.2007.0484. [DOI] [PubMed] [Google Scholar]
- 11.Galarneau MR, Woodruff SI, Dye JL, et al. Traumatic brain injury during Operation Iraqi Freedom: findings from the United States Navy-Marine Corps Combat Trauma Registry. J Neurosurg. 2008;108:950–7. doi: 10.3171/JNS/2008/108/5/0950. [DOI] [PubMed] [Google Scholar]
- 12.Kanayama G, Takeda M, Niigawa H, et al. The effects of repetitive mild brain injury on cytoskeletal protein and behavior. Methods and findings in experimental and clinical pharmacology. 1996;18:105–15. [PubMed] [Google Scholar]
- 13.Laurer HL, Bareyre FM, Lee VM, et al. Mild head injury increasing the brain's vulnerability to a second concussive impact. J Neurosurg. 2001;95:859–70. doi: 10.3171/jns.2001.95.5.0859. [DOI] [PubMed] [Google Scholar]
- 14.DeFord SM, Wilson MS, Rice AC, et al. Repeated mild brain injuries result in cognitive impairment in B6C3F1 mice. J Neurotrauma. 2002;19:427–38. doi: 10.1089/08977150252932389. [DOI] [PubMed] [Google Scholar]
- 15.Uryu K, Laurer H, McIntosh T, et al. Repetitive mild brain trauma accelerates Abeta deposition, lipid peroxidation, and cognitive impairment in a transgenic mouse model of Alzheimer amyloidosis. J Neurosci. 2002;22:446–54. doi: 10.1523/JNEUROSCI.22-02-00446.2002. [DOI] [PMC free article] [PubMed] [Google Scholar]
- 16.Conte V, Uryu K, Fujimoto S, et al. Vitamin E reduces amyloidosis and improves cognitive function in Tg2576 mice following repetitive concussive brain injury. J Neurochem. 2004;90:758–64. doi: 10.1111/j.1471-4159.2004.02560.x. [DOI] [PubMed] [Google Scholar]
- 17.Longhi L, Saatman KE, Fujimoto S, et al. Temporal window of vulnerability to repetitive experimental concussive brain injury. Neurosurgery. 2005;56:364–74. doi: 10.1227/01.neu.0000149008.73513.44. [DOI] [PubMed] [Google Scholar]
- 18.Creeley CE, Wozniak DF, Bayly PV, et al. Multiple episodes of mild traumatic brain injury result in impaired cognitive performance in mice. Acad Emerg Med. 2004;11:809–19. doi: 10.1111/j.1553-2712.2004.tb00761.x. [DOI] [PubMed] [Google Scholar]
- 19.Niogi SN, Mukherjee P. Diffusion tensor imaging of mild traumatic brain injury. J Head Trauma Rehabil. 2010;25:241–55. doi: 10.1097/HTR.0b013e3181e52c2a. [DOI] [PubMed] [Google Scholar]
- 20.Cubon VA, Putukian M, Boyer C, et al. A Diffusion Tensor Imaging Study on the White Matter Skeleton in Individuals with Sports-Related Concussion. J Neurotrauma. 2011 doi: 10.1089/neu.2010.1430. [DOI] [PMC free article] [PubMed] [Google Scholar]
- 21.Brody DL, Mac Donald C, Kessens CC, et al. Electromagnetic controlled cortical impact device for precise, graded experimental traumatic brain injury. J Neurotrauma. 2007;24:657–73. doi: 10.1089/neu.2006.0011. [DOI] [PMC free article] [PubMed] [Google Scholar]
- 22.Mac Donald CL, Dikranian K, Bayly P, et al. Diffusion tensor imaging reliably detects experimental traumatic axonal injury and indicates approximate time of injury. J Neurosci. 2007;27:11869–76. doi: 10.1523/JNEUROSCI.3647-07.2007. [DOI] [PMC free article] [PubMed] [Google Scholar]
- 23.Mac Donald CL, Dikranian K, Song SK, et al. Detection of traumatic axonal injury with diffusion tensor imaging in a mouse model of traumatic brain injury. Exp Neurol. 2007;205:116–31. doi: 10.1016/j.expneurol.2007.01.035. [DOI] [PMC free article] [PubMed] [Google Scholar]
- 24.Franklin KBJ, Paxinos G. The mouse brain in stereotaxic coordinates. 2nd edition Elsevier/Academic Press; San Diego; London: 2001. [Google Scholar]
- 25.Muller GJ, Moller A, Johansen FF. Stereological cell counts of GABAergic neurons in rat dentate hilus following transient cerebral ischemia. Experimental brain research Experimentelle Hirnforschung. 2001;141:380–8. doi: 10.1007/s002210100879. [DOI] [PubMed] [Google Scholar]
- 26.Crawley JN. What's wrong with my mouse? Chapter 6, Learning and Memory. Wiley-Liss; New York: 2000. [Google Scholar]
- 27.Shapiro LA, Perez ZD, Foresti ML, et al. Morphological and ultrastructural features of Iba1-immunolabeled microglial cells in the hippocampal dentate gyrus. Brain Res. 2009;1266:29–36. doi: 10.1016/j.brainres.2009.02.031. [DOI] [PMC free article] [PubMed] [Google Scholar]
- 28.Chen XH, Siman R, Iwata A, et al. Long-term accumulation of amyloid-beta, beta-secretase, presenilin-1, and caspase-3 in damaged axons following brain trauma. Am J Pathol. 2004;165:357–71. doi: 10.1016/s0002-9440(10)63303-2. [DOI] [PMC free article] [PubMed] [Google Scholar]
- 29.Gennarelli TA, Thibault LE, Adams JH, et al. Diffuse axonal injury and traumatic coma in the primate. Ann Neurol. 1982;12:564–74. doi: 10.1002/ana.410120611. [DOI] [PubMed] [Google Scholar]
- 30.Tang-Schomer MD, Patel AR, Baas PW, et al. Mechanical breaking of microtubules in axons during dynamic stretch injury underlies delayed elasticity, microtubule disassembly, and axon degeneration. FASEB J. 2009 doi: 10.1096/fj.09-142844. [DOI] [PMC free article] [PubMed] [Google Scholar]
- 31.Reeves TM, Phillips LL, Povlishock JT. Myelinated and unmyelinated axons of the corpus callosum differ in vulnerability and functional recovery following traumatic brain injury. Exp Neurol. 2005;196:126–37. doi: 10.1016/j.expneurol.2005.07.014. [DOI] [PubMed] [Google Scholar]
- 32.Van Boven RW, Harrington GS, Hackney DB, et al. Advances in neuroimaging of traumatic brain injury and posttraumatic stress disorder. J Rehabil Res Dev. 2009;46:717–57. doi: 10.1682/jrrd.2008.12.0161. [DOI] [PMC free article] [PubMed] [Google Scholar]
- 33.Niogi SN, Mukherjee P, Ghajar J, et al. Extent of microstructural white matter injury in postconcussive syndrome correlates with impaired cognitive reaction time: a 3T diffusion tensor imaging study of mild traumatic brain injury. AJNR Am J Neuroradiol. 2008;29:967–73. doi: 10.3174/ajnr.A0970. [DOI] [PMC free article] [PubMed] [Google Scholar]
- 34.Niogi SN, Mukherjee P, Ghajar J, et al. Structural dissociation of attentional control and memory in adults with and without mild traumatic brain injury. Brain. 2008;131:3209–21. doi: 10.1093/brain/awn247. [DOI] [PubMed] [Google Scholar]
- 35.Kraus MF, Susmaras T, Caughlin BP, et al. White matter integrity and cognition in chronic traumatic brain injury: a diffusion tensor imaging study. Brain. 2007;130:2508–19. doi: 10.1093/brain/awm216. [DOI] [PubMed] [Google Scholar]
- 36.Perlbarg V, Puybasset L, Tollard E, et al. Relation between brain lesion location and clinical outcome in patients with severe traumatic brain injury: a diffusion tensor imaging study using voxel-based approaches. Human Brain Mapp. 2009;30:3924–33. doi: 10.1002/hbm.20817. [DOI] [PMC free article] [PubMed] [Google Scholar]
- 37.Lipton ML, Gulko E, Zimmerman ME, et al. Diffusion-tensor imaging implicates prefrontal axonal injury in executive function impairment following very mild traumatic brain injury. Radiology. 2009;252:816–24. doi: 10.1148/radiol.2523081584. [DOI] [PubMed] [Google Scholar]
- 38.Venneti S, Wiley CA, Kofler J. Imaging microglial activation during neuroinflammation and Alzheimer's disease. J Neuroimmune Pharmacol. 2009;4:227–43. doi: 10.1007/s11481-008-9142-2. [DOI] [PMC free article] [PubMed] [Google Scholar]
- 39.Perry VH, Nicoll JA, Holmes C. Microglia in neurodegenerative disease. Nat Rev Neurol. 2010;6:193–201. doi: 10.1038/nrneurol.2010.17. [DOI] [PubMed] [Google Scholar]
- 40.Kigerl KA, Gensel JC, Ankeny DP, et al. Identification of two distinct macrophage subsets with divergent effects causing either neurotoxicity or regeneration in the injured mouse spinal cord. J Neurosci. 2009;29:13435–44. doi: 10.1523/JNEUROSCI.3257-09.2009. [DOI] [PMC free article] [PubMed] [Google Scholar]
- 41.Edwards P, Arango M, Balica L, et al. Final results of MRC CRASH, a randomised placebo-controlled trial of intravenous corticosteroid in adults with head injury-outcomes at 6 months. Lancet. 2005;365:1957–9. doi: 10.1016/S0140-6736(05)66552-X. [DOI] [PubMed] [Google Scholar]
- 42.Kim HS, Suh YH. Minocycline and neurodegenerative diseases. Behav Brain Res. 2009;196:168–79. doi: 10.1016/j.bbr.2008.09.040. [DOI] [PubMed] [Google Scholar]
- 43.Homsi S, Piaggio T, Croci N, et al. Blockade of acute microglial activation by minocycline promotes neuroprotection and reduces locomotor hyperactivity after closed head injury in mice: a twelve-week follow-up study. J Neurotrauma. 2010;27:911–21. doi: 10.1089/neu.2009.1223. [DOI] [PubMed] [Google Scholar]
- 44.Oppenheimer DR. Microscopic lesions in the brain following head injury. J Neurol Neurosurg Psychiatry. 1968;31:299–306. doi: 10.1136/jnnp.31.4.299. [DOI] [PMC free article] [PubMed] [Google Scholar]
- 45.Blumbergs PC, Scott G, Manavis J, et al. Staining of amyloid precursor protein to study axonal damage in mild head injury. Lancet. 1994;344:1055–6. doi: 10.1016/s0140-6736(94)91712-4. [DOI] [PubMed] [Google Scholar]
- 46.Blumbergs PC, Scott G, Manavis J, et al. Topography of axonal injury as defined by amyloid precursor protein and the sector scoring method in mild and severe closed head injury. J Neurotrauma. 1995;12:565–72. doi: 10.1089/neu.1995.12.565. [DOI] [PubMed] [Google Scholar]
- 47.Hall ED, Sullivan PG, Gibson TR, et al. Spatial and temporal characteristics of neurodegeneration after controlled cortical impact in mice: more than a focal brain injury. J Neurotrauma. 2005;22:252–65. doi: 10.1089/neu.2005.22.252. [DOI] [PubMed] [Google Scholar]
- 48.Adelson PD, Jenkins LW, Hamilton RL, et al. Histopathologic response of the immature rat to diffuse traumatic brain injury. J Neurotrauma. 2001;18:967–76. doi: 10.1089/08977150152693674. [DOI] [PubMed] [Google Scholar]
- 49.Bauman RA, Ling G, Tong L, et al. An introductory characterization of a combat-casualty-care relevant swine model of closed head injury resulting from exposure to explosive blast. J Neurotrauma. 2009;26:841–60. doi: 10.1089/neu.2008.0898. [DOI] [PubMed] [Google Scholar]


