

Abstract
BACKGROUND
Metabolic acidosis is associated with skeletal muscle proteolysis, and alkali supplementation has demonstrated improvements in lean body mass and urinary nitrogen wasting in several studies. However, the association of acidosis with functional outcomes has not been examined on a population-based level.
STUDY DESIGN
Cross-sectional study.
SETTING & PARTICIPANTS
2,675 nationally representative adults 50 years of age and older in the National Health and Nutrition Examination Survey 1999 – 2002.
FACTOR
Serum bicarbonate level.
OUTCOMES
Low gait speed (gait speed) and low peak torque (peak torque) were defined as being in the lowest sex-specific quartile of gait speed and peak torque, respectively.
MEASUREMENTS
Serum bicarbonate was measured in all participants. gait speed was determined from a 20-foot timed walk. peak torque was calculated using peak isokinetic knee extensor force.
RESULTS
Serum bicarbonate <23 mEq/L was present in 22.7% of the cohort. Compared to participants with bicarbonate ≥23 mEq/L, those with bicarbonate <23 mEq/L had higher body-mass index and serum albumin, were more likely to have low socioeconomic status, a diagnosis of diabetes mellitus, or glomerular filtration rate <60 mL/min/1.73 m2, and were less likely to use diuretics. Serum bicarbonate <23 mEq/L, compared with ≥23 mEq/L, was associated with low gait speed (OR, 1.43; 95% confidence interval (CI), 1.04 – 1.95) and low peak torque (OR, 1.36; 95% CI, 1.07 – 1.74) after multivariable adjustment. The association with low peak torque was modified by race/ethnicity among women but not men (ORs of 1.52 (95% CI 1.08 – 2.13) for men, 2.33 (95% CI 1.23 – 4.44) for non- white women, and 0.93 (95% CI 0.47 – 1.82) for white women).
LIMITATIONS
Cross-sectional study using a single measurement of bicarbonate.
CONCLUSIONS
Lower serum bicarbonate levels are associated with slower gait speed and reduced quadriceps strength in older adults. Further studies should examine the effect of alkali therapy on functional outcomes.
Index words: metabolic acidosis, physical function, muscle strength
Persons with chronic kidney disease (CKD) have reduced exercise capacity and muscle strength.1–4 This is attributed in part to muscle protein wasting, which is induced by multiple factors. Among these, metabolic acidosis contributes to skeletal muscle proteolysis through several possible mechanisms including upregulation of the ubiquitin-proteasome system.5 Correction of acidosis in patients with CKD reduces muscle protein catabolism and improves lean body mass.5–10
While overt metabolic acidosis is relatively uncommon in the general population, a low-level metabolic acidosis related to the dietary acid load may have adverse sequelae.11, 12 As older age is associated with lower serum pH and bicarbonate levels, older persons may be more likely to develop low-level acidosis.13 Alkali supplementation in older persons without CKD or overt acidosis has demonstrated beneficial effects on nitrogen balance and skeletal metabolism,14–18 but effects on muscle strength and other functional outcomes have not been examined. We hypothesized that metabolic acidosis, determined by a low level of serum bicarbonate, would be associated with reduced muscle strength and gait speed in the general population. We tested these hypotheses by examining the associations of serum bicarbonate with gait speed and quadriceps muscle strength in adults 50 years of age and older in the National Health and Nutrition Examination Survey (NHANES) 1999 to 2002.
METHODS
Study Population
NHANES 1999 – 2002 was a nationally representative survey of the non-institutionalized civilian population in the United States. A stratified, multistage, probability sampling design was used. Overall, 3,960 adults 50 years of age or older completed the interview and examination components, including the 20-foot timed walk. We excluded participants with missing serum bicarbonate (n = 218); a history of emphysema or chronic bronchitis by self-report (n = 335); self-reported use of oral steroids (n = 54) or carbonic anhydrase inhibitors (n = 2) within the previous month; estimated glomerular filtration rate (eGFR) < 15 mL/min/1.73 m2 (n = 17); or missing covariate data (n = 657). Thus 2,675 participants were available for analysis. The Committee on Clinical Investigation at the Albert Einstein College of Medicine, Bronx, New York, determined this analysis to be exempt.
Data Collection
Information on household income, education, marital status, physical activity, smoking, alcohol consumption, comorbidities, and medication use in the previous month was obtained by self-report. Race/ethnicity was self-identified. Low socioeconomic status (SES) was defined as less than 100% of the poverty index. Participants were asked about the frequency and duration of walking or bicycling, home or yard work, and moderate or vigorous leisure time physical activity performed within the past 30 days. These responses were used to calculate metabolic equivalents (MET-min/wk) based on intensity values recommended by the National Center for Health Statistics.19 Activity level was classified as 0, <500, 500 – 2000, or >2000 MET-min/wk. An additional dichotomous variable was defined as positive if participants reported any physical activities in the past 30 days specifically designed to strengthen muscles. Smoking was classified as never, former, or current smoker. Average daily alcohol intake during the previous year was defined as never, fewer than 2 drinks per day, or 2 drinks or greater per day. Data on dietary intake were obtained from a 24-hour dietary recall questionnaire.
Hypertension was defined as a systolic blood pressure ≥140 mmHg, diastolic blood pressure ≥90 mmHg, self-report of a physician diagnosis, and/or antihypertensive medication use.20 A participant was considered to have diabetes mellitus if he or she reported a physician diagnosis while not pregnant or the current use of insulin or oral hypoglycemic medications. Cardiovascular disease (CVD) was defined by self-report of a physician diagnosis of congestive heart failure, coronary heart disease, angina, myocardial infarction, or stroke. A participant was classified as having arthritis if he or she reported a physician diagnosis of arthritis. Thyroid disease was defined by a physician diagnosis of a “thyroid problem,” “thyroid disease,” or “goiter,” and liver disease by physician diagnosis of a “liver condition.”
Serum chemistry values were measured using the Hitachi 917 multichannel analyzer (Roche Diagnostics, www.roche.com). Serum bicarbonate was measured via the phosphoenolpyruvate carboxylase method in two laboratories. The coefficient of variation ranged between 2.3 – 5.6%. Replicate bicarbonate measurements were available for 536 participants in 2001 – 2002, 133 of whom were also included in this study. The mean difference was 0.39 ± 2.1 mEq/L, and 419 of 536 (78.2%) replicate measurements were within 2 mEq/L of the initial serum bicarbonate level. Serum creatinine was measured by a modified kinetic Jaffé reaction. Values of serum creatinine from 1999 – 2000 were calibrated to the Cleveland Clinic laboratory standard by multiplying by 1.013 and then adding 0.147. Correction of serum creatinine values from 2001 – 2002 was not necessary. eGFR was calculated based on serum creatinine level using the Chronic Kidney Disease Epidemiology Collaboration (CKD-EPI) equation.21 As the ingestion of food may affect acid-base status and serum bicarbonate,22 the period of fasting prior to phlebotomy was categorized as greater than 2 hours or 2 hours or less.
Outcome Variables
The timed walk test consisted of a 20 foot (6.15 m) walk at the participant’s usual pace timed with a handheld stopwatch. Participants were excluded from the timed walk if they were unable to walk without the assistance of another person. Gait speed ( m/s) was calculated by dividing 6.15 m by the time in seconds. Isokinetic knee extensor strength was measured using a Kinetic Communicator isokinetic dynamometer (Kin Com MP, Chattecx Corporation, www.kincom.com). Maximal voluntary concentric muscle force of the right quadriceps muscle was assessed at an angular velocity of 60 degrees/second. Three practice trials and 3 test trials were performed. The highest peak force was recorded in Newtons (N) from trials 4 – 6. If fewer than 4 trials were performed, the highest peak force was recorded from the completed trials. Peak torque in Newton-meters (N-m) was calculated as the product of peak force and mechanical arm length in cm divided by 100, where mechanical arm length represented the distance from the ankle to the knee. Participants were excluded from the muscle strength component if they had a myocardial infarction in the previous 6 weeks (n = 6), chest or abdominal surgery in the previous 3 weeks (n = 10), a history of brain aneurysm or stroke (n = 123), right knee or hip replacement (n = 65), difficulty bending or straightening the right knee (n = 60), or reported severe neck or back pain (n = 62). An additional 225 participants were missing data for peak torque because of limited time for the examination, refusal, equipment or data capture failure, or other reasons. Complete data were available for peak torque for 2,127 participants.
Statistical Analysis
All analyses used NHANES-appropriate sampling weights and accounted for the complex multistage cluster design using the “survey” command in Stata version 10.0 (Stata Corp, www.stata.com). Serum bicarbonate was categorized as a dichotomous variable: <23 mEq/L or ≥23 mEq/L. The distributions of participant characteristics were examined by these serum bicarbonate categories. Low gait speed and low peak torque were defined as being in the lowest sex-specific quartile of each. Logistic regression models were created to examine the associations of serum bicarbonate as a continuous or dichotomous variable with low gait speed and low peak torque, respectively. Age, sex, race/ethnicity, body-mass index (BMI), activity level, and eGFR< 60 mL/min/1.73 m2 were included a priori in all models. Additional variables considered for inclusion in the models were fasting length prior to phlebotomy, SES, education (less than high school diploma versus high school graduate or above), marital status (married/living with a partner versus other), smoking, alcohol intake, muscle strengthening activities, dietary sodium intake, arthritis, diabetes mellitus, hypertension, CVD, thyroid disease, liver disease, diuretic use, use of cholesterol-lowering medications, log-transformed urine albumin-creatinine ratio, serum levels of albumin, calcium, potassium, and phosphate, and hemoglobin. A variable was included in the final model if it was associated with the outcome with a p-value ≤0.20 or demonstrated evidence as an important confounder based on a change in the point estimate for serum bicarbonate ≥10% when it was removed from the model. Sex-stratified models were examined for both low gait speed and low peak torque. Effect modification by sex, race/ethnicity, BMI, and activity level was tested by including multiplicative interaction terms in the models. A p-value ≤0.20 for the addition of the interaction terms to the model was considered suggestive of possible effect modification. As results for gait speed did not differ by sex, they are presented for men and women combined. A fully-adjusted restricted cubic spline model was created to explore the continuous, potentially non-linear, association of serum bicarbonate with low gait speed and low peak torque. We also explored these associations by creating categories of bicarbonate level based on clinically relevant cutpoints and by using a 2-slope linear model. All analyses were repeated using eGFR calculated with the 4-variable Modification of Diet in Renal Disease (MDRD) Study equation23 and were unchanged (data not shown). A p-value <0.05 was considered statistically significant.
Sensitivity Analyses
Because dietary protein intake and inflammation may mediate the association of acidosis with physical function, separate models were examined for both gait speed and peak torque in which dietary protein and log-transformed C-reactive protein (CRP) were added to the fully adjusted models. The associations of serum bicarbonate with gait speed and peak torque were also examined separately in participants with eGFR ≥60 mL/min/1.73 m2, in models stratified by eGFR 60–75 and >75 mL/min/1.73 m2, and in those who did not report diuretic use. In addition, because creatinine generation is proportional to muscle mass,24 creatinine-based eGFR estimates may partly mediate associations of serum bicarbonate with peak torque and gait speed by accounting for variations in muscle mass. We repeated our analyses with eGFR calculated using age, sex, race, and serum cystatin C, a marker that is not related to muscle.25 Appropriate sample weights were used to account for the smaller sample in which serum cystatin C levels were available. We also explored the association of serum bicarbonate with self-reported difficulty walking a quarter-mile or walking up 10 steps as outcomes, for which data were available for 1,954 and 1,951 participants within our cohort, respectively. Disability was defined as self-report of “much difficulty” or “unable to do” regarding either task. No correction for multiple testing was used.
RESULTS
Participant Characteristics
The mean serum bicarbonate was 24.1 (SE, 0.15) mEq/L. The weighted prevalence of serum bicarbonate <23 mEq/L was 22.7% (95% confidence interval (CI), 18.4% – 27.0%) in our cohort, compared with 22.4% (95% CI, 18.1 – 26.7%) of all NHANES participants 50 years of age or older from 1999 to 2002. Compared to participants with serum bicarbonate ≥23 mEq/L, those with bicarbonate levels <23 mEq/L had higher BMI, were more likely to have low SES, a diagnosis of diabetes mellitus, thyroid disease, or liver disease, and an eGFR <60 mL/min/1.73 m2, were less likely to use diuretics, and had higher serum albumin levels (Table 1). The participants who completed quadriceps strength testing were younger, had lower BMI, higher SES, reported greater activity levels, had fewer comorbidities, higher serum albumin and hemoglobin levels, lower CRP levels, and faster gait speed compared with those who did not complete this component (Table 2).
Table 1.
Participant Characteristics by Serum Bicarbonate Category
| Characteristic | Serum Bicarbonate (mEq/L) | P | |
|---|---|---|---|
| <23 | ≥23 | ||
| Number | 618 | 2057 | |
| Age (years) | 62.3 +/− 0.5 | 63.3 +/−0.3 | 0.08 |
| Women | 51.8 +/− 2.2 | 50.6 +/−0.9 | 0.7 |
| Race/Ethnicity | 0.2 | ||
| Non-Hispanic White | 80.0 +/− 3.6 | 81.3 +/−1.9 | |
| Mexican American | 5.0 +/− 1.6 | 3.0 +/−0.6 | |
| Non-Hispanic Black | 6.3 +/− 1.2 | 7.6 +/−1.2 | |
| Body-mass index (kg/m2) | 29.6 +/−0.4 | 28.2 +/−0.2 | <0.001 |
| Poverty* | 12.8 +/−1.9 | 8.8 +/−1.3 | 0.05 |
| Less than high-school diploma | 26.3 +/−1.9 | 22.4 +/−2.2 | 0.2 |
| Married or living with partner | 71.9 +/−2.9 | 70.8 +/−1.5 | 0.8 |
| Activity Level | 0.5 | ||
| 0 MET-min/wk | 22.7 +/−2.7 | 19.0 +/−2.0 | |
| < 500 MET-min/wk | 20.7 +/−2.1 | 19.5 +/−1.0 | |
| 500 – 2000 MET-min/wk | 29.6 +/−3.0 | 34.4 +/−1.2 | |
| > 2000 MET-min/wk | 27.0 +/−2.8 | 27.0 +/−1.8 | |
| Muscle strengthening activities | 16.3 +/−2.4 | 20.0 +/−2.1 | 0.2 |
| Smoking | 0.4 | ||
| Never | 43.2 +/− 3.8 | 47.2 +/−1.3 | |
| Former | 38.4 +/−3.0 | 38.0 +/−1.4 | |
| Current | 18.4 +/−2.5 | 14.8 +/−1.1 | |
| Alcohol intake | 0.1 | ||
| None | 46.1 +/−5.1 | 36.4 +/−2.5 | |
| < 2 drinks/day | 47.2 +/−4.5 | 56.2 +/−2.3 | |
| ≥ 2 drinks/day | 6.7 +/−0.9 | 7.4 +/−0.9 | |
| Dietary Protein (g/day) | 75.4 +/−1.6 | 75.0 +/−1.1 | 0.9 |
| Diuretic use | 14.7 +/−2.0 | 21.2 +/−1.5 | 0.007 |
| Hypertension | 63.9 +/−2.4 | 63.9 +/−1.3 | 0.9 |
| Diabetes Mellitus | 16.6 +/−2.0 | 10.7 +/−0.8 | 0.01 |
| Cardiovascular Disease | 18.7 +/−1.9 | 15.3 +/−1.0 | 0.08 |
| Thyroid Disease | 14.9 +/−1.7 | 11.5 +/−0.7 | 0.03 |
| Liver Disease | 5.7 +/−1.4 | 3.3 +/−0.6 | 0.05 |
| Arthritis | 43.8 +/−2.8 | 38.3 +/−1.6 | 0.1 |
| eGFR < 60 mL/min/1.73m2 | 18.1 +/−1.4 | 13.3 +/−1.0 | 0.002 |
| UACR ≥ 30 mg/g | 15.8 +/−1.5 | 13.1 +/−0.8 | 0.2 |
| Serum Albumin (g/dL) | 4.31 +/−0.02 | 4.27 +/−0.01 | 0.05 |
| Serum Calcium (mg/dL) | 9.4 +/−0.04 | 9.5 +/−0.02 | 0.2 |
| Hemoglobin (g/dL) | 14.5 +/−0.1 | 14.4 +/−0.04 | 0.7 |
| C-reactive protein ≥ 1.0 mg/dL | 13.2 +/−1.8 | 10.0 +/−0.9 | 0.07 |
Note: Conversion factors for units: albumin and hemoglobin in g/dL to g/L, ×10; calcium in mg/dL to mmol/L, ×0.25; C-reactive protein in mg/dL to mg/L, ×10; no conversion necessary for bicarbonate levels in mEq/L and mmol/L.
<100% poverty index
Abbreviations: MET, metabolic equivalent; eGFR, estimated glomerular filtration rate; UACR, urinary albumin-creatinine ratio.
Continuous data are expressed as mean +/− standard error and categorical data as percent +/− standard error.
Table 2.
Comparison of Participants by Muscle Strength Testing Status
| Characteristic | Completed Muscle Strength Testing |
P | |
|---|---|---|---|
| No | Yes | ||
| Number | 548 | 2127 | |
| Gait Speed | 0.90 +/− 0.02 | 1.09 +/− 0.01 | <0.001 |
| Age (years) | 67.2 +/− 0.6) | 62.2 +/− 0.2 | <0.001 |
| Women | 54.1 +/− 2.1 | 50.2 +/− 0.9 | 0.1 |
| Race/Ethnicity | 0.2 | ||
| Non-Hispanic White | 77.7 +/− 2.8 | 81.7 +/− 2.0 | |
| Mexican American | 4.0 +/− 1.0 | 3.3 +/− 0.7 | |
| Non-Hispanic Black | 8.9 +/− 1.4 | 6.9 +/− 1.1 | |
| Body-mass index (kg/m2) | 29.8 +/− 0.4 | 28.2 +/− 0.2 | <0.001 |
| Poverty* | 14.7 +/− 2.6 | 8.6 +/− 1.2 | 0.009 |
| Less than high-school diploma | 30.9 +/− 3.2 | 21.7 +/− 1.6 | <0.001 |
| Married or living with partner | 60.3 +/− 3.3 | 73.3 +/− 1.5 | 0.002 |
| Activity Level | <0.001 | ||
| 0 MET-min/wk | 32.8 +/− 2.8 | 17.1 +/− 1.7 | |
| < 500 MET-min/wk | 20.6 +/− 2.3 | 19.6 +/− 1.0 | |
| 500 – 2000 MET-min/wk | 25.8 +/− 2.5 | 34.9 +/− 1.4 | |
| > 2000 MET-min/wk | 20.8 +/− 2.9 | 28.3 +/− 1.7 | |
| Muscle strengthening activities | 12.7 +/− 2.2 | 20.5 +/− 2.0 | 0.002 |
| Smoking | 0.09 | ||
| Never | 45.4 +/− 2.5 | 46.5 +/− 1.6 | |
| Former | 36.0 +/− 2.4 | 38.6 +/− 1.5 | |
| Current | 18.6 +/− 1.8 | 15.0 +/− 1.1 | |
| Alcohol intake | <0.001 | ||
| None | 49.5 +/− 3.7 | 36.3 +/− 2.8 | |
| < 2 drinks/day | 46.8 +/− 3.6 | 55.7 +/− 2.5 | |
| ≥ 2 drinks/day | 3.7 +/− 1.0 | 8.0 +/− 0.9 | |
| Dietary Protein (g/day) | 71.2 +/− 1.7 | 75.9 +/− 0.9 | 0.02 |
| Diuretic use | 31.5 +/− 2.4 | 17.2 +/− 1.6 | <0.001 |
| Hypertension | 77.1 +/− 2.3 | 61.1 +/− 1.5 | <0.001 |
| Diabetes Mellitus | 20.6 +/− 2.3 | 10.2 +/− 0.6 | <0.001 |
| Cardiovascular Disease | 34.2 +/− 2.8 | 12.2 +/− 0.9 | <0.001 |
| Thyroid Disease | 14.2 +/− 1.9 | 11.9 +/− 0.9 | 0.3 |
| Liver Disease | 3.9 +/− 1.2 | 3.9 +/− 0.6 | 0.9 |
| Arthritis | 54.8 +/− 2.9 | 36.3 +/− 1.4 | <0.001 |
| Bicarbonate (mEq/L) | 23.9 +/− 0.2 | 24.1 +/− 0.1 | 0.3 |
| Bicarbonate <23 mEq/L | 26.2 +/− 0.03 |
22.0 +/− 0.02 |
0.09 |
| eGFR < 60 mL/min/1.73m2 | 24.3 +/− 2.5 | 12.4 +/− 0.9 | <0.001 |
| UACR ≥ 30 mg/g | 19.8 +/− 2.1 | 12.4 +/− 0.6 | 0.001 |
| Serum Albumin (g/dL) | 4.22 +/− 0.02 |
4.32 +/− 0.01 |
<0.001 |
| Serum Calcium (mg/dL) | 9.5 +/− 0.03 | 9.5 +/− 0.02 | 0.4 |
| Hemoglobin (g/dL) | 14.2 +/− 0.09 |
14.5 +/− 0.06 |
0.01 |
| C-reactive protein ≥ 1.0 mg/dL | 15.4 +/− 2.7 | 9.7 +/− 0.8 | 0.03 |
Note: N = 2,675. Conversion factors for units: albumin and hemoglobin in g/dL to g/L, ×10; calcium in mg/dL to mmol/L, ×0.25; C-reactive protein in mg/dL to mg/L, ×10; no conversion necessary for bicarbonate levels in mEq/L and mmol/L.
Abbreviations: MET, metabolic equivalent; eGFR, estimated glomerular filtration rate; UACR, urinary albumin-creatinine ratio.
Categorical data are expressed as percent +/− standard error; continuous data as mean +/− standard error.
<100% poverty index
Association of Serum Bicarbonate with Gait Speed
In unadjusted analysis, participants with serum bicarbonate < 23 mEq/L had a 42% greater odds of low gait speed compared with those with bicarbonate ≥23 mEq/L (Table 3). This association persisted after multivariable adjustment (odds ratio (OR), 1.43; 95% CI, 1.04 – 1.95). No evidence of effect modification of these associations was noted. This effect size is similar in magnitude to the odds of low gait speed associated with a 5-year increment in age (OR, 1.47; 95% CI, 1.36 – 1.58). Compared with participants with serum bicarbonate 25 – 26 mEq/L, the adjusted OR for low gait speed among those with levels ≤ 22, 23 – 24, and ≥ 27 mEq/L was 1.65 (1.17 – 2.32), 1.21 (0.95 – 1.55), and 1.36 (0.94 – 1.95), respectively. The continuous, fully adjusted, association of serum bicarbonate with low gait speed is represented graphically in Figure 1. Using the 2-slope linear model, the ORs (95% CI) for low gait speed per 1 mEq/L higher serum bicarbonate were 0.86 (0.74 – 0.99) for bicarbonate levels <23 mEq/L and 1.01 (0.92 – 1.12) for bicarbonate ≥23 mEq/L. The ORs for low gait speed in the 2-slope linear model were 0.91 (0.82 – 1.01), 0.91 (0.84 – 0.99), and 0.93 (0.86 – 1.00) for bicarbonate levels <24, <25, and <26 mEq/L, respectively, when using these levels as cutpoints.
Table 3.
Odds of Low Gait Speed and Low Peak Torque by Serum Bicarbonate Level
| Model 1 (unadjusted OR) |
aOR | ||
|---|---|---|---|
| Model 2 | Model 3 | ||
| Low Gait Speed* (n=2675) | |||
| Continuous (per 1 mEq/L bicarbonate) |
0.95 (0.90 – 1.01) | 0.93 (0.87 – 0.99) | 0.96 (0.90 – 1.03) |
| Bicarbonate < vs ≥23 mEq/L | 1.42 (1.07 – 1.89) | 1.67 (1.23 – 2.28) | 1.43 (1.04 – 1.95) |
| Low Peak Torque§ (n=2127) | |||
| Continuous (per 1 mEq/L bicarbonate) |
|||
| Overall | 0.98 (0.95 – 1.02) | 0.96 (0.92 – 1.01) | 0.96 (0.91 – 1.02) |
| White Women (n=563) | 1.05 (0.95 – 1.16) | 1.02 (0.92 – 1.13) | 1.02 (0.88 – 1.18) |
| Non-white women (n=447) | 0.86 (0.75 – 0.97) | 0.86 (0.75 – 1.00) | 0.88 (0.76 – 1.03) |
| Men (n=1117) | 0.96 (0.91 – 1.02) | 0.94 (0.89 – 1.00) | 0.94 (0.88 – 1.00) |
| Bicarbonate < vs ≥23 mEq/L | |||
| Overall | 1.18 (0.91 – 1.53) | 1.38 (1.05 – 1.82) | 1.36 (1.07 – 1.74) |
| White Women (n=563) | 0.84 (0.46 – 1.53) | 0.94 (0.51 – 1.73) | 0.93 (0.47 – 1.82) |
| Non-white women (n=447) | 2.35 (1.27 – 4.35) | 2.77 (1.45 – 5.26) | 2.33 (1.23 – 4.44) |
| Men (n=1117) | 1.30 (0.99 – 1.69) | 1.55 (1.17 – 2.05) | 1.52 (1.08 – 2.13) |
Values shown are OR (95% confidence interval). Model 1: unadjusted. Model 2: for low gait speed analysis, adjusted for age, sex, and race/ethnicity; for low peak torque analysis, adjusted for age, sex (for overall cohort), and race/ethnicity (for non-white women and men). Model 3: for low gait speed analysis, adjusted for variables in Model 2 and BMI, poverty, education, smoking, alcohol intake, activity level, performance of muscle strengthening activities, diuretic use by self-report, diagnosis of hypertension, arthritis by self-report, liver disease by self-report, eGFR <60 ml/min/1.73 m2, log-transformed urine albumin-creatinine ratio, serum albumin, serum calcium; for low peak torque, adjusted for variables in Model 2 and BMI, poverty, education, marital status, smoking, alcohol intake, activity level, diuretic use by self-report, diagnosis of hypertension, diagnosis of diabetes mellitus, cardiovascular disease by self-report, arthritis by self-report, thyroid disease by self-report, eGFR <60 ml/min/1.73 m2, log-transformed urine albumin-creatinine ratio, serum albumin, serum calcium, hemoglobin.
Abbreviations: OR, hazard ratio; aOR, adjusted odds ratio.
Defined as the lowest sex-specific quartile of gait speed.
Defined as the lowest sex-specific quartile of peak torque. P-value for interaction by race: among women, p=0.02; among men, p=0.5.
Figure 1.
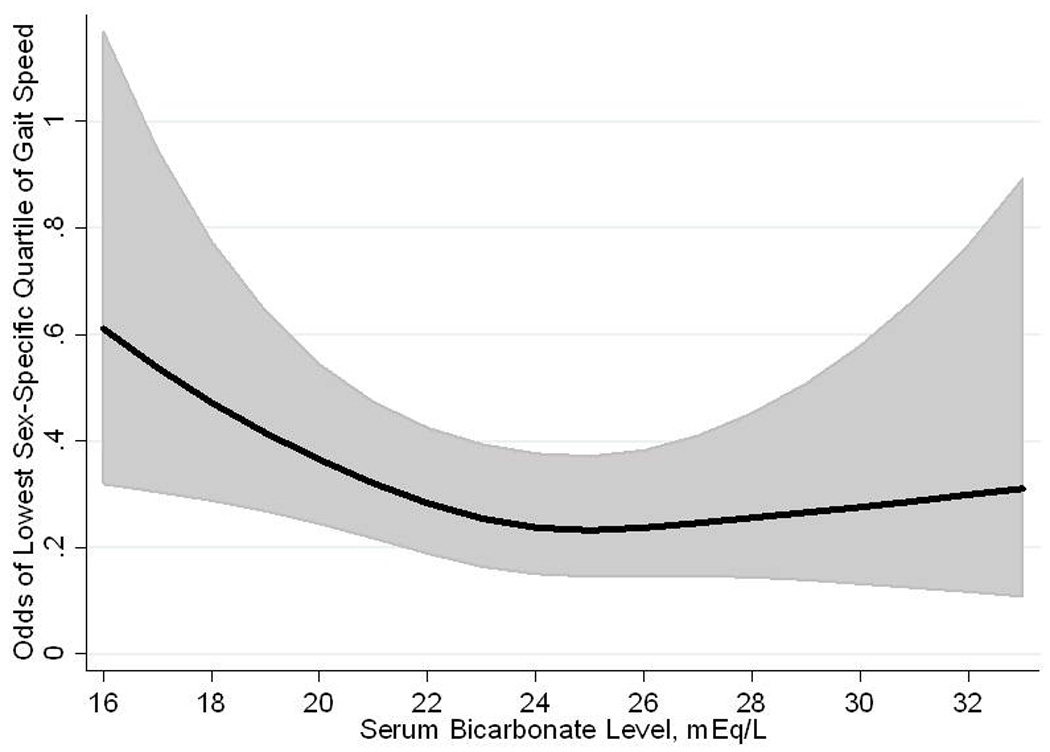
Restricted cubic spline showing the fully adjusted association of serum bicarbonate level with odds of low gait speed in 2,675 participants of the National Health and Nutrition Examination Survey 1999 – 2002.
Association of Serum Bicarbonate with Peak Torque
Compared to participants with serum bicarbonate levels ≥ 23 mEq/L, having a bicarbonate level < 23 mEq/L was associated with a greater likelihood of low peak torque in the fully adjusted model (OR, 1.36; 95% CI, 1.07 – 1.74) (Table 3). We noted evidence of effect modification by race among women (p for interaction by race, 0.02 among women and 0.5 among men). The association of serum bicarbonate with peak torque was then examined in models stratified by sex and race (white versus non-white). As the odds ratios for low peak torque among men did not differ by race, data are presented for all men combined. Serum bicarbonate < 23 mEq/L was associated with higher odds of low peak torque after multivariable adjustment among men and non- white women but not among white women (OR 1.52 (95% CI 1.08 – 2.13) for men (n=1117); 2.33 (95% CI 1.23 – 4.44) for non- white women (n=447); and 0.93 (95% CI 0.47 – 1.82) for white women (n=563)). The continuous, fully adjusted, association of serum bicarbonate with low peak torque is represented graphically in Figure 2
Figure 2.

Restricted cubic splines showing the fully adjusted association of serum bicarbonate level with odds of low peak torque in 2,127 participants of the National Health and Nutrition Examination Survey 1999 – 2002. (A) Full cohort; (B) 1,117 men; (C) 447 non-white women; (D) 563 white women.
Sensitivity Analyses
The inclusion of CRP and dietary protein in the model did not change our results (Table 4). Results did not differ among participants with eGFR ≥ 60 mL/min/1.73 m2 or those who did not report diuretic use, or using cystatin C-based eGFR (Table 4). Among participants with eGFR 60 – 75 and > 75 mL/min/1.73 m2, the adjusted OR was 1.97 (95% CI 1.10 – 3.51) and 1.74 (95% CI 1.20 – 2.52) for low gait speed, and 1.52 (95% CI 0.69 – 3.32) and 1.74 (95% CI 1.15 – 2.64) for low peak torque, respectively, for participants with serum bicarbonate <23 mEq/L compared with ≥23 mEq/L. We further explored the effect modification found with low peak torque by separately entering estrogen use and 25-hydroxyvitamin D (25(OH)D) levels into the fully adjusted model, as each may differ by race and is associated with musculoskeletal function.26, 27 Accounting for estrogen use did not change the results (for serum bicarbonate below vs at or above the 23 mEq/L cutoff, OR for low peak torque was 0.92 (95% CI 0.46 – 1.84) for white women and 2.35 (95% CI, 1.23 – 4.49) for non-white women). 25(OH)D levels were only available in the years 2001 – 2002. Thus, odds ratios for low peak torque were examined among participants in 2001 – 2002 using the fully adjusted model and then after including serum 25(OH)D levels as a covariate. The addition of continuous 25(OH)D to the model did not alter the results (Table 5), nor did inclusion of 25(OH)D as quartiles (data not shown). As participants who completed peak torque testing were less likely to have characteristics associated with poor health (Table 2), we looked for effect modification of gait speed in this subgroup similar to that seen with peak torque. There was no evidence of any interaction (p>0.8 for all). Finally, the multivariable-adjusted ORs for inability to walk a quarter mile or up 10 steps as outcomes were 1.82 (95% CI 1.15 – 2.89) and 1.90 (95% CI 1.04 – 3.49), respectively, for participants with serum bicarbonate <23 mEq/L compared with ≥23 mEq/L.
Table 4.
Adjusted ORs for Sensitivity Analyses of Low Gait Speed and Low Peak Torque by Serum Bicarbonate Level*
| CRP & dietary protein† |
eGFR ≥ 60 mL/min/1.73 m‡ |
No diuretic use§ |
Cystatin C-based eGFR¶ |
|
|---|---|---|---|---|
| Low Gait Speed# | ||||
| Number in analysis | 2631 | 2230 | 2122 | 2120 |
| Bicarbonate < vs ≥23 mEq/L |
1.43 (1.05 – 1.96) | 1.69 (1.21 – 2.36) | 1.50 (1.11 – 2.02) |
1.68 (1.13 – 2.50) |
| Low Peak Torque†† | ||||
| Number in analysis | 2095 | 1824 | 1739 | 1643 |
| Bicarbonate < vs ≥23 mEq/L |
||||
| Overall | 1.38 (1.08 – 1.74) | 1.68 (1.31 – 2.16) | 1.34 (1.06 – 1.68) |
1.44 (0.96 – 2.15) |
| White Women | 0.94 (0.47 – 1.88) | 1.30 (0.66 – 2.56) | 0.85 (0.43 – 1.68) |
0.63 (0.26 – 1.49) |
| Non-white women |
2.44 (1.23 – 4.83) | 2.77 (1.36 – 5.57) | 2.20 (1.14 – 4.27) |
2.07 (0.84 – 5.09) |
| Men | 1.49 (1.06 – 2.10) | 1.86 (1.22 – 2.84) | 1.53 (1.06 – 2.19) | 1.65 (0.96 – 2.84) |
Unless otherwise indicated, values shown are adjusted OR (95% confidence interval).
Abbreviations: OR, odds ratio; eGFR, estimated glomerular filtration rate; CRP, C-reactive protein.
Defined as the lowest sex-specific quartile of gait speed and peak torque, respectively.
Log-transformed C-reactive protein and dietary protein added to variables included in Model 3 from Table 3 (see below for adjustors)
Analysis (Model 3 from Table 3) restricted to participants with eGFR ≥ 60 mL/min/1.73 m2
Analysis (Model 3 from Table 3) restricted to participants reporting no diuretic use
Analysis (Model 3 from Table 3) performed with eGFR calculated using cystatin C, age, sex, and race
Models adjusted for age, sex, race/ethnicity, BMI, poverty, education, smoking, alcohol intake, activity level, performance of muscle strengthening activities, diuretic use by self-report, diagnosis of hypertension, arthritis by self-report, liver disease by self-report, eGFR <60 ml/min/1.73 m2, log-transformed urine albumin-creatinine ratio, serum albumin, serum calcium
Models adjusted for age, sex (for overall cohort), race/ethnicity (for overall cohort, non-white women and men), BMI, poverty, education, marital status, smoking, alcohol intake, activity level, diuretic use by self-report, diagnosis of hypertension, diagnosis of diabetes mellitus, cardiovascular disease by self-report, arthritis by self-report, thyroid disease by self-report, eGFR <60 ml/min/1.73 m2, log-transformed urine albumin-creatinine ratio, serum albumin, serum calcium, hemoglobin
Table 5.
Adjusted ORs of Low Peak Torque for serum Bicarbonate < 23 vs ≥23 mEq/L*
| 25(OH) vitamin D level included in model† | ||
|---|---|---|
| Yes (n = 1174) |
No (n = 1178) |
|
| Overall | 1.61 (1.11 – 2.34) | 1.56 (1.10 – 2.21) |
| White Women | 0.94 (0.32 – 2.74) | 0.93 (0.33 – 2.67) |
| Non-white women | 2.59 (0.95 – 7.04) | 2.56 (1.02 – 6.38) |
| Men | 2.07 (1.25 – 3.43) | 2.01 (1.19 – 3.38) |
Values shown as OR (95% CI).
Abbreviations: OR, odds ratio; CI, confidence interval; 25(OH) vitamin D, 25 hydroxyvitamin D
Low peak torque defined as the lowest sex-specific quartile of peak torque.
Analyses performed among participants in 2001 – 2002 only as 25(OH) vitamin D levels were only available in these years. Models adjusted for age, sex (for overall cohort), race/ethnicity (for overall cohort, non-white women and men), BMI, poverty, education, marital status, smoking, alcohol intake, activity level, diuretic use by self-report, diagnosis of hypertension, diagnosis of diabetes mellitus, cardiovascular disease by self-report, arthritis by self-report, thyroid disease by self-report, eGFR <60 ml/min/1.73 m2, log-transformed urine albumin-creatinine ratio, serum albumin, serum calcium, hemoglobin (and 25(OH) vitamin D level as noted)
DISCUSSION
In the general US population 50 years of age or older, our results demonstrate that lower serum bicarbonate levels are associated with slower gait speed, reduced quadriceps peak torque, and self-reported disability after adjustment for multiple possible confounders including age, sex, kidney function, BMI, and activity level. Lower bicarbonate levels were associated with low peak torque among men and non-white women, but not among white women. These results were robust to multiple sensitivity analyses. To our knowledge this is the first study in the general population to examine the association of acidosis, or low serum bicarbonate levels, with functional outcomes that predict disability,28 hospitalizations,29 and survival.30 The non-linear association of serum bicarbonate with both outcomes suggests a possible threshold effect, where levels below approximately 23 – 25 mEq/L are associated with reduced muscle strength, but with no further incremental benefit attributed to levels above this cutpoint.
The association of lower serum bicarbonate levels with lower gait speed and quadriceps strength may be mediated by an effect of acidosis on muscle protein metabolism. Knee extension strength is an important determinant of gait speed 31 and thus both may be influenced by a process affecting muscle growth or breakdown. In persons with CKD, acidosis contributes to protein-energy wasting, a syndrome characterized by derangements in skeletal muscle protein metabolism, loss of muscle mass, insulin resistance, and inflammation.32 Treatment with alkali in patients with CKD has shown improvements in lean body mass.9, 10 Similarly, treatment of low-level metabolic acidosis in individuals without kidney disease has demonstrated physiologic improvements such as reduced urinary nitrogen losses in postmenopausal women.16
Inflammation could partially mediate the association of acidosis with lower musculoskeletal function. Higher levels of inflammatory markers have been associated with disability33 and reduced muscle strength in the elderly.34 In patients with CKD, evidence suggests an association of acidosis with inflammation,6 but this has not been entirely consistent..35 Adjustment for CRP levels did not alter our results, suggesting that inflammation may not play a major role in this pathway.
The reasons for effect modification by race/ethnicity of the associations with peak torque but not gait speed remain unclear. Accounting for estrogen use and 25(OH)D levels did not explain the differences noted between white and non-white women. No racial difference was noted in the relationship of muscle strength with disability among older black and white women.36 Serum bicarbonate levels are lower in minority populations compared with white individuals,37 but it is not clear how racial or ethnic variations would alter the effects of acidosis on skeletal muscle. There may be other unmeasured factors related to acidosis and muscle function that differ among white and non-white women. However, if the effect modification of quadriceps strength reflected a biological process, we might reasonably expect to find a similar effect when examining gait speed. The lack thereof suggests a factor related to completion of quadriceps strength testing, rather than a mediator of the acidosis-protein metabolism pathway. Participants who did not complete peak torque testing were more likely than those who did to have characteristics associated with poor health. While we adjusted for these factors in our analyses, other unmeasured differences may have been present that we were unable to account for. As the effect modification by race/ethnicity was only noted in the peak torque analysis, which was performed in a subgroup of the full cohort, the interaction noted may be spurious because of the smaller sample size available.
Previous reports have indicated a substantial prevalence of overt metabolic acidosis only when the eGFR falls below 30 mL/min/1.73 m2.38 However, no previous report has focused on the importance of acidosis among the elderly on a population-based level. Older age has been associated with a low-level metabolic acidosis partly due to the age-related decline in GFR,13 and the ability to excrete an acid load may be reduced with advancing age.39 Our finding that low serum bicarbonate is present in 22% of Americans 50 years of age or older suggests greater public health importance than previously recognized. The net acid load of the typical Western diet has been associated with several pathophysiological consequences, including urinary nitrogen wasting.11 If treatment with alkali produced sustained improvements in muscle mass and strength, the potential effect on functional performance could portend improved outcomes among older individuals.30 Further studies are needed to examine the long-term impact of alkali supplementation on nitrogen balance, muscle strength, and other relevant measures of physical function.
There are several important limitations to this analysis. Acidosis was defined using a single measure of serum bicarbonate without measurements of arterial pH or pCO2. Handling of samples, including processing delays and exposure of serum to air, may affect bicarbonate levels. Air transport,40, 41 and possibly differences in assays,42 have been reported to cause spuriously low bicarbonate levels among patients receiving dialysis. We could not account for this possibility, which would be expected to introduce non-differential misclassification and likely bias our results toward the null hypothesis. In addition, low bicarbonate levels may represent a more sensitive marker of reduced kidney function than eGFR. The associations found might then be due to unmeasured confounding due to kidney disease. However, restricting our analyses to participants with eGFR ≥60 mL/min/1.73 m2 did not change the results. Use of GFR estimating equations may overestimate the diagnosis of CKD in the elderly.43 GFR estimation using cystatin C levels may be affected by factors such as inflammation.25 Finally, as with all cross-sectional studies, no causal association can be inferred between serum bicarbonate and the outcomes examined here.
In summary, we have shown that lower serum bicarbonate levels are associated with slower gait speed and reduced quadriceps strength in the general US population 50 years of age or older. Further studies are needed to prospectively examine the association of serum bicarbonate levels with muscle strength and to determine the effect of alkali treatment on functional outcomes in older adults.
ACKNOWLEDGMENTS
Support: This research was supported by National Institutes of Health (NIH) grants K23 DK078774 to Dr. Melamed and R21 DK 077326 and RO1 DK080123 to Dr. Hostetter, and CTSA grants UL1 RR025750, KL2 RR025749 and TL1 RR025748 from the National Center for Research Resources, a component of the NIH.
Footnotes
This is a PDF file of an unedited manuscript that has been accepted for publication. As a service to our customers we are providing this early version of the manuscript. The manuscript will undergo copyediting, typesetting, and review of the resulting proof before it is published in its final citable form. Please note that during the production process errors may be discovered which could affect the content, and all legal disclaimers that apply to the journal pertain.
Conflict of Interest: Dr. Hostetter has consulted for Bristol Myers Squibb, Eli Lilly, Genzyme, and Wyeth. The remaining authors declare that they have no relevant financial interests.
REFERENCES
- 1.Hiatt WR, Koziol BJ, Shapiro JI, Brass EP. Carnitine metabolism during exercise in patients on chronic hemodialysis. Kidney Int. 1992 Jun;41(6):1613–1619. doi: 10.1038/ki.1992.233. [DOI] [PubMed] [Google Scholar]
- 2.Headley S, Germain M, Mailloux P, et al. Resistance training improves strength and functional measures in patients with end-stage renal disease. Am J Kidney Dis. 2002 Aug;40(2):355–364. doi: 10.1053/ajkd.2002.34520. [DOI] [PubMed] [Google Scholar]
- 3.Painter P, Messer-Rehak D, Hanson P, Zimmerman SW, Glass NR. Exercise capacity in hemodialysis, CAPD, and renal transplant patients. Nephron. 1986;42(1):47–51. doi: 10.1159/000183632. [DOI] [PubMed] [Google Scholar]
- 4.Sagiv M, Rudoy J, Rotstein A, Fisher N, Ben-Ari J. Exercise tolerance of end-stage renal disease patients. Nephron. 1991;57(4):424–427. doi: 10.1159/000186307. [DOI] [PubMed] [Google Scholar]
- 5.Mitch WE, Du J. Cellular mechanisms causing loss of muscle mass in kidney disease. Semin Nephrol. 2004 Sep;24(5):484–487. doi: 10.1016/j.semnephrol.2004.06.014. [DOI] [PubMed] [Google Scholar]
- 6.Pickering WP, Price SR, Bircher G, Marinovic AC, Mitch WE, Walls J. Nutrition in CAPD: serum bicarbonate and the ubiquitin-proteasome system in muscle. Kidney Int. 2002 Apr;61(4):1286–1292. doi: 10.1046/j.1523-1755.2002.00276.x. [DOI] [PubMed] [Google Scholar]
- 7.Papadoyannakis NJ, Stefanidis CJ, McGeown M. The effect of the correction of metabolic acidosis on nitrogen and potassium balance of patients with chronic renal failure. Am J Clin Nutr. 1984 Sep;40(3):623–627. doi: 10.1093/ajcn/40.3.623. [DOI] [PubMed] [Google Scholar]
- 8.Reaich D, Channon SM, Scrimgeour CM, Daley SE, Wilkinson R, Goodship TH. Correction of acidosis in humans with CRF decreases protein degradation and amino acid oxidation. Am J Physiol. 1993 Aug;265(2 Pt 1):E230–E235. doi: 10.1152/ajpendo.1993.265.2.E230. [DOI] [PubMed] [Google Scholar]
- 9.Stein A, Moorhouse J, Iles-Smith H, et al. Role of an improvement in acid-base status and nutrition in CAPD patients. Kidney Int. 1997 Oct;52(4):1089–1095. doi: 10.1038/ki.1997.433. [DOI] [PubMed] [Google Scholar]
- 10.de Brito-Ashurst I, Varagunam M, Raftery MJ, Yaqoob MM. Bicarbonate Supplementation Slows Progression of CKD and Improves Nutritional Status. J Am Soc Nephrol. 2009 Jul 16;20(9):2075–2084. doi: 10.1681/ASN.2008111205. [DOI] [PMC free article] [PubMed] [Google Scholar]
- 11.Frassetto L, Morris RC, Jr, Sellmeyer DE, Todd K, Sebastian A. Diet, evolution and aging--the pathophysiologic effects of the post-agricultural inversion of the potassium-to-sodium and base-to-chloride ratios in the human diet. Eur J Nutr. 2001 Oct;40(5):200–213. doi: 10.1007/s394-001-8347-4. [DOI] [PubMed] [Google Scholar]
- 12.Frassetto L, Sebastian A. Age and systemic acid-base equilibrium: analysis of published data. J Gerontol A Biol Sci Med Sci. 1996 Jan;51(1):B91–B99. doi: 10.1093/gerona/51a.1.b91. [DOI] [PubMed] [Google Scholar]
- 13.Frassetto LA, Morris RC, Jr, Sebastian A. Effect of age on blood acid-base composition in adult humans: role of age-related renal functional decline. Am J Physiol. 1996 Dec;271(6 Pt 2):F1114–F1122. doi: 10.1152/ajprenal.1996.271.6.F1114. [DOI] [PubMed] [Google Scholar]
- 14.Ceglia L, Harris SS, Abrams SA, Rasmussen HM, Dallal GE, Dawson-Hughes B. Potassium bicarbonate attenuates the urinary nitrogen excretion that accompanies an increase in dietary protein and may promote calcium absorption. J Clin Endocrinol Metab. 2009 Feb;94(2):645–653. doi: 10.1210/jc.2008-1796. [DOI] [PMC free article] [PubMed] [Google Scholar]
- 15.Dawson-Hughes B, Harris SS, Palermo NJ, Castaneda-Sceppa C, Rasmussen HM, Dallal GE. Treatment with potassium bicarbonate lowers calcium excretion and bone resorption in older men and women. J Clin Endocrinol Metab. 2009 Jan;94(1):96–102. doi: 10.1210/jc.2008-1662. [DOI] [PMC free article] [PubMed] [Google Scholar]
- 16.Frassetto L, Morris RC, Jr, Sebastian A. Potassium bicarbonate reduces urinary nitrogen excretion in postmenopausal women. J Clin Endocrinol Metab. 1997 Jan;82(1):254–259. doi: 10.1210/jcem.82.1.3663. [DOI] [PubMed] [Google Scholar]
- 17.Jehle S, Zanetti A, Muser J, Hulter HN, Krapf R. Partial neutralization of the acidogenic Western diet with potassium citrate increases bone mass in postmenopausal women with osteopenia. J Am Soc Nephrol. 2006 Nov;17(11):3213–3222. doi: 10.1681/ASN.2006030233. [DOI] [PubMed] [Google Scholar]
- 18.Sebastian A, Harris ST, Ottaway JH, Todd KM, Morris RC., Jr Improved mineral balance and skeletal metabolism in postmenopausal women treated with potassium bicarbonate. N Engl J Med. 1994 Jun 23;330(25):1776–1781. doi: 10.1056/NEJM199406233302502. [DOI] [PubMed] [Google Scholar]
- 19.Ainsworth BE, Haskell WL, Whitt MC, et al. Compendium of physical activities: an update of activity codes and MET intensities. Med Sci Sports Exerc. 2000 Sep;32(9 Suppl):S498–S504. doi: 10.1097/00005768-200009001-00009. [DOI] [PubMed] [Google Scholar]
- 20.Muntner P, Woodward M, Mann DM, et al. Comparison of the Framingham Heart Study hypertension model with blood pressure alone in the prediction of risk of hypertension: the Multi-Ethnic Study of Atherosclerosis. Hypertension. 2010 Jun;55(6):1339–1345. doi: 10.1161/HYPERTENSIONAHA.109.149609. [DOI] [PMC free article] [PubMed] [Google Scholar]
- 21.Levey AS, Stevens LA, Schmid CH, et al. A new equation to estimate glomerular filtration rate. Ann Intern Med. 2009 May 5;150(9):604–612. doi: 10.7326/0003-4819-150-9-200905050-00006. [DOI] [PMC free article] [PubMed] [Google Scholar]
- 22.Cullen GE, Earle IP. STUDIES OF THE ACID-BASE CONDITION OF BLOOD. Journal of Biological Chemistry. 1929 September 1;83(3):545–559. 1929. [Google Scholar]
- 23.Levey AS, Greene T, Kusek JW, Beck GJ. A simplified equation to predict glomerular filtration rate from serum creatinine [Abstract] J Am Soc Nephrol. 2000;11:155A. [Google Scholar]
- 24.Heymsfield SB, Arteaga C, McManus C, Smith J, Moffitt S. Measurement of muscle mass in humans: validity of the 24-hour urinary creatinine method. Am J Clin Nutr. 1983 Mar;37(3):478–494. doi: 10.1093/ajcn/37.3.478. [DOI] [PubMed] [Google Scholar]
- 25.Stevens LA, Coresh J, Schmid CH, et al. Estimating GFR using serum cystatin C alone and in combination with serum creatinine: a pooled analysis of 3,418 individuals with CKD. Am J Kidney Dis. 2008 Mar;51(3):395–406. doi: 10.1053/j.ajkd.2007.11.018. [DOI] [PMC free article] [PubMed] [Google Scholar]
- 26.Bischoff-Ferrari HA, Dietrich T, Orav EJ, et al. Higher 25-hydroxyvitamin D concentrations are associated with better lower-extremity function in both active and inactive persons aged > or =60 y. Am J Clin Nutr. 2004 Sep;80(3):752–758. doi: 10.1093/ajcn/80.3.752. [DOI] [PubMed] [Google Scholar]
- 27.Greising SM, Baltgalvis KA, Lowe DA, Warren GL. Hormone therapy and skeletal muscle strength: a meta-analysis. J Gerontol A Biol Sci Med Sci. 2009 Oct;64(10):1071–1081. doi: 10.1093/gerona/glp082. [DOI] [PMC free article] [PubMed] [Google Scholar]
- 28.Guralnik JM, Ferrucci L, Simonsick EM, Salive ME, Wallace RB. Lower-extremity function in persons over the age of 70 years as a predictor of subsequent disability. N Engl J Med. 1995 Mar 2;332(9):556–561. doi: 10.1056/NEJM199503023320902. [DOI] [PMC free article] [PubMed] [Google Scholar]
- 29.Cawthon PM, Fox KM, Gandra SR, et al. Do muscle mass, muscle density, strength, and physical function similarly influence risk of hospitalization in older adults? J Am Geriatr Soc. 2009 Aug;57(8):1411–1419. doi: 10.1111/j.1532-5415.2009.02366.x. [DOI] [PMC free article] [PubMed] [Google Scholar]
- 30.Hardy SE, Perera S, Roumani YF, Chandler JM, Studenski SA. Improvement in usual gait speed predicts better survival in older adults. J Am Geriatr Soc. 2007 Nov;55(11):1727–1734. doi: 10.1111/j.1532-5415.2007.01413.x. [DOI] [PubMed] [Google Scholar]
- 31.Cuoco A, Callahan DM, Sayers S, Frontera WR, Bean J, Fielding RA. Impact of muscle power and force on gait speed in disabled older men and women. J Gerontol A Biol Sci Med Sci. 2004 Nov;59(11):1200–1206. doi: 10.1093/gerona/59.11.1200. [DOI] [PubMed] [Google Scholar]
- 32.Mitch WE. Malnutrition: a frequent misdiagnosis for hemodialysis patients. J Clin Invest. 2002 Aug;110(4):437–439. doi: 10.1172/JCI16494. [DOI] [PMC free article] [PubMed] [Google Scholar]
- 33.Penninx BW, Kritchevsky SB, Newman AB, et al. Inflammatory markers and incident mobility limitation in the elderly. J Am Geriatr Soc. 2004 Jul;52(7):1105–1113. doi: 10.1111/j.1532-5415.2004.52308.x. [DOI] [PubMed] [Google Scholar]
- 34.Visser M, Pahor M, Taaffe DR, et al. Relationship of interleukin-6 and tumor necrosis factor-alpha with muscle mass and muscle strength in elderly men and women: the Health ABC Study. J Gerontol A Biol Sci Med Sci. 2002 May;57(5):M326–M332. doi: 10.1093/gerona/57.5.m326. [DOI] [PubMed] [Google Scholar]
- 35.Lin SH, Lin YF, Chin HM, Wu CC. Must metabolic acidosis be associated with malnutrition in haemodialysed patients? Nephrol Dial Transplant. 2002 Nov;17(11):2006–2010. doi: 10.1093/ndt/17.11.2006. [DOI] [PubMed] [Google Scholar]
- 36.Rantanen T, Guralnik JM, Leveille S, et al. Racial differences in muscle strength in disabled older women. J Gerontol A Biol Sci Med Sci. 1998 Sep;53(5):B355–B361. doi: 10.1093/gerona/53a.5.b355. [DOI] [PubMed] [Google Scholar]
- 37.Foley RN, Wang C, Ishani A, Collins AJ. NHANES III: influence of race on GFR thresholds and detection of metabolic abnormalities. J Am Soc Nephrol. 2007 Sep;18(9):2575–2582. doi: 10.1681/ASN.2006121411. [DOI] [PubMed] [Google Scholar]
- 38.Clase CM, Kiberd BA, Garg AX. Relationship between glomerular filtration rate and the prevalence of metabolic abnormalities: results from the Third National Health and Nutrition Examination Survey (NHANES III) Nephron Clin Pract. 2007;105(4):c178–C184. doi: 10.1159/000100489. [DOI] [PubMed] [Google Scholar]
- 39.Hilton JG, Goodbody MF, Jr, Kruesi OR. The effect of prolonged administration of ammonium chloride on the blood acid-base equilibrium of geriatric subjects. J Am Geriatr Soc. 1955 Sep;3(9):697–703. doi: 10.1111/j.1532-5415.1955.tb00885.x. [DOI] [PubMed] [Google Scholar]
- 40.Kirschbaum B. Spurious metabolic acidosis in hemodialysis patients. Am J Kidney Dis. 2000 Jun;35(6):1068–1071. doi: 10.1016/s0272-6386(00)70041-2. [DOI] [PubMed] [Google Scholar]
- 41.Laski ME. Penny wise and bicarbonate foolish. Am J Kidney Dis. 2000 Jun;35(6):1224–1225. doi: 10.1016/s0272-6386(00)70063-1. [DOI] [PubMed] [Google Scholar]
- 42.Bray SH, Tung RL, Jones ER. The magnitude of metabolic acidosis is dependent on differences in bicarbonate assays. Am J Kidney Dis. 1996 Nov;28(5):700–703. doi: 10.1016/s0272-6386(96)90251-6. [DOI] [PubMed] [Google Scholar]
- 43.Glassock RJ. Referrals for chronic kidney disease: real problem or nuisance? JAMA. 2010 Mar 24;303(12):1201–1203. doi: 10.1001/jama.2010.315. [DOI] [PubMed] [Google Scholar]