Abstract
To investigate the participation of purinergic P2 receptors in the regulation of renal function in ANG II-dependent hypertension, renal and glomerular hemodynamics were evaluated in chronic ANG II-infused (14 days) and Sham rats during acute blockade of P2 receptors with PPADS. In addition, P2X1 and P2Y1 protein and mRNA expression were compared in ANG II-infused and Sham rats. Chronic ANG II-infused rats exhibited increased afferent and efferent arteriolar resistances and reductions in glomerular blood flow, glomerular filtration rate (GFR), single-nephron GFR (SNGFR), and glomerular ultrafiltration coefficient. PPADS restored afferent and efferent resistances as well as glomerular blood flow and SNGFR, but did not ameliorate the elevated arterial blood pressure. In Sham rats, PPADS increased afferent and efferent arteriolar resistances and reduced GFR and SNGFR. Since purinergic blockade may influence nitric oxide (NO) release, we evaluated the role of NO in the response to PPADS. Acute blockade with Nω-nitro-l-arginine methyl ester (l-NAME) reversed the vasodilatory effects of PPADS and reduced urinary nitrate excretion (NO2−/NO3−) in ANG II-infused rats, indicating a NO-mediated vasodilation during PPADS treatment. In Sham rats, PPADS induced renal vasoconstriction which was not modified by l-NAME, suggesting blockade of a P2X receptor subtype linked to the NO pathway; the response was similar to that obtained with l-NAME alone. P2X1 receptor expression in the renal cortex was increased by chronic ANG II infusion, but there were no changes in P2Y1 receptor abundance. These findings indicate that there is an enhanced P2 receptor-mediated vasoconstriction of afferent and efferent arterioles in chronic ANG II-infused rats, which contributes to the increased renal vascular resistance observed in ANG II-dependent hypertension.
Keywords: ATP, hypertension, renal hemodynamics
the renal vasoconstriction induced by chronic administration of angiotensin II (ANG II) is complex because several vasoactive compounds appear to contribute to the elevated renal vascular resistance. In addition to the direct effects of ANG II on the renal microcirculation, various other autocoids including the purinergic agents adenosine (Ado) and ATP have been implicated (13, 21, 32). Renal interstitial ATP concentrations are increased in response to increases in renal perfusion pressure, and ATP participates in the acute regulation of renal vascular resistance (26–28). Furthermore, in ANG II-infused hypertensive rats, there is an elevation of renal interstitial ATP concentrations (15) associated with renal afferent arteriole hypertrophy and mesangial cell transformation to myofibroblasts. In this model, the administration of pyridoxal phosphate-6-azo(benzene-2,4-disulfonic acid) tetrasodium salt hydrate (PPADS), a nonselective P2 receptor blocker and clopidogrel, a P2Y12 receptor blocker, prevented the development of afferent arteriolar thickening and the increased α-actin expression in mesangial cells without changes in the interstitial ANG II concentrations (15). These findings suggest that ATP contributes to the renal vasoconstriction in ANG II-dependent hypertension. In addition, P2X1 receptors, which elicit vasoconstriction, have been found in the renal vasculature including afferent arterioles but not efferent arterioles (7), and ATP exerts an important role in regulating the preglomerular microvasculature (19).
The elevated renal interstitial fluid ATP concentrations in ANG II-infused rats suggest that it may contribute to the augmented renal vascular resistance in hypertension, but the role of P2 receptors has not been completely elucidated under these conditions. However, the issues are complex because P2Y and P2X4 receptors located on the endothelial cells produce vasodilation via nitric oxide (NO), and P2X and P2Y1/2 receptors found in the vascular smooth muscle cells mediate vasoconstriction (9, 16). Furthermore, expression of purinergic P2 receptors may change in pathophysiological conditions such as hypertension. Thus this study was designed to evaluate the participation of purinergic P2 receptors in the regulation of renal function in ANG II-infused rats and the pathophysiological implications.
MATERIALS AND METHODS
Experimental protocol.
Male Wistar rats (350–360 g) were infused with ANG II (Sigma, St. Louis, MO) in Ringer lactate via subcutaneous osmotic minipumps (Alzet model 2002, Alza, Palo Alto, CA) for 2 wk, as previously described (14). The following groups of rats (n = 9/group) were studied.
Group 1: Sham and ANG II-infused rats (435 ng·kg−1·min−1 for 14 days) received intra-aortic vehicle during the micropuncture procedures.
Group 2: Sham and ANG II-infused rats were treated acutely with PPADS (15 mg/kg+2.5 mg·kg−1·min)−1 intra-aortically above the renal artery.
Group 3: Sham and ANG II-infused rats were treated acutely with intravenous Nω-nitro-l-arginine methyl ester (l-NAME) infusion (100 μg·kg−1·h−1) and intra-aortic PPADS.
Group 4: Sham and ANG II-infused rats were treated acutely with an intravenous l-NAME infusion at the dose previously mentioned and intra-arterial vehicle infusion.
Excretion of urinary nitrate (UNO2−/NO3−) was measured as an index of NO activity. In addition, P2X1 and P2Y1 protein and mRNA expression were evaluated in kidneys harvested from hypertensive rats after 14 days of ANG II infusion, and immunohistochemistry for P2X1 and P2Y1 was performed in the kidneys of ANG II and Sham rats.
Methods.
All animal procedures were performed in accordance with the Mexican Federal Regulation for animal experimentation and care (NOM-062-ZOO-2001) and were approved by the Bioethics and Investigation Committees of the Instituto Nacional de Cardiología “Ignacio Chávez.” The rats were kept on a normal diet, with free access to food and water.
Arterial pressure measurements.
Systolic arterial pressure (SAP) measurements were performed in conscious, restrained rats by tail-cuff plethysmography (Narco Biosystems, Austin, TX). The rats were conditioned twice before blood pressure was measured at a basal period and every week.
Proteinuria.
The rats were placed in metabolic cages with water and food ad libitum, and urine was collected for a 24-h period; the collections were taken during a basal period and every week before the kidneys were harvested. The urine samples were used for determination of proteinuria. Urinary protein excretion was measured by a trichloracetic acid assay, using bovine serum albumin as the protein standard (17).
Excretion of UNO2−/NO3−.
The excretion of UNO2−/NO3− was obtained by reduction of UNO2−/NO3− with nitrate reductase, as previously described (2) in the urine collected during the experimental procedure in Sham, ANG II-infused rats during the infusion of PPADS, or l-NAME+PPADS in both groups. After incubation, total NO2− was measured using the Griess reagent. Known concentrations of NaNO2 and NaNO3 were used as standards in each assay. Data are expressed as nanomoles per minute.
Micropuncture studies.
On day 14 after the beginning of the ANG II infusion, the animals were anesthetized with pentobarbital sodium (30 mg/kg ip), and supplementary doses were administered as required. The rats were placed on a thermo-regulated table, and the temperature was maintained at 37°C. Polyethylene tubing was used to catheterize the trachea (PE-240), jugular veins and right femoral artery (PE-50), and the left ureter (PE-10); an intra-aortic catheter was introduced so as to reach 4–5 mm beyond the left renal artery for infusion of vehicle or antagonists. The left kidney was exposed and placed in a lucite holder, covering the kidney surface with Ringer solution. During the surgery, rats received a plasma infusion (1% of body weight) through a jugular catheter. Immediately afterward, a bolus injection of 100 mg of polyfructosan in 0.5 ml of Ringer solution was done and an infusion of 10% polyfructosan in Ringer solution was started at a rate of 2.2 ml/h (Inutest, Fressenius Pharma); this infusion rate was sufficient to induce disequilibrium in Sham rats. After 60 min, seven timed samples of proximal tubular fluid were obtained to determine tubular flow and polyfructosan concentration. Intratubular hydrostatic pressures under free-flow and stop-flow conditions and peritubular capillary pressures were measured in other proximal tubules with a servo-null device (Servo-Nulling Pressure System, Instrumentation for Physiology and Medicine, San Diego, CA), as previously described (1, 11). Mean arterial pressure (MAP) was continuously monitored with a pressure transducer (model p23 LX, Gould, Hato Rey, PR) and recorded on a polygraph (Grass Instruments, Quincy, MA).
Blood samples were taken periodically and replaced with blood from a normal donor rat. Polyfructosan was measured in plasma and urine samples. Glomerular colloid osmotic pressure was estimated from the plasma protein concentrations in blood taken from the femoral artery and from the surface of the efferent arterioles.
Polyfructosan concentrations were determined by the method of Davidson et al. (10). The volume of fluid collected from an individual proximal tubule was estimated from the length of the column of fluid in a capillary tube of uniform bore and known internal diameter. The concentration of tubular polyfructosan was measured by the method of Vurek and Pegram (36). The protein concentration in the efferent samples was determined by the method described by Viets et al. (35).
Proximal single-nephron glomerular filtration rate (SNGFR), intratubular pressure during free-flow conditions and under stopped-flow conditions after blocking of the tubular lumen with a long oil column (SFP), glomerular capillary hydrostatic pressure (PGC), peritubular capillary pressure, afferent oncotic pressure, efferent oncotic pressure, glomerular capillary hydrostatic pressure gradient (ΔP), single-nephron filtration fraction, single-nephron glomerular plasma flow, afferent and efferent resistances, ultrafiltration coefficient (Kf), and oncotic pressure were calculated according to equations given elsewhere (3).
Western blotting for P2X1 and P2Y1 receptors.
After the experiments, the kidneys were excised, separated into cortex and medulla, and the tissues were frozen in liquid nitrogen and stored at −70°C until used. Forty micrograms of protein were treated with 12% SDS-PAGE and transferred onto a nitrocellulose membrane. Then, the membrane was washed and probed with 1:1,000 polyclonal antibody against P2X1 and P2Y1 (Santa Cruz Biotechnology, Santa Cruz, CA) and 1:1,000 goat HRP-labeled anti-rabbit IgG. Finally, enhancing chemiluminescence (ECL) detection solution was added and Kodak Omat film was exposed to the membrane. Each membrane was stripped of bound antibody and reprobed with anti-β-actin on the same membrane for quantitative comparison. The protein concentration was measured by the Lowry method (25).
Quantitative real-time RT-PCR.
Half a kidney from each rat was placed into RNAlater (Ambion, Austin, TX) and kept at −70°C. Total RNA was extracted using a commercially available kit (Qiagen, Valencia, CA), and treated with DNAse I (Invitrogen, Carlsbad, CA) to remove contaminating genomic DNA. Real-time RT-PCR was performed as previously described (15). Quantitative real-time RT-PCR for rP2RX1 and rP2RY1 were performed in a Mx3000P instrument (Stratagene, La Jolla, CA) using MxPro QPCR software (Stratagene) and a brilliant 1-Step QRT-PCR master mix kit as the reagent (Stratagene). Dual Label was 5′: HEX and 3′: BHQ-2 for the control gene and 5′: 6-FAM and 3′: BHQ-1 for target genes. The program conditions were the following: 50°C, 30 min, 1 cycle in step 1; 95°C, 10 min, 1 cycle in step 2; and 95°C, 15 s followed by 60°C, 1 min, 40 cycles in step 3. Data of quantitative real-time RT-PCR were normalized by comparing results with glyceraldehyde-3-phosphate dehydrogenase mRNA expression. The information of sequences were as follows: rP2RX1, forward primer 5′-TTG ACT GGA AGT GTG ATC TG -3′, reverse primer 5′-TGG CAA ATC TGA AGT TGA AG -3′, probe 5′-/56-FAM/ACT GCA AAC CCA TCT ACC AGT TCC/3BHQ-1/-3′; rP2RY1, forward primer 5′-GCC ACC TAT CAG GTA ACA AG -3′, reverse primer 5′- AAT GTA TCT CCA GCC AAG AA-3′, probe 5′-/56-FAM/TCT AGC AAG TCT CAA CAG CTG TGT/3BHQ-1/-3′; and glyceraldehyde-3-phosphate dehydrogenase, forward primer 5′-CAG AAC ATC ATC CCT GCA TC-3′, reverse primer 5′-CTG CTT CAC CAC CTT CTT GA-3′, probe 5′-/5-HEX/CCT GGA GAA ACC TGC CAA GTA TGA TGA/3BHQ-2/-3′.
Immunohistochemical studies.
Paraffin-embedded sections were stained with hematoxylin-eosin. Three-micrometer sections were examined by one person in a blind fashion. P2X1 and P2Y1 receptors were identified by indirect peroxidase immunostaining. Renal sections incubated with normal rabbit serum were used as negative controls for immunostaining against purinergic receptors. 3,3′-Diaminobenzidine was used to visualize peroxidase activity. Twenty nonoverlapping fields of cortex (640 × 477 mm at ×10) per biopsy were analyzed by light microscopy (Olympus BX51, Olympus American, Melville, NY) and captured with a digital video camera (CoolSnap Pro, Media Cybernetics, Silver Spring, MD). Pictures were processed by a computer and analyzed using Image-Pro-Plus 5.0 (Media Cybernetics). Positive brown areas were selected and quantified in pixel units; for each examined field, the extension of positive areas was expressed as a fraction of the tubulointerstitial area examined (positive areas divided by overall field area). Together, 20 different microscopic fields per tissue section per animal were analyzed.
Chemicals.
ANG II, PPADS, l-NAME, and 3,3′-diaminobenzidine were purchased from Sigma-Aldrich. Bovine serum albumin and antibodies against P2X1 and P2Y1 receptors for Western blotting were purchased from Santa Cruz Biotechnology. Antibodies against P2X1 and P2Y1 receptors for immunohistochemistry were purchased from Millipore (Billerica MA). ECL detection solution was obtained from Amersham Biosciences (Buckinghamshire, UK). Polyfructosan (Inutest) was purchased from Fresenius Pharma. The rest of the compounds were of molecular biology or analytic grade and purchased from several companies.
Statistical analysis.
The results are presented as means ± SE. The significance of differences within and between groups was evaluated by ANOVA followed by the Tukey post hoc test for multiple groups. Differences with P < 0.05 were considered statistically significant.
RESULTS
Effects of chronic ANG II on blood pressure and urinary protein excretion.
Chronic administration of ANG II increased SAP from a baseline of 115 ± 5 to 180 ± 5 at day 7 and to 199 ± 7 mmHg at day 14. Similarly, the magnitude of the proteinuria increased from a baseline of 12.3 ± 3.2 to 67.9 ± 7.1 at day 7 and to 119.9 ± 13.1 mg/24 h at day 14. SAP and protein excretion in Sham rats were not significantly altered from baseline during this period.
Renal and glomerular function.
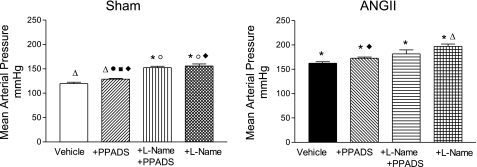
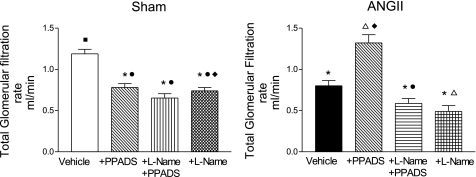
To evaluate the functional role of increased ATP levels in ANG II-dependent hypertension, glomerular hemodynamic measurements were assessed. In agreement with previous studies (14), the ANG II-infused rats exhibited increased MAP associated with a decrease in whole kidney GFR (Figs. 1 and 2).
Fig. 1.
Mean arterial pressures in Sham-control (left) and ANG II-infused (right) rats at baseline, during pyridoxal phosphate-6-azo(benzene-2,4-disulfonic acid) tetrasodium salt hydrate (PPADS), coadministration of Nω-nitro-l-arginine methyl ester (l-NAME)+PPADS, and l-NAME alone. Values are means ± SE. *P < 0.001 vs. Sham-vehicle. ΔP < 0.001 vs. ANG II+vehicle, ○P < 0.01 vs. Sham+PPADS. ●P < 0.001 vs. ANG II+PPADS. □P < 0.001 vs. Sham+l-NAME+PPADS. ■P < 0.001 vs. ANG II+l-NAME+PPADS. ◊P < 0.001 vs. Sham+l-NAME. ♦P < 0.01 vs. ANG II+l-NAME.
Fig. 2.
Whole kidney glomerular filtration rate in Sham-control (left) and ANG II (right) groups at baseline, during PPADS, coadministration of l-NAME+PPADS, and l-NAME alone. Values are means ± SE. *P < 0.01 vs. Sham-vehicle. ΔP < 0.01 vs. ANG II+vehicle. ○P < 0.001 vs. Sham+PPADS; ●P < 0.001 vs. ANG II+PPADS. □P < 0.001 vs. Sham+l-NAME+PPADS. ■P < 0.001 vs. ANG II+l-NAME+PPADS. ◊P < 0.001 vs. Sham+l-NAME. ♦ P < 0.01 vs. ANG II+l-NAME.
Since all the groups of rats were in disequilibrium, it was possible to calculate Kf. The data obtained from the micropuncture experiments including glomerular capillary ΔP are shown in Table 1.
Table 1.
Intratubular pressure, afferent and efferent protein concentration, oncotic pressure, and hydrostatic pressure in Sham and ANG II rats
| Group | ITP, mmHg | CA, g/dl | CE, g/dl | πA, mmHg | πE, mmHg | ΔP, mmHg |
|---|---|---|---|---|---|---|
| Sham | 11.40 ± 1.73 | 5.12 ± 0.55 | 7.32 ± 0.51 | 16.35 ± 0.54 | 27.88 ± 0.98 | 37.40 ± 1.23 |
| Sham+PPADS | 10.96 ± 9.53 | 5.65 ± 0.35 | 7.56 ± 0.36 | 16.59 ± 0.72 | 24.12 ± 1.7 | 35.15 ± 1.059 |
| Sham+l-NAME +PPADS | 9.53 ± 1.36 | 5.24 ± 0.46 | 7.44 ± 0.50 | 16.99 ± 0.71 | 28.58 ± 0.98 | 54.01 ± 1.28 |
| Sham+ l-NAME | 10.56 ± 0.72 | 5.64 ± 0.44 | 7.61 ± 0.56 | 17.91 ± 2.25 | 29.71 ± 3.33 | 57.97 ± 1.72 |
| ANG II | 12.52 ± 1.0 | 5.49 ± 0.30 | 7.96 ± 0.22 | 17.25 ± 0.77 | 27.97 ± 1.47 | 43.03 ± 1.17 |
| ANG II+PPADS | 12.19 ± 0.78 | 5.33 ± 0.46 | 7.36 ± 0.49 | 17.38 ± 0.81 | 28.18 ± 1.04 | 46.22 ± 1.06 |
| ANG II+l-NAME+PPADS | 10.73 ± 0.25 | 5.24 ± 0.46 | 7.44 ± 0.50 | 16.23 ± 0.64 | 27.44 ± 0.78 | 52.25 ± 1.25 |
| ANG II+l-NAME | 10.37 ± 0.62 | 5.68 ± 0.24 | 7.43 ± 0.94 | 18.78 ± 0.53 | 31.30 ± 1.48 | 57.14 ± 2.35 |
Values are means ± SE. ITP, intratubular pressure; CA and CE, afferent and efferent protein concentration, respectively; πA and πE, afferent and efferent oncotic pressure, respectively; ΔP, glomerular capillary hydrostatic pressure gradient; PPADS, pyridoxal phosphate-6-azo(benzene-2,4-disulfonic acid) tetrasolium salt hydrate; l-NAME, Nω-nitro-l-arginine methyl ester.
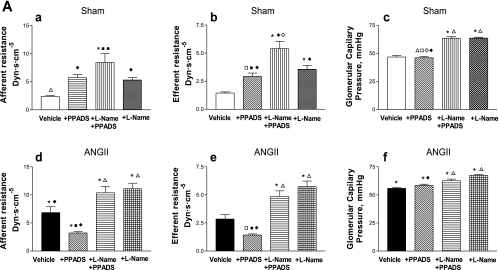
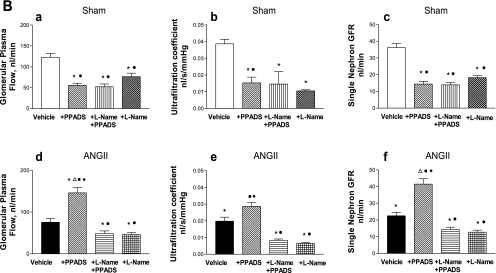
At the single nephron level, there were substantial increases in afferent and efferent arteriolar resistances and increased glomerular pressure associated with reductions in Kf, SNGFR, and glomerular plasma flow (Fig. 3). These reductions were reversed to near-normal values with the acute administration of PPADS; PPADS restored whole kidney GFR in the ANG II-infused rats to values higher than observed in Sham rats (Fig. 2). Thus the administration of the P2X1 receptor blocker reversed the arteriolar vasoconstriction induced by ANG II (Fig. 3), resulting in an increase in glomerular plasma flow, Kf, and SNGFR. MAP (Fig. 1), PGC, and Kf were not significantly altered by PPADS treatment (Fig. 3, A and B).
Fig. 3.
A: afferent and efferent resistances and glomerular capillary pressure in Sham-control (top) and ANG II (bottom) groups at baseline, during the administration of PPADS, and coadministration of l-NAME+PPADS, and l-NAME alone (a–f). Values are means ± SE. *P < 0.001 vs. Sham-vehicle. ΔP < 0.01 vs. ANG II+vehicle. ●P < 0.001 vs. ANG II+PPADS. □P < 0.01 vs. Sham+l-NAME+PPADS. ■P < 0.001 vs. ANG II+l-NAME+PPADS. ◊P < 0.01 vs. Sham+l-NAME. ♦P < 0.01 vs. ANG II+l-NAME. B: glomerular plasma flow, ultrafiltration coefficient, and single nephron GFR in Sham-control (top) and ANG II (bottom) groups at baseline, during the administration of PPADS, coadministration of l-NAME+PPADS, and l-NAME alone (a–f). Values are mean ± SE. *P < 0.001 vs. Sham-vehicle. ΔP < 0.001 vs. ANG II+vehicle. ●P < 0.001 vs. ANG II+PPADS. ■P < 0.001 vs. ANG II+l-NAME+PPADS. ♦P < 0.001 vs. ANG II+l-NAME.
In Sham rats, PPADS induced an unexpected vasoconstriction, characterized by a fall in whole kidney GFR (Fig. 2). The micropuncture data revealed significant increases in afferent and efferent arteriolar resistances, leading to decreases in glomerular plasma flow associated with decreases in Kf and SNGFR, but a maintained PGC (Fig. 3, A and B). The changes in glomerular hemodynamics cannot be attributed to changes in blood pressure because PPADS did not influence MAP in any of the groups studied (Fig. 1).
Because some of the responses following purinergic blockade may be due to alterations in coexisting NO-mediated actions, this possibility was explored by coadministering l-NAME and PPADS to hypertensive and normotensive rats (groups 5 and 6). In the presence of NOS blockade with l-NAME (Fig. 3, A and B), PPADS did not produce the afferent and efferent arteriolar vasodilation that was previously observed in the ANG II-infused rats, which persisted with marked renal cortical vasoconstriction. It is noteworthy that the afferent and efferent arteriolar resistances were actually higher than the basal values observed in the ANG II-infused group; with the administration of l-NAME alone, the afferent and efferent resistances had similar values than those observed with l-NAME+PPADS. In the Sham rats, the combined blockade of NOS and P2 receptors elicited increases in afferent and efferent arteriolar resistances which were actually greater than those seen with PPADS alone; because the increase in efferent arteriolar resistance was greater than the increase in afferent arteriolar resistance, PGC was increased (Fig. 3A). These changes were associated with a decrease in glomerular plasma flow, Kf, and SNGFR (Fig. 3B). The effect of NOS blockade by itself gave similar results than those obtained with PPADS alone, but lower than those obtained with l-NAME+PPADS (Fig. 3A); however, the PGC value was similar than the one obtained with l-NAME+PPADS.
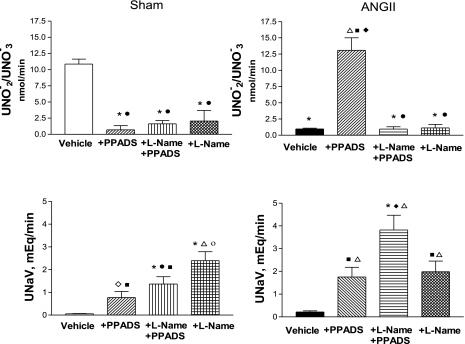
Excretion of UNO2−/NO3− and sodium.
Urinary excretion rates of nitrites were compared in Sham and ANG II-infused rats before and after treatment with PPADS alone or PPADS+l-NAME (Fig. 4). An average of 10.86 ± 0.75 nmol/min was obtained in Sham rats, while the excretion rates were much lower (1.0 ± 0.4 nmol/min) in the ANG II-infused rats. In the response to acute infusion of PPADS, the urinary nitrites were markedly increased in the ANG II rats. In contrast, nitrite excretion rates fell to very low levels in the Sham group treated with PPADS (Fig. 4). However, both groups exhibited very low excretion rates after treatment with l-NAME, reflecting effective NOS blockade; the effects obtained with l-NAME alone were similar. In the Sham group, there were marked decreases in urinary nitrites in the group treated with PPADS alone as well as with combined PPADS+l-NAME and with l-NAME alone.
Fig. 4.
Urinary excretion of nitrites/nitrates (UNO2−/NO3−; top) and urinary sodium excretion (UNaV; bottom) from Sham-control and ANG II groups at baseline, during PPADS, and coadministration of l-NAME+PPADS, and l-NAME alone. *P < 0.001 vs. Sham-vehicle. ○P < 0.001 vs. Sham+PPADS. ●P < 0.001 vs. ANG II+PPADS. ■P < 0.001 vs. ANG II+l-NAME+PPADS. ◊P < 0.001 vs. Sham+l-NAME. ♦P < 0.01 vs. ANG II+l-NAME.
Sodium excretion was significantly increased by PPADS in both Sham and ANG II-infused rats, but a greater value was observed in the latter. Coadministration of l-NAME and PPADS led to even greater increases in sodium excretion in both groups, following a pattern similar to that observed with PPADS. Administration of l-NAME alone further increased sodium excretion in the Sham group. In contrast, in the ANG II group the values were similar to those in the ANG II+PPADS rats. The highest sodium excretion rates were observed in the ANG II+l-NAME+PPADS group (Fig. 4). It should be pointed out, however, that there was a dissociation between the increase in sodium excretion and nitrite excretion in the groups treated with PPADS. In the Sham group, a progressive increase in sodium excretion was associated with a decrease in urinary nitrates, which remained suppressed during coadministration of l-NAME with PPADS or l-NAME alone. In the ANG II group, PPADS induced an increase in nitrite excretion and an increase in sodium excretion, but PPADS+l-NAME and l-NAME alone induced marked decreases in urinary nitrates associated with increased sodium excretion; in the l-NAME group sodium excretion values were similar to those obtained with PPADS alone.
P2X1 and P2Y2 protein and mRNA expression.
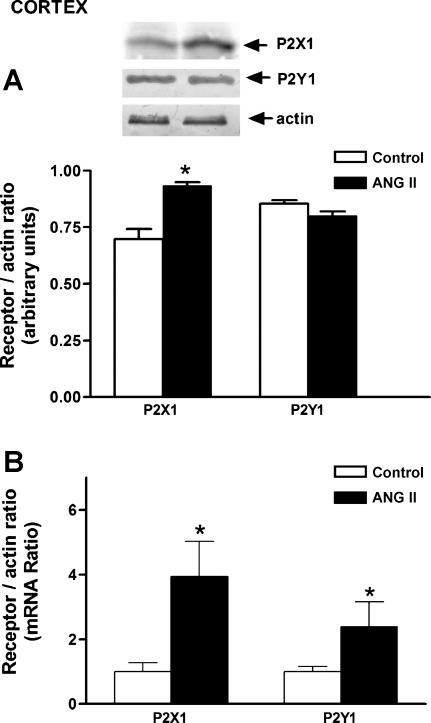
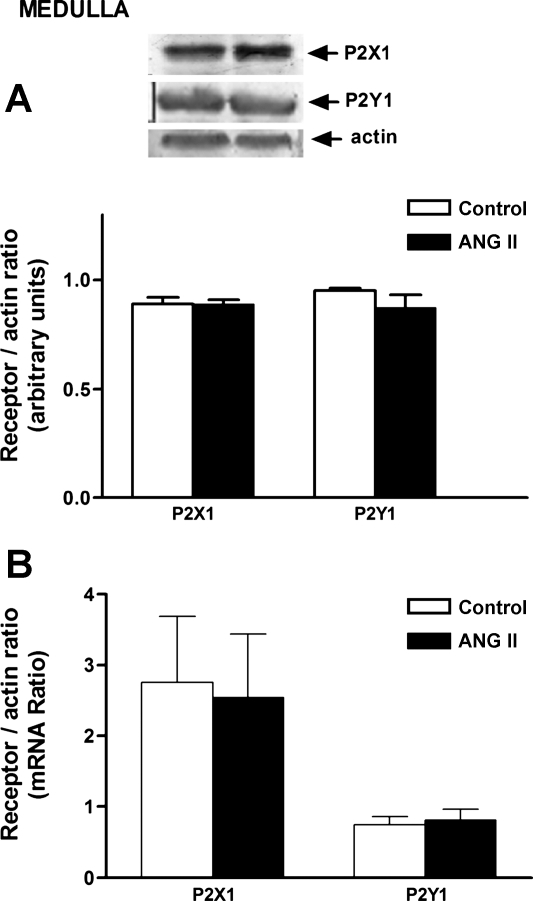
P2X1 receptor protein was increased in the cortex of ANG II-infused rats, and this finding was associated with an increase in mRNA expression (Fig. 5). In the medulla, no changes in P2X1 protein or mRNA expression were observed (Fig. 6). No significant changes in P2Y1 receptor protein expression were observed in either the cortex or medulla; only an increment in mRNA was observed in the cortex.
Fig. 5.
Purinergic receptors P2X1 and P2Y1 protein (A) and mRNA (B) in the renal cortex of Sham and ANG II-treated rats. Values are means ± SE. *P < 0.01 vs. Sham-control rats.
Fig. 6.
Purinergic receptors P2X1 and P2Y1 protein (A) and mRNA (B) in the renal medulla of Sham-control and ANG II-treated rats. Values are means ± SE. *P < 0.005 vs. Sham-control rats.
Immunohistochemical studies.
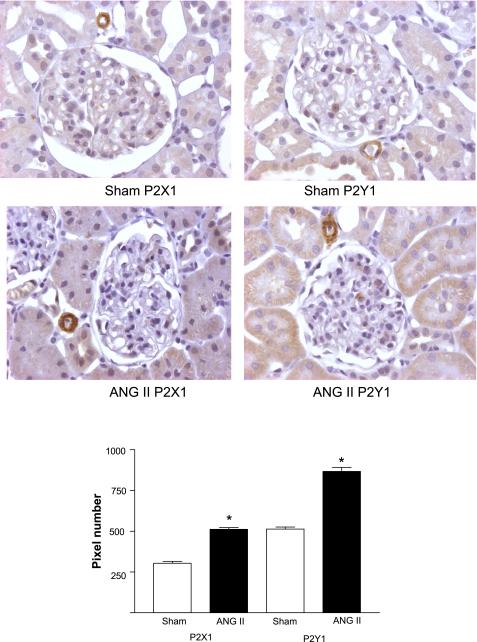
A representative image showing the immunolocalization of P2X1 and P2Y1 receptors is shown in Fig. 7. As can be seen, P2X1 and P2Y1 receptor expression was significantly higher in the kidneys of ANG II rats. As previously reported (7), P2X1 receptors were expressed in the renal afferent arterioles, but not in efferent arterioles. In addition, P2Y1 receptors were expressed in the afferent arterioles and in the tubular cells. A noteworthy finding is that the immunohistochemical data suggest that both P2X1 and P2Y1 receptor expression levels were increased in the cortex of the ANG II group. Because the Western blotting data did not show a difference, this suggests an increased membrane incorporation of the P2X1 and P2Y1 receptors in the chronic ANG II-infused rats.
Fig. 7.
P2X1 and P2Y1 protein expression immunoreactivity by using the immunoperoxidase technique in kidney cortex sections (3 μm) with specific immunostaining in Sham-control and ANG II-treated rats. Higher P2X 1 and P2Y1 immunoreactivity (diaminobenzidine chromogen) were observed in the renal cortex of ANG II-treated rats relative to the Sham kidney section (top). In addition, shown is (bottom) the pixel densitometric analysis of the receptors' intensity of immunoreactivity, performed in 20 microscopic fields/kidney section, and compared with sham kidneys. Values are means ± SE; n = 7 Sham rats and n = 7 ANG II-treated rats. *P < 0.001 vs. Sham.
DISCUSSION
Chronic ANG II infusions lead to progressive increases in arterial pressure associated with sufficient renal vasoconstriction to maintain or slightly reduce renal blood flow and GFR. Because both acute and chronic increases in arterial pressure result in increases in renal interstitial fluid ATP concentrations which contribute to the autoregulatory-associated responses in microvascular resistance, it is appropriate to consider that some of the increased vascular resistances observed in ANG II-dependent hypertension are modulated by purinergic receptors (13). Furthermore, ATP, a P2 purinergic nucleotide, participates in the regulation of vascular resistance and is elevated in ANG II-induced hypertension (15), suggesting a regulatory role of ATP in the renal vasoconstriction induced by chronic ANG II infusions. In the present study, we explored the possible contribution of ATP to the renal hemodynamic and glomerular alterations observed in ANG II-mediated hypertensive rats.
Infusion of ANG II for 14 days elicited increases in afferent and efferent arteriolar resistance and reductions in glomerular blood flow, SNGFR, and Kf, as previously described (14). Acute PPADS administration significantly reduced afferent and efferent arteriolar resistances and restored glomerular blood flow and SNGFR to near-normal values. These changes in glomerular hemodynamics cannot be attributed to modifications in blood pressure, since PPADS did not ameliorate the elevated arterial pressure. The present findings suggest an important contribution of ATP in mediating the renal vasoconstriction via activation of P2 purinergic receptors (P2X). Because P2X1 and P2Y1 receptors are expressed primarily in afferent, but not efferent arterioles, the effect of PPADS on efferent arteriolar resistance suggests the presence of additional systems activated subsequent to purinergic blockade in the ANG II-infused rats (7, 18, 23, 24, 34). In addition, the expression of P2X1 and P2Y1 receptors in the cortex of ANG II rats was significantly higher based on the immunohistochemical studies, but the protein and mRNA studies suggested that only P2X1 was upregulated; no changes in P2Y1 protein but an mRNA elevation was observed, suggesting an enhancement of the transcriptional rate, or a brief mRNA half-life. The difference in immunohistochemical results may be due to the fact that in Western blot analysis, the whole renal homogenate has a varied cell population, which may make it difficult to evaluate the expression of receptors mainly located in the renal vessels (38, 39). In contrast, with immunohistochemical analysis, the location of the receptors in the vessels can be observed directly and quantified by morphometrical techniques. Nevertheless, P2X1 upregulation was supported by both methods.
Several mechanisms may be involved in the renal vasodilation induced by PPADS. Because P2X1 receptors were upregulated in the cortical tissue of the ANG II group, they may have been exerting a direct effect on the vascular smooth muscle to increase renal vascular resistance. It is possible that their blockade unmasked the influence of P2Y receptors such as P2Y2, P2Y4, and P2Y6 and P2Y12, which are not blocked by PPADS (nonselective and not universal P2X and P2Y receptor blocker) (23), and may have exerted vasodilatory effects on the smooth muscle cells via release of NO by the endothelial cells, thus helping to explain the decrease in efferent arteriolar resistance (22, 23). In this regard, P2X4 receptors have been described in the endothelial cells, and they induce NO release (5, 20). However, activation of P2X1 receptors also stimulates the cytochrome P-450 pathway and induces production of vasoconstrictors HETEs (40) and this mechanism may be blocked by PPADS, resulting in vasodilation. In addition PPADS increases NO production which also inhibits HETE synthesis (30); thus, both mechanisms (which occurred simultaneously in our experiments) may explain the vasodilation observed in the ANG II rats. Because purinergic blockade may modify the release of NO production, further studies were performed to investigate the role of NO in the response to PPADS. Importantly, using UNO2−/NO3− as an index of NO activity, we found that it was low in the ANG II-infused rats compared with Sham rats at baseline, but increased greatly with infusion of PPADS, suggesting that NO produced by the endothelial cells was directly stimulated by PPADS perhaps through an effect on P2Y or P2X receptors not blocked by PPADS to release NO and elicit renal vasodilation. This finding is supported by the results observed upon coadministration of PPADS and l-NAME, which returned UNO2−/NO3− to levels similar to those found at baseline and thus suggests the existence of NO-mediated dilation in the PPADS group. This possibility is further supported by the fact that blockade of NO with l-NAME alone elicited effects similar to those obtained with PPADS+l-NAME. In this regard, it is recognized that activation of P2Y receptors induces release of ATP by shear stress in endothelial cells, through an increase in intracellular calcium, which activates NOS and NO production in the endothelium. NO could subsequently diffuse to the adjacent smooth muscle cells, where it would activate soluble guanylate cyclase and increase cGMP, leading to subsequent vasodilation via cGMP-dependent kinases (6). In our study, a low NO can explain the efferent vasoconstriction, which returned to near-normal values when NO increased in response to PPADS (19). In addition, although PPADS is a nonselective P2 receptor blocker and is very specific for purinergic receptors (37), it also blocks ectoATPase (8, 23), and it may not block P2Y2, and P2Y12 receptors (22, 23, 31).
In the Sham rats, PPADS induced paradoxical renal vasoconstriction, as manifested by an increase in afferent and efferent arteriolar resistance, with no changes in glomerular capillary pressure, and a reduction in glomerular blood flow, SNGFR, and Kf. These responses indicate that the effects of P2 receptors in normal control rats are primarily vasodilatory and can be attributed to the existence of a P2 receptor population in the endothelium, linked to NO release in the kidneys of Sham rats. Thus it is possible that the renal vasoconstriction observed in this group may be due to blockade of P2Y1 or P2X4 receptors on endothelial cells (8, 4, 9). The observation that the vasoconstriction induced by PPADS was associated with a marked decrease in UNO2−/NO3− in Sham rats suggests that this effect was mediated by reduced NO production possibly mediated by P2 receptors on endothelial cells. Further support for this suggestion is provided by the finding that l-NAME by itself induced a marked vasoconstriction which was similar to that obtained with PPADS with no additional effect of combined l-NAME and PPADS. In this regard, it has been demonstrated that P2X4 receptors are located on the endothelial cells and cause NO release, leading to vasodilation in some vessels (5, 24, 38). Thus the blockade of P2X4 receptors by high concentrations of PPADS would decrease NO production and induce vasoconstriction (20) and could explain the findings that efferent as well as afferent arteriolar resistances were reduced. Under these conditions, the coadministration of l-NAME would not have been expected to have a much greater additional effect, which was the case in the Sham rats. However, we cannot rule out that, in the presence of NO blockade, the effects of endogenous vasoconstrictor mediators could be enhanced and alter renal function. It is recognized that the renal vasoconstriction observed in the Sham rats with PPADS in this study was not observed by Takenaka et al. (33) or Osmond and Inscho (29); these authors used an intravenous bolus, each 20 min, with a lower dose than ours. Under those conditions, lower concentrations of PPADS possibly reached the kidney; however, the doses used in those studies (29, 33) were sufficient to block purinergic P2 receptors as evidenced by blockade of the vasoconstrictor response to methylene ATP; thus an explanation for the divergent effects of PPADS in Sham rats remains to be elucidated.
We also observed that sodium excretion was increased by PPADS both in Sham and ANG II-infused rats, suggesting that increased P2 receptor activity inhibits tubular reabsorption. These data are similar to those found in rats on a low-salt diet (12). The coadministration of l-NAME further increased sodium excretion, but blocked NO excretion; however, the increase in sodium excretion induced by l-NAME alone was lower, indicating that NO is partially mediating the increase in sodium excretion. It should be mentioned, however, that the increase in sodium excretion, mainly in the ANG II group, was associated with a marked decrease in UNO2−/NO3−, indicating that the UNO2−/NO3− comes from renal NO production in this model and is not the result of a nonspecific increased urinary sodium excretion.
In summary, these results indicate that chronic ANG II infusion upregulates intrarenal P2X1 receptors, which may contribute to increases in renal cortical vascular resistance observed in chronic ANG II-dependent hypertension. The results also indicate that in ANG II-infused rats, PPADS may elicit marked stimulation of NO which may also contribute to the reduced afferent and efferent arteriolar resistances in response to PPADS.
GRANTS
This study was supported by grant 79661 (M. Franco) from the National Council of Science and Technology (CONACYT, Mexico) National Institutes of Health Grants HL26371 (L. G. Navar) and P20RR017659.
DISCLOSURES
No conflicts of interest, financial or otherwise, are declared by the authors.
REFERENCES
- 1. Azar S, Tobian L, Johnson MA. Glomerular, efferent arteriolear, peritubular capillary, and tubular pressures in hypertension. Am J Physiol 227: 1045–1050, 1974 [DOI] [PubMed] [Google Scholar]
- 2. Bartolomew B. A rapid method for the assay of nitrite in urine using the nitrate reductase enzyme of Escherichia coli. Food Chem Toxicol 22: 241–243, 1984 [DOI] [PubMed] [Google Scholar]
- 3. Baylis C, Deen WM, Myers BD, Brenner BM. Effects of some vasodilator drugs on transcapillary fluid exchange in renal cortex. Am J Physiol 230: 1148–1158, 1976 [DOI] [PubMed] [Google Scholar]
- 4. Boyer JL, Zohn IE, Jacobson KA, Harden TK. Differential effects of P2-purinoceptor antagonists on phospholipase C-and adenyl cyclase coupled P2Y-purinoceptors. Br J Pharmacol 113: 614–620, 1994 [DOI] [PMC free article] [PubMed] [Google Scholar]
- 5. Burnstock G. Vessel tone and remodeling. Nat Med 12: 16–17, 2006 [DOI] [PubMed] [Google Scholar]
- 6. Buvinic S, Briones R, Huidobro-Toro JP. P2Y(1) and P2Y(2) receptors are coupled to the NO/cGMP pathway to vasodilate the rat arterial mesenteric bed. Br J Pharmacol 136: 847–856, 2002 [DOI] [PMC free article] [PubMed] [Google Scholar]
- 7. Chan CM, Unwin RJ, Bardini M, Oglesby IB, Ford AP, Townsend-Nicholson A, Burnstock G. Localization of P2X1 purinoceptors by autoradiography and immunohistochemistry in rat kidneys. Am J Physiol Renal Physiol 274: F799–F804, 1998 [DOI] [PubMed] [Google Scholar]
- 8. Chen BC, Lee CM, Lin WW. Inhibition of ecto-ATPase by PPADS, suramin and reactive blue in endothelial cells, C6 glioma cells and RAW 264.7 macrophages. Br J Pharmacol 119: 1628–1634, 1996 [DOI] [PMC free article] [PubMed] [Google Scholar]
- 9. Churchill PC, Ellis VR. Pharmacological characterization of the renovascular purinergic P2 receptors. J Pharmacol Exp Ther 265: 334–338, 1993 [PubMed] [Google Scholar]
- 10. Davidson WD, Sackner MA. Simplification of the anthrone method for the determination of inulin in clearance studies. J Lab Clin Med 62: 351–356, 1963 [PubMed] [Google Scholar]
- 11. Deen WM, Troy JL, Robertson CR, Brenner BM. Dynamics of glomerular filtration in the rat. IV. Determination of glomerular ultrafiltration coefficient. J Clin Invest 52: 1500–1580, 1973 [DOI] [PMC free article] [PubMed] [Google Scholar]
- 12. Dobrowolski L, Walkowska A, Kompanowska-Jezierska E, Kuczeriszka M, Sadowski J. Effects of ATP on rat renal haemodynamics and excretion: role of sodium intake, nitric oxide and cytochrome P 450. Acta Physiol 189: 77–85, 2007 [DOI] [PubMed] [Google Scholar]
- 13. Franco M, Bautista R, Pérez-Méndez O, González L, Pacheco U, Sánchez-Lozada LG, Santamaría J, Tapia E, Monreal R, Martínez F. Renal interstitial adenosine is increased in angiotensin II-induced hypertensive rats. Am J Physiol Renal Physiol 294: F84–F92, 2008 [DOI] [PubMed] [Google Scholar]
- 14. Franco M, Tapia E, Santamaria J, Zafra I, Garcia-Torres R, Gordon KL, Pons H, Rodríguez-Iturbe B, Johnson RJ, Herrera-Acosta J. Renal cortical vasoconstriction contributes to development of salt sensitive hypertension after angiotensin II exposure. J Am Soc Nephrol 12: 2263–2271, 2001 [DOI] [PubMed] [Google Scholar]
- 15. Graciano ML, Nishiyama A, Jacksopn K, Seth DM, Ortiz RM, Prieto-Carrasquero MC, Kobori H, Navar LG. Purinergic receptors contribute to early mesangial cell transformation and renal vessel hyperthrophy during angiotensin II-induced hypertension. Am J Physiol Renal Physiol 294: F161–F169, 2008 [DOI] [PMC free article] [PubMed] [Google Scholar]
- 16. Guan Z, Osmond DA, Inscho EW. Purinoceptors in the kidney. Exp Biol Med 232: 715–726, 2007 [PubMed] [Google Scholar]
- 17. Henry RJ, Segalove M, Sobel C. Turbidimetric determination of proteins with sulfosalicylic and trichloracetic acids. Proc Soc Exp Biol Med 92: 748–751, 1956 [DOI] [PubMed] [Google Scholar]
- 18. Ichihara A, Iming JD, Inscho EW, Navar LG. Interactive nitric oxide-angiotensin II influences on renal microcirculation in angiotensin II induced hypertension. Hypertension 31: 1255–1260, 1998 [DOI] [PubMed] [Google Scholar]
- 19. Inscho EW, Ohishi K, Navar LG. Effects of ATP on pre and postglomerular juxtamedullary microvasculature. Am J Physiol Renal Fluid Electrolyte Physiol 263: F886–F893, 1992 [DOI] [PubMed] [Google Scholar]
- 20. Jones CA, Chessell IP, Simon J, Barnard EA, Miller KJ, Michel AD, Humphrey PPA. Functional characterization of the P2X4 receptor orthologues. Br J Pharmacol 129: 388–394, 2000 [DOI] [PMC free article] [PubMed] [Google Scholar]
- 21. Lai EY, Fähling M, Ma Z, Källskog O, Persson PB, Patzak A, Persson AE, Hultström M. Norepinephrine increases calcium sensitivity of mouse afferent arteriole, thereby enhancing angiotensin II-mediated vasoconstriction. Kidney Int 76: 953–959, 2009 [DOI] [PubMed] [Google Scholar]
- 22. Lambrecht G. Design and pharmacology of selective P2-purinoceptors antagonists. J Auton Pharmacol 16: 341–344, 1996 [DOI] [PubMed] [Google Scholar]
- 23. Lambrecht G. Agonists and antagonists acting at P2X receptors: selectivity profiles and functional implications. Naunyn-Schmiedeberg's Arch Pharmacol 362: 340–350, 2000 [DOI] [PubMed] [Google Scholar]
- 24. Lewis CJ, Evans RJ. P2X receptor immunoreactivity in different arteries from the femoral, pulmonary, cerebral, coronary and renal circulations. J Vasc Res 38: 332–340, 2001 [DOI] [PubMed] [Google Scholar]
- 25. Lowry OH, Rosebrough NJ, Farr AL, Randall RJ. Protein measurement with the Folin phenol reagent. J Biol Chem 193: 265–275, 1951 [PubMed] [Google Scholar]
- 26. Nishiyama A, Majid DS, Taher KA, Miyatake A, Navar LG. Relation between renal interstitial ATP concentrations and autoregulation-mediated changes in renal vascular resistance. Cir Res 86: 656–662, 2000 [DOI] [PubMed] [Google Scholar]
- 27. Nishiyama A, Majid DS, Walter M, 3rd, Miyatake A, Navar LG. Renal Interstitial ATP responses to changes in arterial pressure during alterations in tubuloglomerular feedback activity. Hypertension 37: 753–759, 2001 [DOI] [PubMed] [Google Scholar]
- 28. Nishiyama A, Navar LG. ATP mediates tubuloglomerular feedback. Am J Physiol Regul Integr Comp Physiol 283: R273–R275, 2002 [DOI] [PubMed] [Google Scholar]
- 29. Osmond DA, Inscho EW. P2X1 receptor blockade inhibits whole kidney autoregulation of renal blood flow in vivo. Am J Physiol Renal Physiol 298: F1360–F1368, 2010 [DOI] [PMC free article] [PubMed] [Google Scholar]
- 30. Oyecan AO, McGiff JC. Functional response of the rat kidney to inhibition of nitric oxide synthesis: role of cytochrome p450-derived arachidonate metabolites. Br J Pharmacol 125: 1065–1073, 1998 [DOI] [PMC free article] [PubMed] [Google Scholar]
- 31. Rost S, Daniel C, Schultze-Lohoff E, Bäumert HG, Lambrecht G, Hugo C. P2 receptor antagonist PPADS inhibits mesangial cell proliferation in experimental mesangial proliferative glomerulonephritis. Kidney Int 62: 1659–1671, 2002 [DOI] [PubMed] [Google Scholar]
- 32. Sasser JM, Pollock JS, Pollock DM. Renal endothelin in chronic angiotensin II hypertension. Am J Physiol Regul Integr Comp Physiol 283: R243–R248, 2002 [DOI] [PubMed] [Google Scholar]
- 33. Takenaka T, Inoue T, Kanno Y, Okada H, Hill CE, Suzuki H. Connexins 37 and 40 transduce purinergic signals mediating renal autoregulation. Am J Physiol Regul Integr Comp Physiol 294: R1–R11, 2008 [DOI] [PubMed] [Google Scholar]
- 34. Turner CM, Vonend O, Chan C, Burnstock G, Unwin RJ. The pattern of distribution of selected ATP-sensitive P2 receptor subtypes in normal rat kidney: an immunohistological study. Cells Tissues Organs 175: 105–117, 2003 [DOI] [PubMed] [Google Scholar]
- 35. Viets JW, Deen WM, Troy JL, Brenner BM. Determination of serum protein concentration in nanoliter blood samples using fluorescamine or o,-phthalaldehyde. Anal Biochem 88: 513–521, 1978 [DOI] [PubMed] [Google Scholar]
- 36. Vurek GG, Pegram SE. Fluorometric method for the determination of nanogram quantities of inulin. Anal Biochem 16: 409–419, 1966 [Google Scholar]
- 37. Windscheif U, Ralevic V, Bäumert HG, Mutschler E, Lambrecht G, Burstock G. Vasoconstrictor and vasodilator responses to various agonists in the rat perfused mesenteric arterial bed: selective inhibition by PPADS of contraction mediated via P2X-purinoceptors. Br J Pharmacol 113: 1015–1021, 1994 [DOI] [PMC free article] [PubMed] [Google Scholar]
- 38. Yamamoto K, Sokabe T, Matsumoto T, Yoshimura K, Shibata M, Ohura Fukuda T N, Sato T, Sekine K, Kato S, Isshiki M, Fujita T, Kobayashi M, Kawamura K, Masuda H, Kamiya A, Ando J. Impaired flow-dependent control of vascular tone and remodeling in P2X4-deficient mice. Nat Med 12: 133–137, 2006 [DOI] [PubMed] [Google Scholar]
- 39. Zhao X, Cook AK, Field M, Edwards B, Zhang S, Zhang Z, Pollock JS, Imig JD, Inscho EW. Impaired Ca2+ signaling attenuates P2X receptor-mediated vasoconstriction of afferent arterioles in angiotensin II hypertension. Hypertension 46: 562–568, 2005 [DOI] [PubMed] [Google Scholar]
- 40. Zhao X, Inscho EW, Bondlela M, Falk JR, Imig J. The CYP450 hydroxylase pathway contributes to P2X receptor-mediated afferent arteriolar vasoconstriction. Am J Physiol Heart Circ Physiol 281: H2089–H2096, 2001 [DOI] [PubMed] [Google Scholar]


