Abstract
Mitochondria are crucial organelles in cell life serving as a source of energy production and as regulators of Ca2+ homeostasis, apoptosis, and development. Mitochondria frequently change their shape by fusion and fission, and recent research on these morphological dynamics of mitochondria has highlighted their role in normal cell physiology and disease. In this study, we investigated the effect of high glucose on mitochondrial dynamics in neonatal cardiac myocytes (NCMs). High-glucose treatment of NCMs significantly decreased the level of optical atrophy 1 (OPA1) (mitochondrial fusion-related protein) protein expression. NCMs exhibit two different kinds of mitochondrial structure: round shape around the nuclear area and elongated tubular structures in the pseudopod area. High-glucose-treated NCMs exhibited augmented mitochondrial fragmentation in the pseudopod area. This effect was significantly decreased by OPA1 overexpression. High-glucose exposure also led to increased O-GlcNAcylation of OPA1 in NCMs. GlcNAcase (GCA) overexpression in high-glucose-treated NCMs decreased OPA1 protein O-GlcNAcylation and significantly increased mitochondrial elongation. In addition to the morphological change caused by high glucose, we observed that high glucose decreased mitochondrial membrane potential and complex IV activity and that OPA1 overexpression increased both levels to the control level. These data suggest that decreased OPA1 protein level and increased O-GlcNAcylation of OPA1 protein by high glucose lead to mitochondrial dysfunction by increasing mitochondrial fragmentation, decreasing mitochondrial membrane potential, and attenuating the activity of mitochondrial complex IV, and that overexpression of OPA1 and GCA in cardiac myocytes may help improve the cardiac dysfunction in diabetes.
Keywords: hyperglycemia, mitochondrial dynamics, membrane potential, GlcNAcase, mitochondrial fission and fusion
hyperglycemia contributes to compromised myocardial contractile function and energy metabolism, which leads to enhanced morbidity and mortality in diabetes. Increasing evidence has shown that hyperglycemia is associated with attenuated mitochondrial Ca2+ homeostasis and altered mitochondrial membrane potential in cardiac myocytes, which subsequently induces dysfunction in cardiac myocytes (27, 38, 40, 45).
Recent work has highlighted the importance of mitochondrial morphological dynamics in cells and animal physiology. Because mitochondria constantly fuse and divide, an imbalance of these two processes dramatically alters overall mitochondrial morphology (4), and it is now clear that mitochondrial dynamics play important roles in mitochondrial function, including development, apoptosis, and functional complementation of mitochondrial DNA mutations by content mixing (5, 6, 19, 30, 32, 35, 43). Fused networks of connected mitochondria may also facilitate the transmission of Ca2+ signals and membrane potential within cells (39, 41).
Mitochondrial fusion in mammals requires at least three proteins: optical atrophy 1 (OPA1) and mitofusins 1 and 2 (MFN1, MFN2) (10). Dynamin-related protein 1 (DRP1), and fission 1 (FIS1) are essential for mitochondrial fission (5, 14), and it has been suggested that FIS1 recruits DRP1 from the cytosol to mitochondria for the fission reaction (29, 46). Each protein is associated with different kinds of disease, most of which are related to neuropathy (7, 8, 11, 13, 49). One study showed a change in DRP1 protein expression by hyperglycemia (25), while another study indicated a close relationship between MFN2 and type 2 diabetes and obesity (2, 3).
Activation of the hexosamine biosynthetic pathway by diabetes results in O-linked β-N-acetylglucosaminylation (O-GlcNAcylation) of Ser/Thr residues of cytoplasmic and nuclear proteins. Attachment of O-GlcNAc is reversible, with enzymes catalyzing addition (O-GlcNAc transferase) and removal [O-GlcNAcase (GCA)] (17, 42). Protein functions are regulated by post-translational modification, including O-GlcNAcylation. So far, more than 500 proteins have been found to be O-GlcNAcylated (26, 48), and the hyperglycemia of diabetes promotes further increase in protein O-GlcNAcylation. There is, however, no direct evidence demonstrating the morphological and functional change in mitochondria by protein O-GlcNAcylation.
In this study, we demonstrate that high-glucose treatment increases mitochondrial fragmentation, decreases OPA1 protein expression, and augments OPA1 O-GlcNAcylation in neonatal cardiac myocytes (NCMs). Furthermore, the decrease in protein O-GlcNAcylation by GCA overexpression increases mitochondrial tubular formation. OPA1 overexpression restores mitochondrial membrane potential, suggesting that the decrease in mitochondrial fragmentation by GCA overexpression in cardiac myocytes has a beneficial effect on mitochondrial function in diabetes.
MATERIALS AND METHODS
Materials.
Low-glucose Dulbecco's modified Eagle's medium (l-DMEM), M199, antibiotic reagents, MitoTracker Green FM, and JC-1 were purchased from Invitrogen (Carlsbad, CA). Anti-OPA1, MFN1, MFN2, DRP1, FIS1, and anti-actin from Santa Cruz Biotechnology (Santa Cruz, CA) were used for Western blot analysis. Wheat germ agglutinin (WGA)-conjugated beads was purchased from Vector Laboratories (Burlingame, CA). Collagenase II was purchased from Worthington Biochemical (Lakewood, NJ). All other chemicals were from Sigma-Aldrich, (St. Louis, MO).
Cardiomyocyte isolation and culture.
Primary cultures of NCMs were prepared as described previously (20). All investigations conformed to the Guide for the Care and Use of Laboratory Animals published by the National Institutes of Health (NIH Publication No. 85-23, Rev. 1985), and the animal use protocols were approved by the Institutional Animal Care and Use Committee at the University of California, San Diego. Cells were plated onto gelatin-coated glass-chamber slides. Plating medium consisted of 4.25:1 l-DMEM: M199, 10% horse serum, 5% FBS, and 1% penicillin/streptomycin/fungizone. Cells were allowed to adhere to the plates for 24 h before changing to basic experimental culture medium (4.5:1 l-DMEM: M199, 2% FBS, and 1% penicillin/streptomycin/fungizone).
In vitro high-glucose treatment of NCMs.
For high-glucose (HG) treatment, 30 mM glucose was added to the media (the final glucose concentration was 35 mM). In a control group of cells, equimolar mannitol was added to exclude the potential effect of changes in osmolarity [normal glucose (NG): glucose concentration, 5 mM]. After 24 h, NCMs were used for the measurement of mitochondrial fission and OPA1 protein expression.
Construction of adenoviral vectors.
The mouse OPA1 was cloned from mouse cDNA using the following primers (5′-3′): ACGGGGTACCGGATGTGGCGAGCAGGTCGGGCGGC; ACGCGTCGACCTACTTCTCCTGGTGAAGAGCTTCA. The PCR product was inserted into the E1 region of an adenoviral vector construct (SR-) using restriction enzymes Kpn I and Sal I. The cDNA corresponding to the human GCA, was kindly provided by G. Hart (17). This cDNA was inserted into the E1 region of an adenoviral vector construct. Replication-deficient adenovirus particles containing the target gene or empty vector (Control-Adv) were generated by in vivo recombination in 293 cells, and single plaques were isolated and propagated to achieve high titer. Adenoviral particles were CsCl purified and quantified by plaque titer assay. After NCM isolation, cells were transduced at a concentration of 100 pfu/cell for 48 h.
Western blot analysis.
After culturing NCMs for 24 h in HG or NG, cells were lysed and centrifuged at 16,000 g for 10 min at 4°C. Supernatants were used as sample protein. Samples were separated on SDS-PAGE and transferred to nitrocellulose membranes. Blots were then incubated with a primary antibody (anti-OPA, anti-MFN1, anti-MFN2, anti-DRP1, anti-FIS1 [1:1,000], or anti-porin [1:4,000]) followed by incubation with an HRP-conjugated secondary antibody. The immunoblots were detected with SuperSignal West Pico reagent (Thermo Fisher Scientific, Rockford, IL). Band intensity was normalized to actin controls and expressed in arbitrary units.
Detection of glycosylated OPA1 with WGA-conjugated beads.
WGA-conjugated beads were used to precipitate the O-GlcNAcylated OPA1, as described previously (15). Cell lysates from NCMs were incubated with beads overnight. After incubation, WGA-conjugated beads were centrifuged at 2,300 g for 5 min, and resuspended with 2 × Laemmli buffer. Samples were loaded in the gel, as described above for Western blot analysis.
Quantification of mitochondrial fission and fusion in living cells.
After 24 h of HG treatment, mitochondrial morphology was observed. Cells were stained with 10−7 M MitoTracker Green FM for 30 min to visualize mitochondrial morphology and then washed 3 times with media. Images were captured with a DeltaVision deconvolution microscope system (Applied Precision, Issaquah, WA) located at the University of California, San Diego Cancer Center microscope facility. Using a 60× (numerical aperture 1.4) lens, images of ∼50 serial optical sections, spaced by 0.2 μm, were acquired. The data sets were deconvolved using SoftWorx software (Applied Precision) on a Silicon Graphics Octane workstation. Since cardiomyocytes have two different types of mitochondrial structure (center: round, pseudopod area: tubular) and we observed morphological change with HG treatment only in the pseudopod area, we eliminated the center area and analyzed only the pseudopod area, where thickness is less than 0.6 μm. The morphological changes are described using the parameter of roundness [(perimeter length)2/(4 × π × area)] using ImagePro-PLUS software (Media Cybernetics, Silver Spring, MD). Fusion/Fission ratio was calculated by number of elongated mitochondria (roundness ≥3)/number of fragmented mitochondria (roundness <3).
Mitochondrial membrane potential measurement.
Mitochondrial membrane potential in NCMs was measured by JC-1 (a lipophilic and cationic dye that exhibits potential-dependent accumulation in negatively charged mitochondria). NCMs were loaded with 0.5 mM JC-1 at 37°C for 15 min and washed twice with media. The cells were visualized under a Nikon Diaphot epi-fluorescence microscope equipped with a 40× Fluor objective interfaced to a Photon Technologies, dual-emission system, with the excitation wavelength set to 485 nm via a monocromator. Fluorescence emission was split and directed to two photomultiplier tubes through 20-nm band-pass filters centered at 531 and 584 nm, respectively. In addition, an aperture mechanism allowed fluorescence to be collected from a selected portion of the field, which was always positioned over the cytoplasmic region of individual cells. Data were shown as a ratio (F531/F584). Mitochondrial depolarization is indicated by an increase in the green (F531)/red (F584) fluorescence intensity ratio.
Polarographic assay to measure complex IV activity.
The activity of complex IV of the mitochondrial respiration chain was measured according to a previously described protocol (20). After treatment described above, NCMs were trypsinized and permeabilized by incubation with digitonin (10 μg/ml) in medium A (in mmol/l: 20 HEPES, 250 sucrose, 10 MgCl2, pH 7.1) for 10 min. Protein concentration in each sample was measured. Samples with equal amounts of protein were used for complex function measurement. Oxygen consumption was measured in permeabilized NCMs using a Clark-type oxygen electrode (Yellow Springs Instruments, Yellow Springs, CO) in a thermoregulated chamber set at 37°C. Complex IV activity is defined as the rate of oxygen consumption in the presence of the specific substrates ascorbate and N,N,N′,N′-tetramethyl-p-phenylenediamine. Sodium cyanide was used as an inhibitor of complex IV. The data were calculated and expressed as nmol O2·min−1·mg protein−1.
Statistical analysis.
Values are expressed as means ± SE. In the case of mitochondrial roundness, the roundness of individual mitochondria (mitochondria number was 500–1,500 per cell) was measured, and the average individual mitochondrial roundness per cell was calculated. The average individual mitochondrial roundness from each cell was used to calculate the means ± SE (10–12 cells per experiment). Bonferroni tests for multiple statistical comparisons and Student's t-test for unpaired samples were carried out to identify significant differences. Differences were considered to be statistically significant when P < 0.05.
RESULTS
Exposure of NCMs to high glucose significantly decreased mitochondrial OPA1 and MFN1 protein expression, increased FIS1 protein expression, and increased mitochondrial fragmentation.
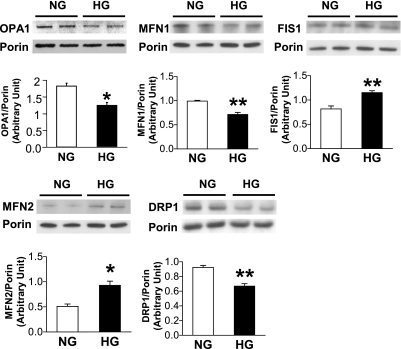
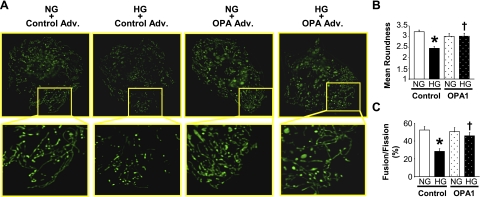
OPA1 is an essential component of the mitochondrial fusion machinery. We tested whether high-glucose exposure of NCMs affects mitochondrial fusion- and fission-related protein expression and mitochondrial morphology. Figure 1 demonstrates that high-glucose treatment of NCMs significantly decreased OPA1 and MFN1 protein expression (OPA1, NG: 1.82 ± 0.09; OPA1, HG: 1.23 ± 0.08, P < 0.05 vs. NG, n = 4 for each group. MFN1, NG: 0.99 ± 0.02, MFN1, HG: 0.71 ± 0.04, P < 0.05 vs. NG, n = 3 for each group), whereas FIS1 was significantly increased by high-glucose treatment (FIS1, NG: 0.82 ± 0.06, FIS1, HG: 1.15 ± 0.04, P < 0.05 vs. NG, n = 3 for each group). Mitochondria in control NCMs exhibit elongated tubular structures, whereas NCMs treated with high glucose exhibit augmented mitochondrial fragmentation. In addition, OPA1 overexpression significantly increased mitochondrial elongation in high-glucose-treated NCMs (Fig. 2). These data suggest that increased mitochondrial fragmentation by high glucose might be, at least in part, caused by OPA1 protein downregulation.
Fig. 1.
High-glucose treatment in neonatal cardiac myocytes (NCMs) significantly decreased optical atrophy 1 (OPA1) and mitofusins 1 (MFN1) protein expression, while fission 1 (FIS1) protein expression was significantly increased. NCMs were exposed to high glucose (HG; 35 mM glucose), and protein expression level was determined by Western blot analysis. To maintain the osmolarity of the control NCMs, we added equimolar mannitol to the normal glucose media (NG; final glucose concentration is 5 mM). OPA1, MFN1, and FIS1 protein expression were significantly altered by HG. Data are expressed as means ± SE. OPA1; n = 4, other proteins; n = 3. *P < 0.05 vs. NG. **P < 0.01 vs. NG.
Fig. 2.
Overexpression of OPA1 attenuates high-glucose-induced mitochondrial fragmentation in NCMs. A: photomicrographs show typical images of mitochondria in NCMs. Images in boxed areas (top) were taken with a 60× objective and are shown magnified below. NCMs were transduced with OPA1 Adv. or control Adv. for 24 h. NCMs were then exposed to HG or NG for 24 h. There are elongated mitochondrial tubules in the lamellipodia of NCMs exposed to NG, while HG exposure induced mitochondrial fragmentation. OPA1 transduction significantly attenuated HG-induced fragmentation. Mitochondrial morphological change is analyzed by the mean roundness (B) and fusion/fission ratio (fusion = roundness>3) (C). For each group, n = 10–12 NCMs. Data are expressed as means ± SE. *P < 0.05 vs. NG. †P < 0.05 vs. control Adv.
Protein O-GlcNAcylation by high glucose leads to mitochondrial fragmentation.
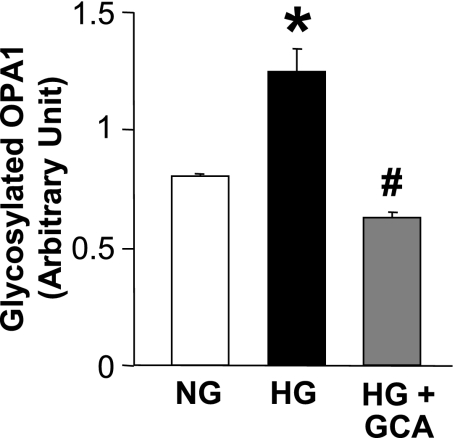
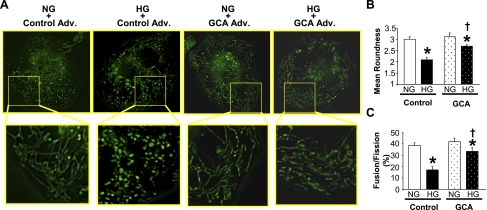
Protein O-GlcNAcylation is involved in posttranslational protein modification, which modulates protein function (26, 48). As shown in Fig. 3, high-glucose treatment significantly increased OPA1 O-GlcNAcylation and GCA overexpression decreased OPA1 O-GlcNAcylation (NG: 0.81 ± 0.01, HG: 1.25 ± 0.10, HG+GCA: 0.63 ± 0.02, P < 0.05 vs. NG, P < 0.05 vs. HG, n = 3 for each group). Interestingly, the decrease in protein O-GlcNAcylation by GCA transfection significantly increased mitochondrial elongation in high-glucose-treated NCMs (Fig. 4), suggesting that not only decreased OPA1 protein expression but also increased OPA1 O-GlcNAcylation contributes to the increase in mitochondrial fragmentation under high-glucose treatment.
Fig. 3.
High glucose increases OPA1 glycosylation, which is restored by GCA. NCMs were infected by control or GlcNAcase (GCA) Adv for 24 h. Cells were washed and treated with NG or HG for 24 h. Glycosylated proteins were immunoprecipitated using WGA beads, and Western blot analysis was performed with the OPA1 antibody. For each group, n = 3. Data are expressed as means ± SE. *P < 0.05 vs. NG. #P < 0.05 vs. HG.
Fig. 4.
Overexpression of GCA attenuates high-glucose-induced mitochondrial fragmentation in NCMs. A: photomicrographs show typical images of mitochondrial morphology in NCMs. Images in boxed areas (top) were taken with a 60× objective and are shown magnified below. NCMs were transduced with GCA Adv. or control Adv. for 24 h. NCMs were then exposed to HG or NG for 24 h. GCA transduction significantly attenuated HG-induced fragmentation. Mitochondrial morphological change is analyzed by the mean roundness (B) and fusion/fission ratio (fusion = roundness > 3) (C). Data are expressed as means ± SE; n = 12 NCMs. *P < 0.05 vs. NG. †P < 0.05 vs. control Adv.
High-glucose treatment of NCMs decreases mitochondrial membrane potential, and OPA1 or GCA overexpression increases the value close to the level in the control cells.
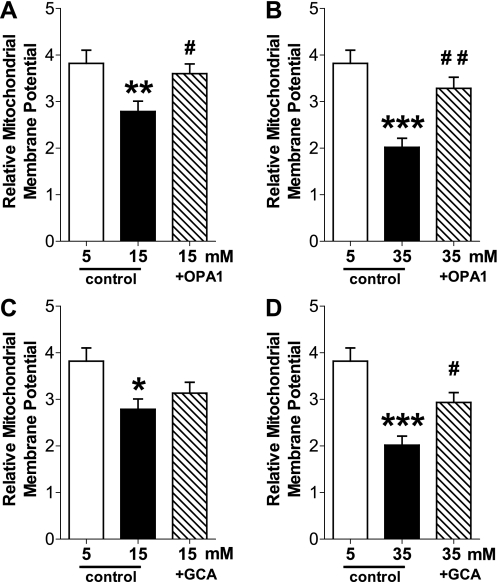
Decreased mitochondrial membrane potential attenuates mitochondrial Ca2+ release from the mitochondria, and it is one of the causes of contractile dysfunction in cardiac myocytes in diabetes. To investigate whether mitochondrial fusion contributes to the determination of mitochondrial membrane potential, we tested the effect of OPA1 overexpression on mitochondrial membrane potential in NCMs. High-glucose treatment significantly decreased mitochondrial membrane potential. This decrease was prevented by OPA1 overexpression (Fig. 5A), suggesting that mitochondria preserve membrane potential by maintaining an elongated conformation. In addition, GCA overexpression in high-glucose-treated NCMs increased mitochondrial membrane potential close to the control levels (Fig. 5B), implying that the decreased OPA1 O-GlcNAcylation by GCA overexpression restores the elongated mitochondrial conformation, and subsequently improves mitochondrial membrane potential under hyperglycemia.
Fig. 5.
High glucose decreases mitochondrial membrane potential, and OPA1 or GCA overexpression increases the level to the control level. NCMs were transduced with control Adv., OPA1 Adv., or GCA Adv. for 24 h. Cells were washed and treated with normal glucose (5 mM) or high glucose (15 mM or 35 mM) for 24 h. High-glucose treatment significantly decreased mitochondrial membrane potential and OPA1 (A, B) or GCA (C, D) overexpression significantly increased membrane potential in high-glucose-treated cells. Data are expressed as means ± SE; n = 26–31 NCMs. *P < 0.05 vs. 5 mM glucose-treated NCMs. **P < 0.01 vs. 5 mM. ***P < 0.001 vs. 5 mM. #P < 0.05 vs. 15 mM or 35 mM. ##P < 0.01 vs. 35 mM.
OPA1 overexpression increases the activity of mitochondrial complex IV in high-glucose-treated NCMs.
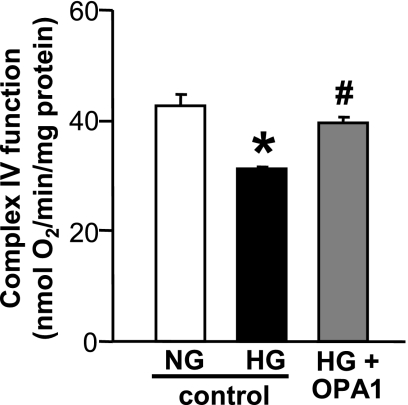
Activity of mitochondrial complex IV was measured in NCMs treated with normal glucose, high glucose, or high glucose + OPA1 Adv (Fig. 6). High-glucose treatment significantly decreased the activity of mitochondrial complex IV, and OPA1 transduction significantly increased the activity to the control level. Those data suggest that the increase in mitochondrial fusion by OPA1 transduction helps restore mitochondrial function in high-glucose-treated NCMs.
Fig. 6.
Activity of mitochondrial complex IV was significantly attenuated by high-glucose treatment and the attenuation was improved by OPA1 transduction in NCMs. Data are expressed as means ± SE; n = 3. *P < 0.05 vs. NG. #P < 0.05 vs. HG.
DISCUSSION
The major findings of our study are that high glucose leads to mitochondrial fragmentation and decreased mitochondrial membrane potential and that decreasing protein O-GlcNAcylation by GCA overexpression restores the mitochondrial morphological changes, which subsequently increases mitochondrial membrane potential and might improve mitochondrial function.
Mitochondria are dynamic organelles that move, fuse, and divide and can appear as a network of elongated and interconnected filaments, as a collection of particles, or as a mixture of both. The length and interconnectivity of mitochondria is determined by the equilibrium of fusion and fission reactions (24, 36); however, we cannot infer whether fragmentation results from increased fission, decreased fusion, or both. Recent reports have shown that OPA1 and MFN 1 and 2 are essential for mitochondrial fusion, whereas FIS1 and DRP1 are essential for mitochondrial fission (5, 10, 14). There is increasing evidence to show that increased mitochondrial fission disrupts normal function of different kinds of cells and may cause organ failure and systemic disease. The predominant gene responsible for autosomal-dominant optic atrophy has been identified as OPA1 (11, 13). Another study shows a naturally occurring neuropathy is associated with MFN2 mutation (49). In addition, MFN2 was identified as a suppressor of obesity (2, 3) and hypertension (8). We have recently demonstrated that mitochondrial fragmentation in coronary endothelial cells is associated with altered protein expression of DRP1 and OPA1 in diabetes (28). In this study, we demonstrate that high-glucose treatment significantly decreases OPA1 protein expression and increases mitochondrial fragmentation in NCMs. In addition, overexpression of OPA1 restores high-glucose-induced mitochondrial fragmentation (Figs. 1 and 2), suggesting that the decrease in OPA1 protein expression might be, at least in part, one of the causes of increased mitochondrial fragmentation by high glucose. In addition to fusion/fission-related proteins, high-glucose-induced mitochondrial fragmentation can also be caused by other mediators [e.g., reactive oxidative species (28, 37, 47) and mitochondrial membrane potential, as described below].
Posttranslational modifications of fusion/fission proteins also regulate mitochondrial morphology. It has been shown that DRP1 S-nitrosylation augments the DRP1-induced mitochondrial fragmentation (9). The stimulation of small ubiquitin-like modifier-1 conjugation to DRP1 (sumoylation of DRP1) stabilizes the association of DRP1 with mitochondrial membranes (44). Figure 3 shows that high-glucose treatment significantly increases OPA1 O-GlcNAcylation, and GCA overexpression decreases the level of OPA1 O-GlcNAcylation. It remains unclear whether O-GlcNAcylation of OPA1 affects the function of OPA1 and which residues are O-GlcNAcylated in the OPA1 protein. Additional experiments are required to explore the details. In this study, we show that high-glucose-induced protein O-GlcNAcylation regulates mitochondrial morphology, and the decrease in protein O-GlcNAcylation by GCA overexpression helps to increase mitochondrial elongation in high-glucose-treated NCMs (Fig. 4).
Mitochondrial membrane potential is the central bioenergetic parameter that controls respiratory rate, ATP synthesis, and the generation of reactive oxygen species, and is itself controlled by electron transport and proton leaks (31). We first measured and compared the mitochondrial membrane potential between normal-glucose- and high-glucose-treated NCMs. As shown in Fig. 5A, high glucose significantly decreased mitochondrial membrane potential. It is, however, unclear whether the decrease in mitochondrial membrane potential by high glucose is caused by mitochondrial fragmentation or by other mediators at this moment. Interestingly, OPA1 overexpression significantly increased mitochondrial membrane potential in high-glucose-treated NCMs, suggesting that this increase in mitochondrial membrane potential is, at least in part, the result of mitochondrial fusion. In addition, GCA overexpression was able to restore the mitochondrial membrane potential in high-glucose-treated NCMs. The recovery of membrane potential by GCA overexpression in high-glucose-treated NCMs might be not only due to augmented mitochondrial fusion through decreased OPA1 protein O-GlcNAcylation, but also due to decreased O-GlcNAcylation of other proteins. Further experimentation is required to define the role of OPA1 protein O-GlcNAcylation in the regulation of mitochondrial membrane potential.
Loss of mitochondrial membrane potential by high glucose treatment has been reported in different cell types (16, 21, 27). In mitochondria, the uptake of Ca2+ is driven by membrane potential and mediated by an electrogenic uniporter, the activity of which is triggered by a rise in intracellular calcium concentration and depends on the high inner mitochondrial membrane potential (1). Thus, it is important to maintain the membrane potential to keep the proper Ca2+ concentration in mitochondria. Increase in mitochondrial membrane potential by mitochondrial fusion, which was induced by OPA1 overexpression, may thereby help decrease mitochondrial dysfunction, resulting from hyperglycemia. It has to be noted that mitochondrial morphology can be regulated by the mitochondrial membrane potential. Carbonyl cyanide 3-chlorophenylhydrazone (cccp, ionophore) can selectively increase the mitochondrial membrane potential and cccp treatment for several hours leads to massive mitochondrial fragmentation mediated by ongoing DRP1-mediated fission (24). The removal of cccp and the concomitant recovery of mitochondrial membrane potential are paralleled by fusion-mediated reformation of mitochondrial filaments (12, 23, 24). Several studies have also reported that mitochondrial membrane depolarization is paralleled by the proteolytic processing of long OPA1 isoforms to short OPA1 isoforms and mitochondrial fragmentation (12, 18, 22). Those findings imply that mitochondrial membrane potential is essential for membrane fusion/fission.
The electron transport chain (ETC) is one of the important functions of mitochondria: the ETC transfers H+ ions across the membrane to the intermembrane space in mitochondria, and these H+ ions are used for ATP generation. There are four mitochondrial redox carriers (complexes I-IV), and there is increasing evidence showing that the function of complexes are decreased in diabetes (33, 34). In this study, we found that the activity of complex IV was significantly decreased in high-glucose-treated NCMs, and OPA1 overexpression significantly increased the complex IV activity (Fig. 6). It will be necessary to define the detailed mechanism in which mitochondrial fusion regulates complex IV. Taken together, the data in Figs. 5 and 6 suggest that increased mitochondrial fission by OPA1 transduction improves mitochondrial function in diabetic NCMs.
Our data suggest that a decreased level of OPA1 protein and increased O-GlcNAcylation of OPA1 protein by high glucose lead to mitochondrial dysfunction by increasing mitochondrial fragmentation, decreasing mitochondrial membrane potential, and attenuating the activity of mitochondrial complex IV and overexpression of GCA in cardiac myocytes may help improve the cardiac dysfunction in diabetes.
Perspectives and Significance
In summary, hyperglycemia increases mitochondrial fragmentation and causes dysfunction in cardiac myocytes; overexpression of OPA1 or reduction of OPA1 O-Glycosylation by GCA transfection leads to increased mitochondrial fusion and subsequently helps attenuate cardiac dysfunction in diabetes.
GRANTS
This work was supported by the grants of HL66917 and MD00220 (to W. H. Dillmann) and DK083506 (to A. Makino) from the National Institutes of Health and from the Deutsche Forschungsgemeinschaft (to T. Gawlowski).
DISCLOSURES
No conflicts of interest, financial or otherwise, are declared by the authors.
REFERENCES
- 1. Antigny F, Girardin N, Raveau D, Frieden M, Becq F, Vandebrouck C. Dysfunction of mitochondria Ca2+ uptake in cystic fibrosis airway epithelial cells. Mitochondrion 9: 232–241, 2009 [DOI] [PubMed] [Google Scholar]
- 2. Bach D, Naon D, Pich S, Soriano FX, Vega N, Rieusset J, Laville M, Guillet C, Boirie Y, Wallberg-Henriksson H, Manco M, Calvani M, Castagneto M, Palacin M, Mingrone G, Zierath JR, Vidal H, Zorzano A. Expression of Mfn2, the Charcot-Marie-Tooth neuropathy type 2A gene, in human skeletal muscle: effects of type 2 diabetes, obesity, weight loss, and the regulatory role of tumor necrosis factor alpha and interleukin-6. Diabetes 54: 2685–2693, 2005 [DOI] [PubMed] [Google Scholar]
- 3. Bach D, Pich S, Soriano FX, Vega N, Baumgartner B, Oriola J, Daugaard JR, Lloberas J, Camps M, Zierath JR, Rabasa-Lhoret R, Wallberg-Henriksson H, Laville M, Palacin M, Vidal H, Rivera F, Brand M, Zorzano A. Mitofusin-2 determines mitochondrial network architecture and mitochondrial metabolism. A novel regulatory mechanism altered in obesity. J Biol Chem 278: 17190–17197, 2003 [DOI] [PubMed] [Google Scholar]
- 4. Bereiter-Hahn J, Voth M. Dynamics of mitochondria in living cells: shape changes, dislocations, fusion, and fission of mitochondria. Microsc Res Tech 27: 198–219, 1994 [DOI] [PubMed] [Google Scholar]
- 5. Chan DC. Mitochondrial fusion and fission in mammals. Annu Rev Cell Dev Biol 22: 79–99, 2006 [DOI] [PubMed] [Google Scholar]
- 6. Chen H, Chan DC. Emerging functions of mammalian mitochondrial fusion and fission. Hum Mol Genet 14 Spec No 2: R283–R289, 2005 [DOI] [PubMed] [Google Scholar]
- 7. Chen H, Detmer SA, Ewald AJ, Griffin EE, Fraser SE, Chan DC. Mitofusins Mfn1 and Mfn2 coordinately regulate mitochondrial fusion and are essential for embryonic development. J Cell Biol 160: 189–200, 2003 [DOI] [PMC free article] [PubMed] [Google Scholar]
- 8. Chen KH, Guo X, Ma D, Guo Y, Li Q, Yang D, Li P, Qiu X, Wen S, Xiao RP, Tang J. Dysregulation of HSG triggers vascular proliferative disorders. Nat Cell Biol 6: 872–883, 2004 [DOI] [PubMed] [Google Scholar]
- 9. Cho DH, Nakamura T, Fang J, Cieplak P, Godzik A, Gu Z, Lipton SA. S-nitrosylation of Drp1 mediates beta-amyloid-related mitochondrial fission and neuronal injury. Science 324: 102–105, 2009 [DOI] [PMC free article] [PubMed] [Google Scholar]
- 10. Cipolat S, Martins de Brito O, Dal Zilio B, Scorrano L. OPA1 requires mitofusin 1 to promote mitochondrial fusion. Proc Natl Acad Sci USA 101: 15927–15932, 2004 [DOI] [PMC free article] [PubMed] [Google Scholar]
- 11. Delettre C, Lenaers G, Griffoin JM, Gigarel N, Lorenzo C, Belenguer P, Pelloquin L, Grosgeorge J, Turc-Carel C, Perret E, Astarie-Dequeker C, Lasquellec L, Arnaud B, Ducommun B, Kaplan J, Hamel CP. Nuclear gene OPA1, encoding a mitochondrial dynamin-related protein, is mutated in dominant optic atrophy. Nat Genet 26: 207–210, 2000 [DOI] [PubMed] [Google Scholar]
- 12. Duvezin-Caubet S, Jagasia R, Wagener J, Hofmann S, Trifunovic A, Hansson A, Chomyn A, Bauer MF, Attardi G, Larsson NG, Neupert W, Reichert AS. Proteolytic processing of OPA1 links mitochondrial dysfunction to alterations in mitochondrial morphology. J Biol Chem 281: 37972–37979, 2006 [DOI] [PubMed] [Google Scholar]
- 13. Ferre M, Amati-Bonneau P, Tourmen Y, Malthiery Y, Reynier P. eOPA1: an online database for OPA1 mutations. Hum Mutat 25: 423–428, 2005 [DOI] [PubMed] [Google Scholar]
- 14. Frazier AE, Kiu C, Stojanovski D, Hoogenraad NJ, Ryan MT. Mitochondrial morphology and distribution in mammalian cells. Biol Chem 387: 1551–1558, 2006 [DOI] [PubMed] [Google Scholar]
- 15. Gandy JC, Rountree AE, Bijur GN. Akt1 is dynamically modified with O-GlcNAc following treatments with PUGNAc and insulin-like growth factor-1. FEBS Lett 580: 3051–3058, 2006 [DOI] [PMC free article] [PubMed] [Google Scholar]
- 16. Gao CL, Zhu C, Zhao YP, Chen XH, Ji CB, Zhang CM, Zhu JG, Xia ZK, Tong ML, Guo XR. Mitochondrial dysfunction is induced by high levels of glucose and free fatty acids in 3T3–L1 adipocytes. Mol Cell Endocrinol 320: 25–33 [DOI] [PubMed] [Google Scholar]
- 17. Gao Y, Wells L, Comer FI, Parker GJ, Hart GW. Dynamic O-glycosylation of nuclear and cytosolic proteins: cloning and characterization of a neutral, cytosolic beta-N-acetylglucosaminidase from human brain. J Biol Chem 276: 9838–9845, 2001 [DOI] [PubMed] [Google Scholar]
- 18. Guillery O, Malka F, Landes T, Guillou E, Blackstone C, Lombes A, Belenguer P, Arnoult D, Rojo M. Metalloprotease-mediated OPA1 processing is modulated by the mitochondrial membrane potential. Biol Cell 100: 315–325, 2008 [DOI] [PubMed] [Google Scholar]
- 19. Heath-Engel HM, Shore GC. Mitochondrial membrane dynamics, cristae remodelling and apoptosis. Biochim Biophys Acta 1763: 549–560, 2006 [DOI] [PubMed] [Google Scholar]
- 20. Hu Y, Suarez J, Fricovsky E, Wang H, Scott BT, Trauger SA, Han W, Oyeleye MO, Dillmann WH. Increased enzymatic O-GlcNAcylation of mitochondrial proteins impairs mitochondrial function in cardiac myocytes exposed to high glucose. J Biol Chem 284: 547–555, 2009 [DOI] [PMC free article] [PubMed] [Google Scholar]
- 21. Huang TJ, Price SA, Chilton L, Calcutt NA, Tomlinson DR, Verkhratsky A, Fernyhough P. Insulin prevents depolarization of the mitochondrial inner membrane in sensory neurons of type 1 diabetic rats in the presence of sustained hyperglycemia. Diabetes 52: 2129–2136, 2003 [DOI] [PubMed] [Google Scholar]
- 22. Ishihara N, Fujita Y, Oka T, Mihara K. Regulation of mitochondrial morphology through proteolytic cleavage of OPA1. EMBO J 25: 2966–2977, 2006 [DOI] [PMC free article] [PubMed] [Google Scholar]
- 23. Ishihara N, Jofuku A, Eura Y, Mihara K. Regulation of mitochondrial morphology by membrane potential, and DRP1-dependent division and FZO1-dependent fusion reaction in mammalian cells. Biochem Biophys Res Commun 301: 891–898, 2003 [DOI] [PubMed] [Google Scholar]
- 24. Legros F, Lombes A, Frachon P, Rojo M. Mitochondrial fusion in human cells is efficient, requires the inner membrane potential, and is mediated by mitofusins. Mol Biol Cell 13: 4343–4354, 2002 [DOI] [PMC free article] [PubMed] [Google Scholar]
- 25. Leinninger GM, Backus C, Sastry AM, Yi YB, Wang CW, Feldman EL. Mitochondria in DRG neurons undergo hyperglycemic mediated injury through Bim, Bax and the fission protein Drp1. Neurobiol Dis 23: 11–22, 2006 [DOI] [PubMed] [Google Scholar]
- 26. Love DC, Hanover JA. The hexosamine signaling pathway: deciphering the “O-GlcNAc code”. Sci STKE 2005: re13, 2005 [DOI] [PubMed] [Google Scholar]
- 27. Ma H, Li SY, Xu P, Babcock SA, Dolence EK, Brownlee M, Li J, Ren J. Advanced glycation endproduct (AGE) accumulation and AGE receptor (RAGE) up-regulation contribute to the onset of diabetic cardiomyopathy. J Cell Mol Med 13: 1751–1764, 2009 [DOI] [PMC free article] [PubMed] [Google Scholar] [Retracted]
- 28. Makino A, Scott BT, Dillmann WH. Mitochondrial fragmentation and superoxide anion production in coronary endothelial cells from a mouse model of type 1 diabetes. Diabetologia 53: 1783–1794, 2010 [DOI] [PMC free article] [PubMed] [Google Scholar]
- 29. Mozdy AD, McCaffery JM, Shaw JM. Dnm1p GTPase-mediated mitochondrial fission is a multi-step process requiring the novel integral membrane component Fis1p. J Cell Biol 151: 367–380, 2000 [DOI] [PMC free article] [PubMed] [Google Scholar]
- 30. Nakada K, Inoue K, Ono T, Isobe K, Ogura A, Goto YI, Nonaka I, Hayashi JI. Inter-mitochondrial complementation: mitochondria-specific system preventing mice from expression of disease phenotypes by mutant mtDNA. Nat Med 7: 934–940, 2001 [DOI] [PubMed] [Google Scholar]
- 31. Nicholls DG. Mitochondrial membrane potential and aging. Aging Cell 3: 35–40, 2004 [DOI] [PubMed] [Google Scholar]
- 32. Ono T, Isobe K, Nakada K, Hayashi JI. Human cells are protected from mitochondrial dysfunction by complementation of DNA products in fused mitochondria. Nat Genet 28: 272–275, 2001 [DOI] [PubMed] [Google Scholar]
- 33. Rabol R, Hojberg PM, Almdal T, Boushel R, Haugaard SB, Madsbad S, Dela F. Effect of hyperglycemia on mitochondrial respiration in type 2 diabetes. J Clin Endocrinol Metab 94: 1372–1378, 2009 [DOI] [PubMed] [Google Scholar]
- 34. Schiff M, Loublier S, Coulibaly A, Benit P, de Baulny HO, Rustin P. Mitochondria and diabetes mellitus: untangling a conflictive relationship? J Inherit Metab Dis 32: 684–698, 2009 [DOI] [PubMed] [Google Scholar]
- 35. Scott SV, Cassidy-Stone A, Meeusen SL, Nunnari J. Staying in aerobic shape: how the structural integrity of mitochondria and mitochondrial DNA is maintained. Curr Opin Cell Biol 15: 482–488, 2003 [DOI] [PubMed] [Google Scholar]
- 36. Sesaki H, Jensen RE. Division versus fusion: Dnm1p and Fzo1p antagonistically regulate mitochondrial shape. J Cell Biol 147: 699–706, 1999 [DOI] [PMC free article] [PubMed] [Google Scholar]
- 37. Shen X, Zheng S, Metreveli NS, Epstein PN. Protection of cardiac mitochondria by overexpression of MnSOD reduces diabetic cardiomyopathy. Diabetes 55: 798–805, 2006 [DOI] [PubMed] [Google Scholar]
- 38. Singh J, Chonkar A, Bracken N, Adeghate E, Latt Z, Hussain M. Effect of streptozotocin-induced type 1 diabetes mellitus on contraction, calcium transient, and cation contents in the isolated rat heart. Ann NY Acad Sci 1084: 178–190, 2006 [DOI] [PubMed] [Google Scholar]
- 39. Skulachev VP. Mitochondrial filaments and clusters as intracellular power-transmitting cables. Trends Biochem Sci 26: 23–29, 2001 [DOI] [PubMed] [Google Scholar]
- 40. Suarez J, Hu Y, Makino A, Fricovsky E, Wang H, Dillmann WH. Alterations in mitochondrial function and cytosolic calcium induced by hyperglycemia are restored by mitochondrial transcription factor A in cardiomyocytes. Am J Physiol Cell Physiol 295: C1561–C1568, 2008 [DOI] [PMC free article] [PubMed] [Google Scholar]
- 41. Szabadkai G, Simoni AM, Bianchi K, De Stefani D, Leo S, Wieckowski MR, Rizzuto R. Mitochondrial dynamics and Ca2+ signaling. Biochim Biophys Acta 1763: 442–449, 2006 [DOI] [PubMed] [Google Scholar]
- 42. Vosseller K, Sakabe K, Wells L, Hart GW. Diverse regulation of protein function by O-GlcNAc: a nuclear and cytoplasmic carbohydrate post-translational modification. Curr Opin Chem Biol 6: 851–857, 2002 [DOI] [PubMed] [Google Scholar]
- 43. Wallace DC. A mitochondrial paradigm of metabolic and degenerative diseases, aging, and cancer: a dawn for evolutionary medicine. Annu Rev Genet 39: 359–407, 2005 [DOI] [PMC free article] [PubMed] [Google Scholar]
- 44. Wasiak S, Zunino R, McBride HM. Bax/Bak promote sumoylation of DRP1 and its stable association with mitochondria during apoptotic cell death. J Cell Biol 177: 439–450, 2007 [DOI] [PMC free article] [PubMed] [Google Scholar]
- 45. Ye G, Metreveli NS, Donthi RV, Xia S, Xu M, Carlson EC, Epstein PN. Catalase protects cardiomyocyte function in models of type 1 and type 2 diabetes. Diabetes 53: 1336–1343, 2004 [DOI] [PubMed] [Google Scholar]
- 46. Yoon Y, Krueger EW, Oswald BJ, McNiven MA. The mitochondrial protein hFis1 regulates mitochondrial fission in mammalian cells through an interaction with the dynamin-like protein DLP1. Mol Cell Biol 23: 5409–5420, 2003 [DOI] [PMC free article] [PubMed] [Google Scholar]
- 47. Yu T, Sheu SS, Robotham JL, Yoon Y. Mitochondrial fission mediates high glucose-induced cell death through elevated production of reactive oxygen species. Cardiovasc Res 79: 341–351, 2008 [DOI] [PMC free article] [PubMed] [Google Scholar]
- 48. Zachara NE, Hart GW. Cell signaling, the essential role of O-GlcNAc! Biochim Biophys Acta 1761: 599–617, 2006 [DOI] [PubMed] [Google Scholar]
- 49. Zuchner S, Mersiyanova IV, Muglia M, Bissar-Tadmouri N, Rochelle J, Dadali EL, Zappia M, Nelis E, Patitucci A, Senderek J, Parman Y, Evgrafov O, Jonghe PD, Takahashi Y, Tsuji S, Pericak-Vance MA, Quattrone A, Battaloglu E, Polyakov AV, Timmerman V, Schroder JM, Vance JM. Mutations in the mitochondrial GTPase mitofusin 2 cause Charcot-Marie-Tooth neuropathy type 2A. Nat Genet 36: 449–451, 2004 [DOI] [PubMed] [Google Scholar]


